WGCNA Analyses Within-Tissues
For manuscript: Neurogenomic landscape of male cooperative behavior in a wild bird
Last Substantive Change April 2021
Last Knit “2024-01-06”
## Warning: package 'network' was built under R version 4.0.3## network: Classes for Relational Data
## Version 1.16.1 created on 2020-10-06.
## copyright (c) 2005, Carter T. Butts, University of California-Irvine
## Mark S. Handcock, University of California -- Los Angeles
## David R. Hunter, Penn State University
## Martina Morris, University of Washington
## Skye Bender-deMoll, University of Washington
## For citation information, type citation("network").
## Type help("network-package") to get started.##
## Attaching package: 'network'## The following objects are masked from 'package:igraph':
##
## %c%, %s%, add.edges, add.vertices, delete.edges, delete.vertices,
## get.edge.attribute, get.edges, get.vertex.attribute, is.bipartite,
## is.directed, list.edge.attributes, list.vertex.attributes,
## set.edge.attribute, set.vertex.attribute## The following object is masked from 'package:plyr':
##
## is.discrete## Loading required package: BiocFileCache## Loading required package: dbplyr## Warning: package 'dbplyr' was built under R version 4.0.5##
## Attaching package: 'dbplyr'## The following objects are masked from 'package:dplyr':
##
## ident, sql##
## Attaching package: 'AnnotationHub'## The following object is masked from 'package:Biobase':
##
## cache##
## Attaching package: 'enrichplot'## The following object is masked from 'package:GGally':
##
## ggtable## The following object is masked from 'package:ggpubr':
##
## color_palette## The following object is masked from 'package:lattice':
##
## dotplotkey<- read.csv("../data_filtered/data_key_Parsed_ReplicatesRemoved.csv")
behav<- read.csv("../data_unfiltered/PIPFIL_T_and_behav_data.csv")
rownames(key)<- key$X
key$Color_ID<- sub("/","", key$Color_ID)
key<- plyr::rename(key, replace=c("Color_ID"="colorID"))
behav$status<- plyr::revalue(behav$status, c("floa"="floater", "terr"="territorial"))
key_behav<- merge(key, behav, by="colorID")
key_behav<- key_behav[!is.na(key_behav$last_behav),]
#create a data.frame with all of the observations.
not_in_behav<- key[!key$X %in% key_behav$X,]
cols_not_key<- colnames(key_behav)[!colnames(key_behav) %in% colnames(key)]
cols_not_key_df<- data.frame(matrix(NA, nrow = nrow(not_in_behav), ncol = length(cols_not_key)))
colnames(cols_not_key_df)<- cols_not_key
not_in_behav<- cbind(not_in_behav, cols_not_key_df)
key_behav<- rbind(key_behav, not_in_behav)
rownames(key_behav)<- key_behav$X
key_behav<- subset(key_behav, select=c("sampleID", "Year", "Tissue", "Batch", "Status", "Class", "mean_T", "strength.all_study"))
#key_behav$Class<- word(key_behav$Class,1)
key_behav$Tissue<- factor(key_behav$Tissue, levels=c("GON","PIT","VMH","AH","PVN","POM","ICO","GCT","AI","TNA","LS", "BSTm"))
key_behav<- key_behav[order(rownames(key_behav)),]
key_behav$Class<- plyr::revalue(key_behav$Class, replace=c("SCB floater"="Predefinitive floater", "DCB floater "="Definitive floater", "DCB territorial"="Territorial"))
key_behav$Class<- factor(key_behav$Class, levels=c("Predefinitive floater", "Definitive floater", "Territorial"))
rownames(key_behav)<- key_behav$sampleID
key_behav<- key_behav[order(key_behav$sampleID),]
#read the raw count data
data<- read.csv("../data_filtered/data_RawCounts_all_ReplicatesRemoved_antisense_V2.csv")
rownames(data)<- data$X
data$X<- NULL
genes_key<- read.csv("../GO_annotations/Maggies_annotations_modifiedR.csv")
genes_key<- plyr::rename(genes_key, replace=c("GeneID"="gene"))
data_genes<- data.frame(gene=rownames(data))
genes_key<- merge(data_genes, genes_key, by="gene", all.x=TRUE)
genes_key$display_gene_ID<- ifelse(is.na(genes_key$best_anno), as.character(genes_key$gene), ifelse(genes_key$best_anno!=genes_key$gene, paste0(genes_key$gene,"/", genes_key$best_anno), as.character(genes_key$best_anno)))
go_terms<- read.csv("../GO_annotations/pfil_GO_key_raw.csv")
go_terms<- plyr::rename(go_terms, replace=c("GeneID"="gene"))
go2gene_bp<- go_terms[which(go_terms$Aspect=="P"),c("GO_ID", "gene")]
go2gene_mf<- go_terms[which(go_terms$Aspect=="F"),c("GO_ID", "gene")]
go_obo<- read.csv("../GO_annotations/ontology_obo_out.csv")
go_obo<- plyr::rename(go_obo, replace=c("id"="GO_ID"))
go2name_bp<- go_obo[which(go_obo$namespace=="biological_process"),c("GO_ID", "name")]
go2name_mf<- go_obo[which(go_obo$namespace=="molecular_function"),c("GO_ID", "name")]1 Gonads (GON)
Like the DESeq2 document, the Gonads section will contain the code used throughout the the analysis to achieve the full set of results. First, each dataset is filtered conservatively as per the DESeq2 workflow, and then any batch effects identified in the DEseq workflow are removed here. Then we create a midweight bicorrelation weighted signed network using the recommended options. The Topological Overlap Matrix is also signed.
1.1 Data quality control
tissue<- "GON"
gon_key<- subset(key_behav, Tissue==tissue)
gon_key<- droplevels(gon_key)

gon_data<- data[,colnames(data) %in% rownames(gon_key)]


start<- nrow(gon_data)
#remove genes with less than 5 reads
gon_data$avg_count<- apply(gon_data, 1, mean)
gon_data<- gon_data[gon_data$avg_count>5,]
gon_data$avg_count<-NULL
#gon_data$mad<- apply(gon_data,1,mad)
#gon_data$var<- apply(gon_data, 1, var) # could filter by variance rather than MAD maybe <0.2 but these filtering methods all seem to achieve this.

#remove genes where >50% of samples have 0 gene expression
gon_data$percent_0<- apply(gon_data, 1, function(x)length(x[x==0]))
thresh<- ncol(gon_data)/2
gon_data<- gon_data[gon_data$percent_0<=thresh,]
gon_data$percent_0<-NULL
nrow(gon_data)
## [1] 16169## Warning in DESeqDataSet(se, design = design, ignoreRank): some variables in
## design formula are characters, converting to factors## estimating size factors## estimating dispersions## gene-wise dispersion estimates## mean-dispersion relationship## final dispersion estimates## fitting model and testing## -- replacing outliers and refitting for 175 genes
## -- DESeq argument 'minReplicatesForReplace' = 7
## -- original counts are preserved in counts(dds)## estimating dispersions## fitting model and testingdd<- dd[which(mcols(dd)$betaConv),]
vsd_data<- getVarianceStabilizedData(dd)
mat<- limma::removeBatchEffect(vsd_data, gon_key$Batch)
datExpr0<- as.data.frame(t(mat))
gsg = goodSamplesGenes(datExpr0, verbose = 3)## Flagging genes and samples with too many missing values...
## ..step 1## [1] TRUE1.2 Soft-threshold selection
powers<- c(seq(1, 11, by = 1), seq(12, 26, by = 2))


sft<- pickSoftThreshold(datExpr0, powerVector=powers, verbose=0, networkType="signed")
## Power SFT.R.sq slope truncated.R.sq mean.k. median.k. max.k.
## 1 1 0.0406 16.20 0.920 8090.0 8090.00 8330
## 2 2 0.0284 -3.75 0.684 4440.0 4410.00 4990
## 3 3 0.3020 -5.40 0.739 2610.0 2570.00 3360
## 4 4 0.6060 -4.84 0.877 1630.0 1580.00 2450
## 5 5 0.7690 -4.13 0.946 1070.0 1020.00 1870
## 6 6 0.8240 -3.56 0.972 726.0 675.00 1490
## 7 7 0.8620 -3.20 0.987 511.0 462.00 1230
## 8 8 0.8840 -2.95 0.994 370.0 324.00 1030
## 9 9 0.8980 -2.75 0.996 275.0 232.00 880
## 10 10 0.9070 -2.60 0.995 209.0 169.00 762
## 11 11 0.9090 -2.49 0.992 162.0 125.00 668
## 12 12 0.9090 -2.40 0.987 128.0 93.40 591
## 13 14 0.9020 -2.26 0.977 82.9 54.60 474
## 14 16 0.8920 -2.16 0.967 56.6 33.10 389
## 15 18 0.8740 -2.07 0.949 40.3 20.80 325
## 16 20 0.8780 -1.97 0.946 29.7 13.50 276
## 17 22 0.8660 -1.90 0.933 22.5 8.97 237
## 18 24 0.8510 -1.84 0.913 17.4 6.12 206
## 19 26 0.8540 -1.76 0.909 13.8 4.28 181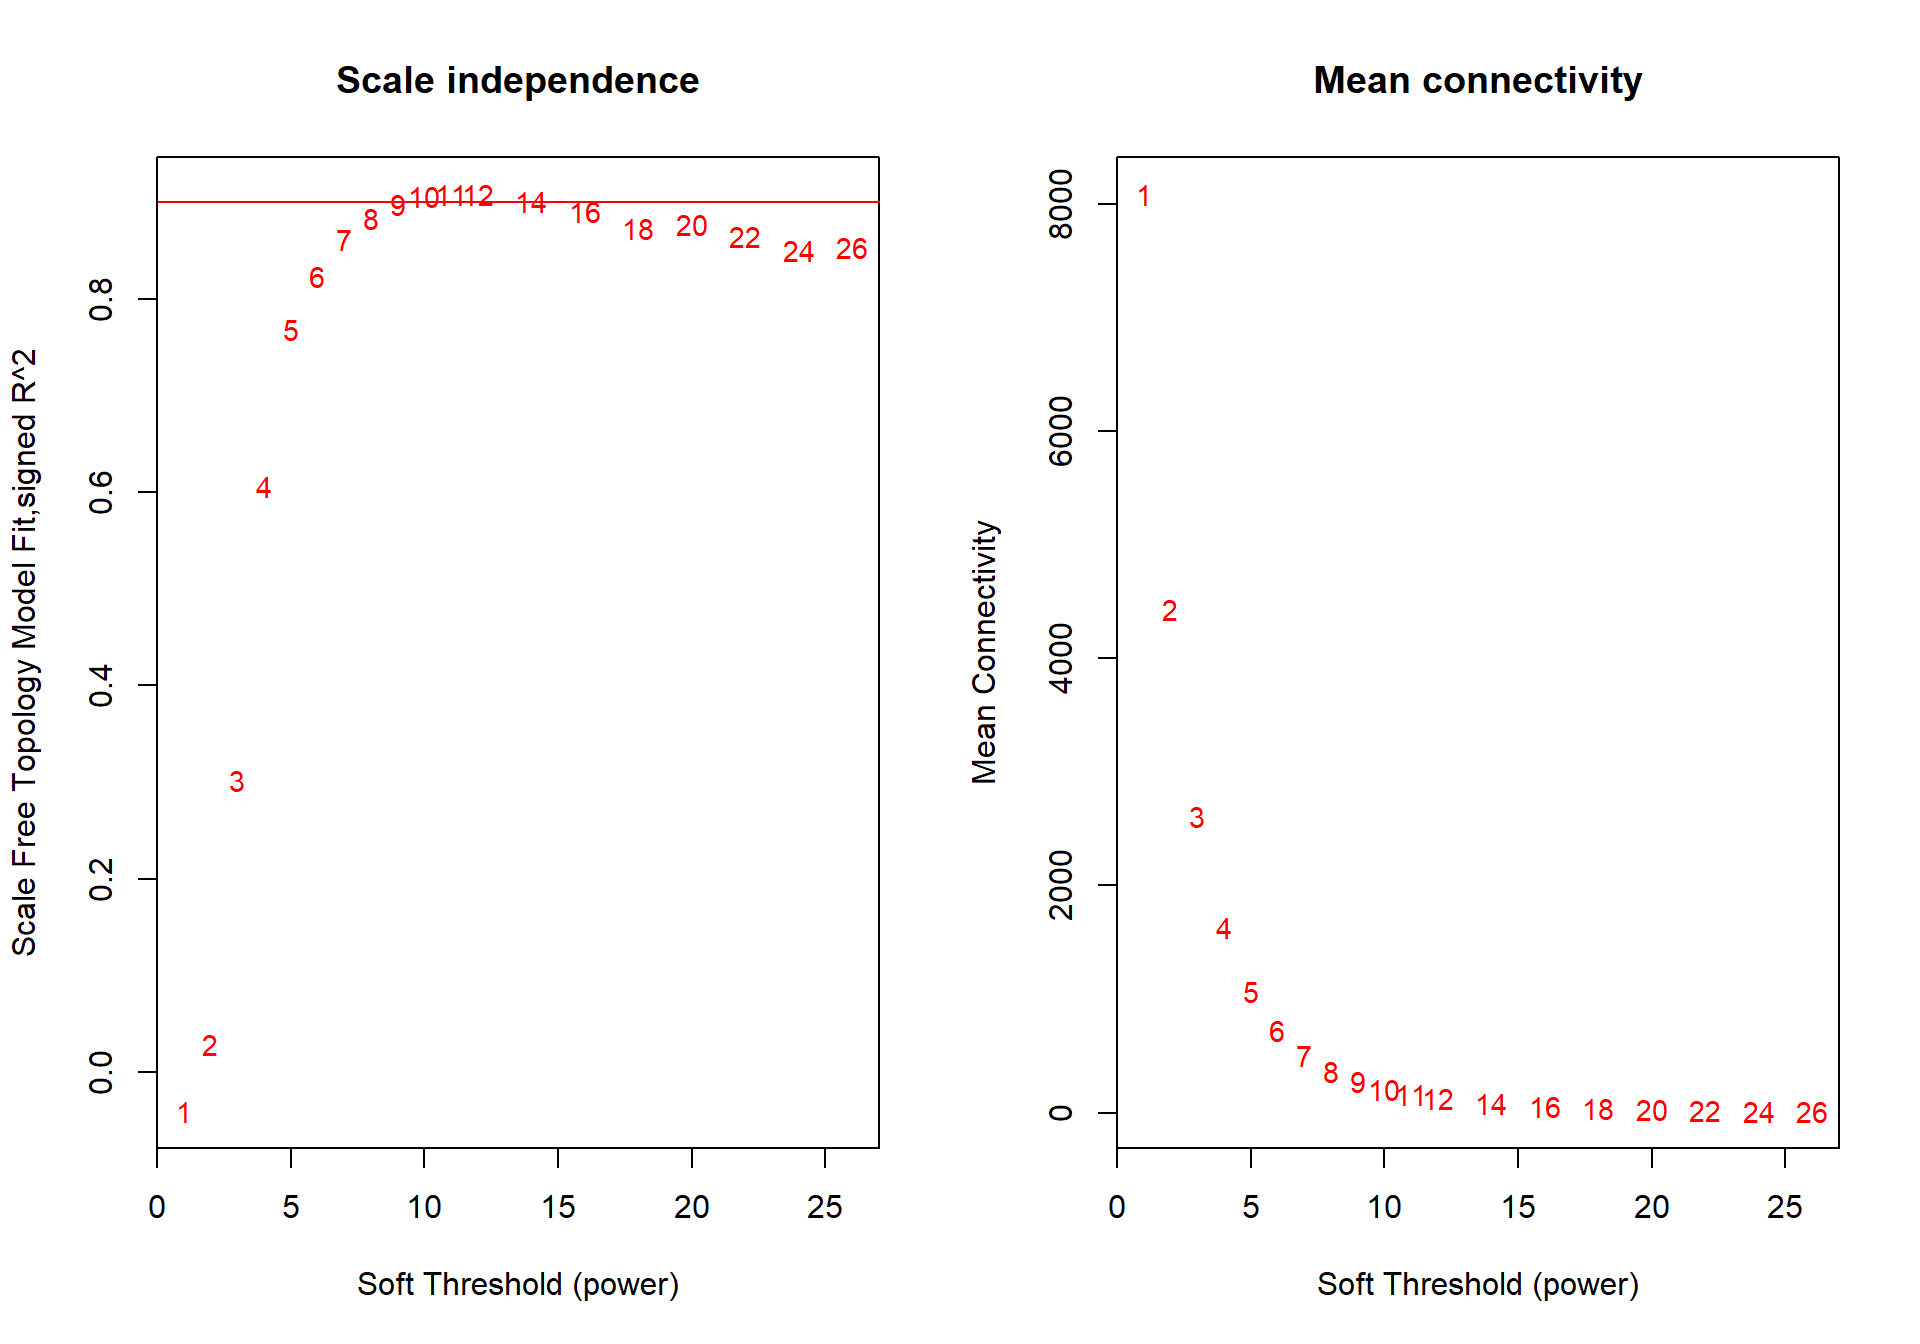
The soft power selected will be the first power that that reaches scale free topology.
1.3 Adjacency Matrix
The adjacency matrix was run on an HPC to speed up run time and prevent overloading my personal computer.
softPower=10
datExpr0<- read.csv("GON_vsd_batch_rm.csv")
rownames(datExpr0)<- datExpr0$X
datExpr0$X<- NULL
adjacency<- adjacency(datExpr0, power = softPower, type="signed")
TOM<- TOMsimilarity(adjacency, TOMtype="signed")
#dissTOM<- 1-TOM
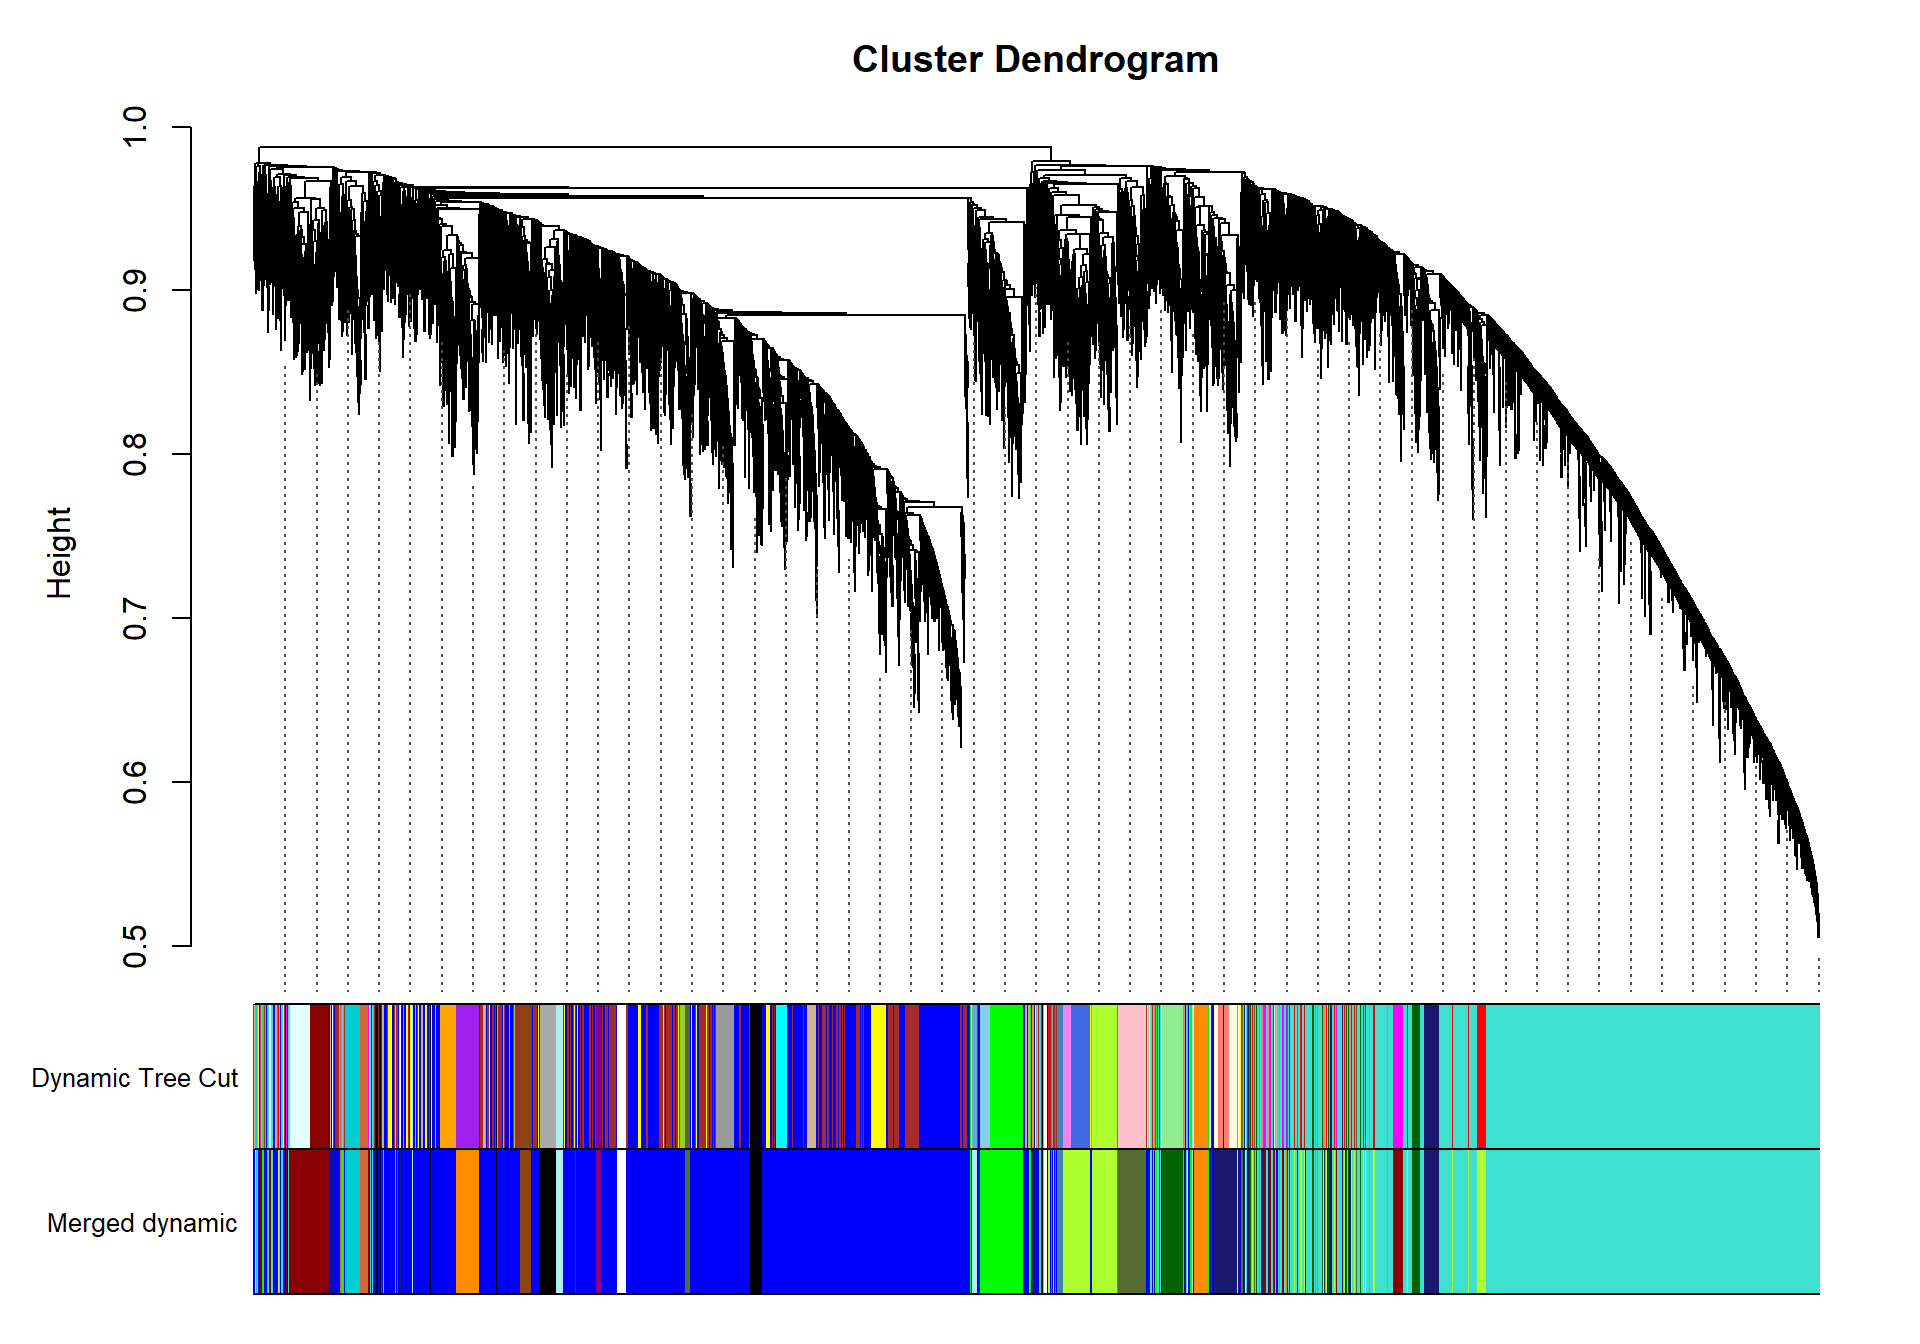
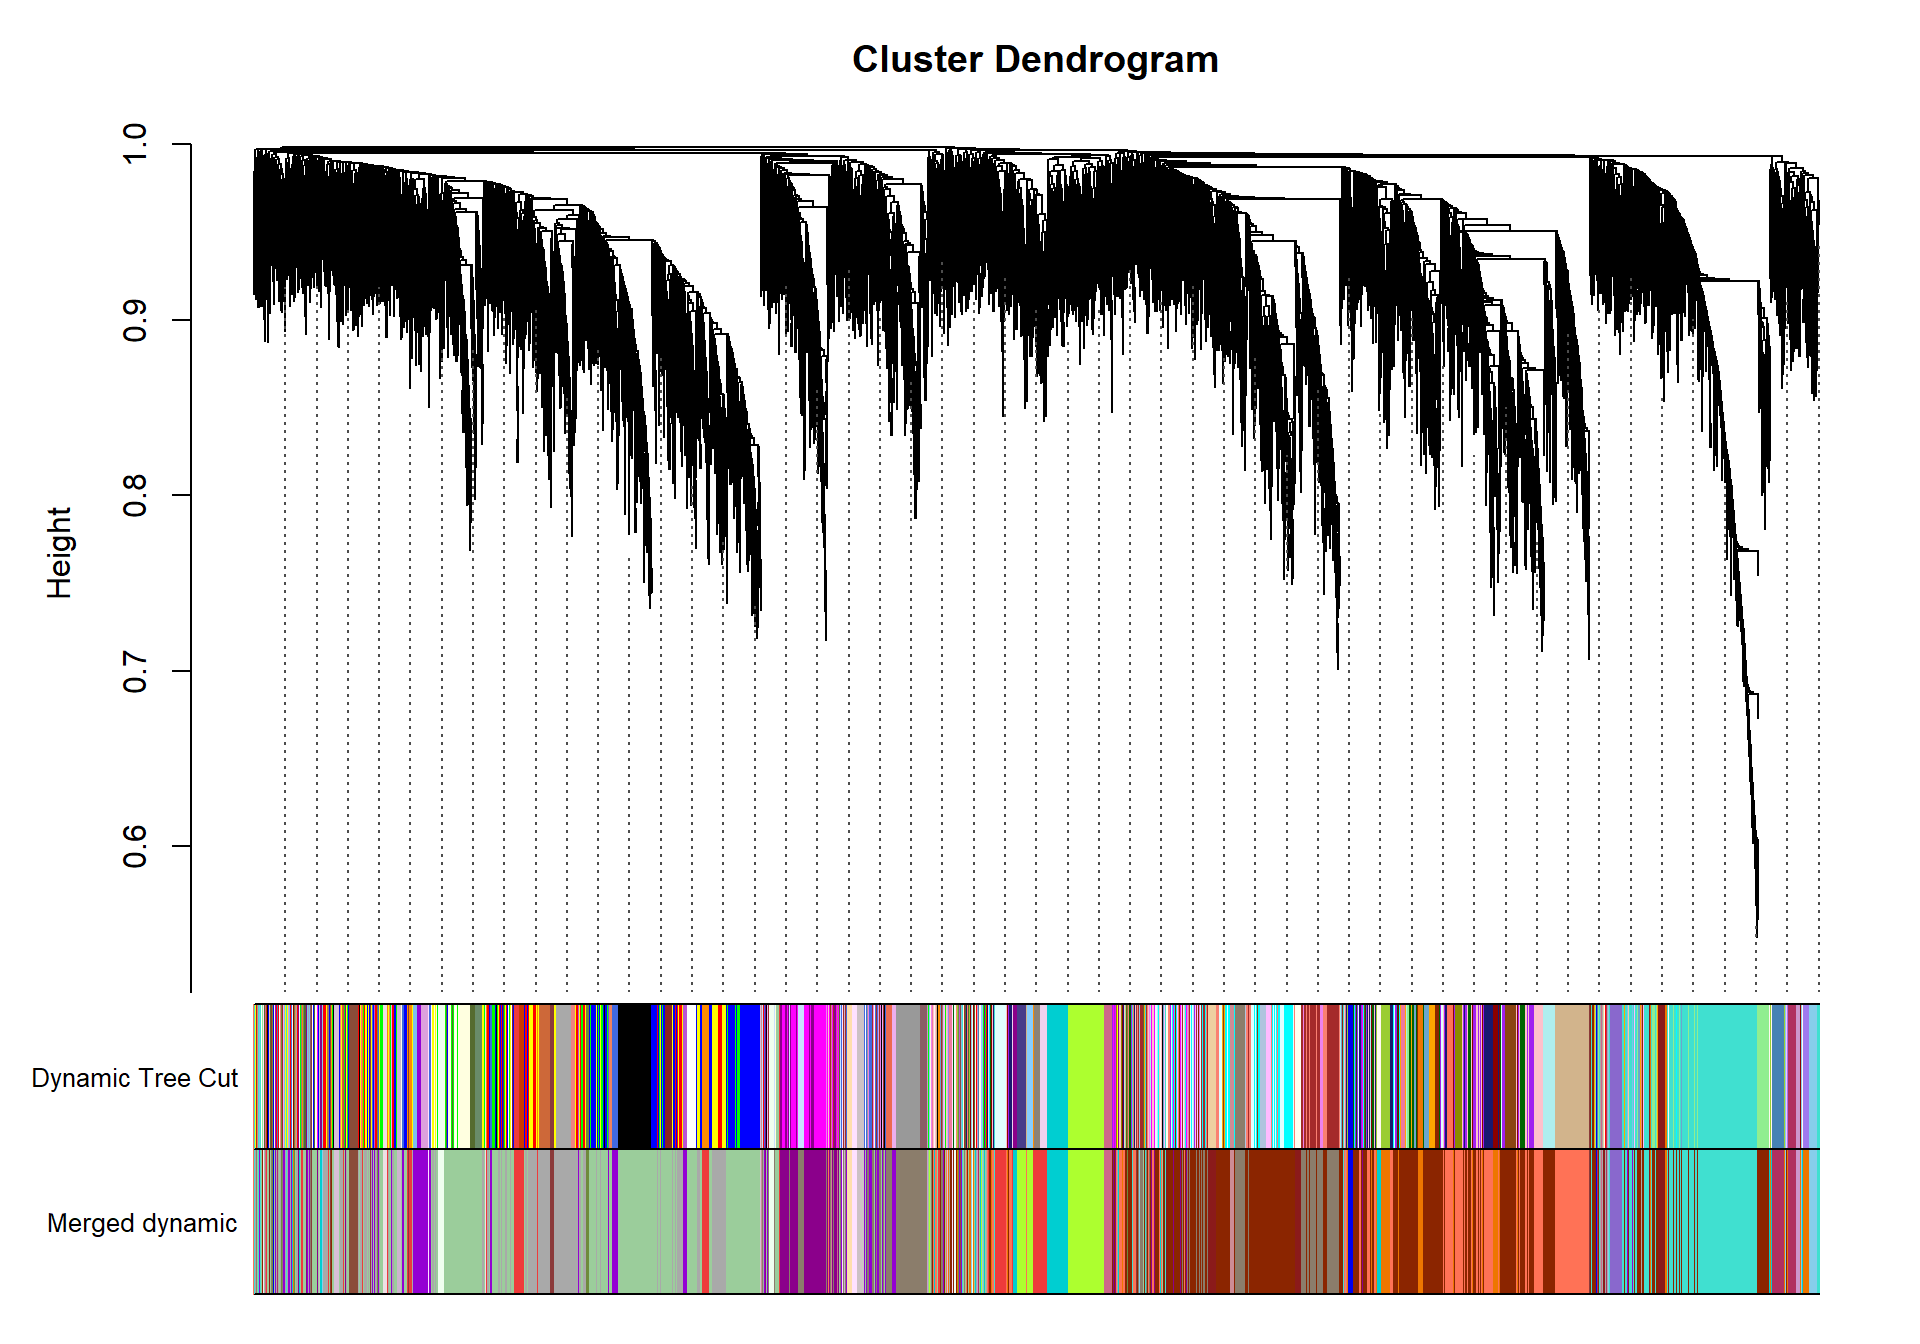
save(adjacency, dissTOM, file="GON_network.RData")1.4 Identify co-expression modules
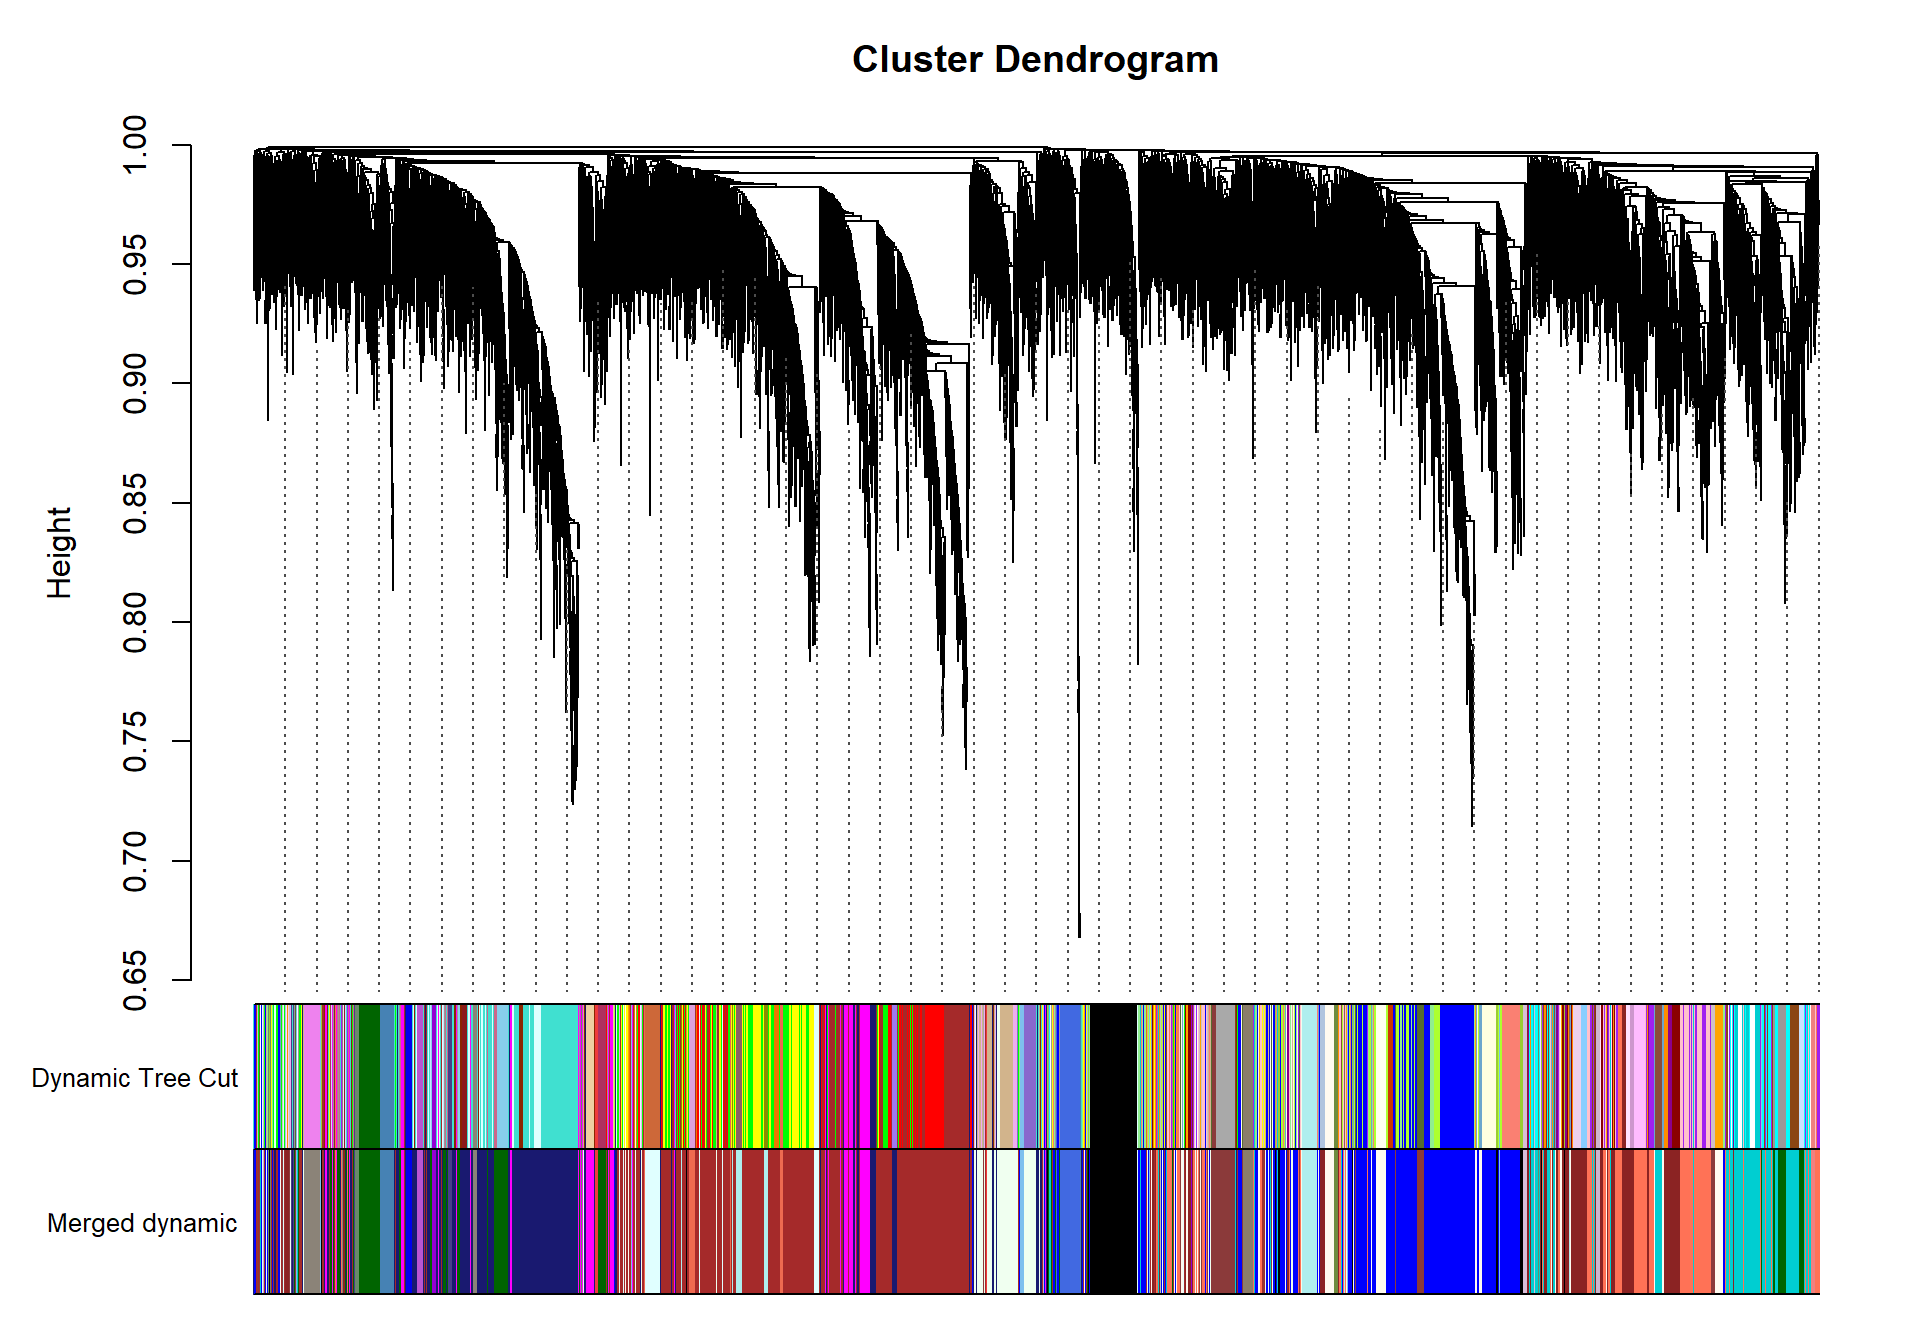
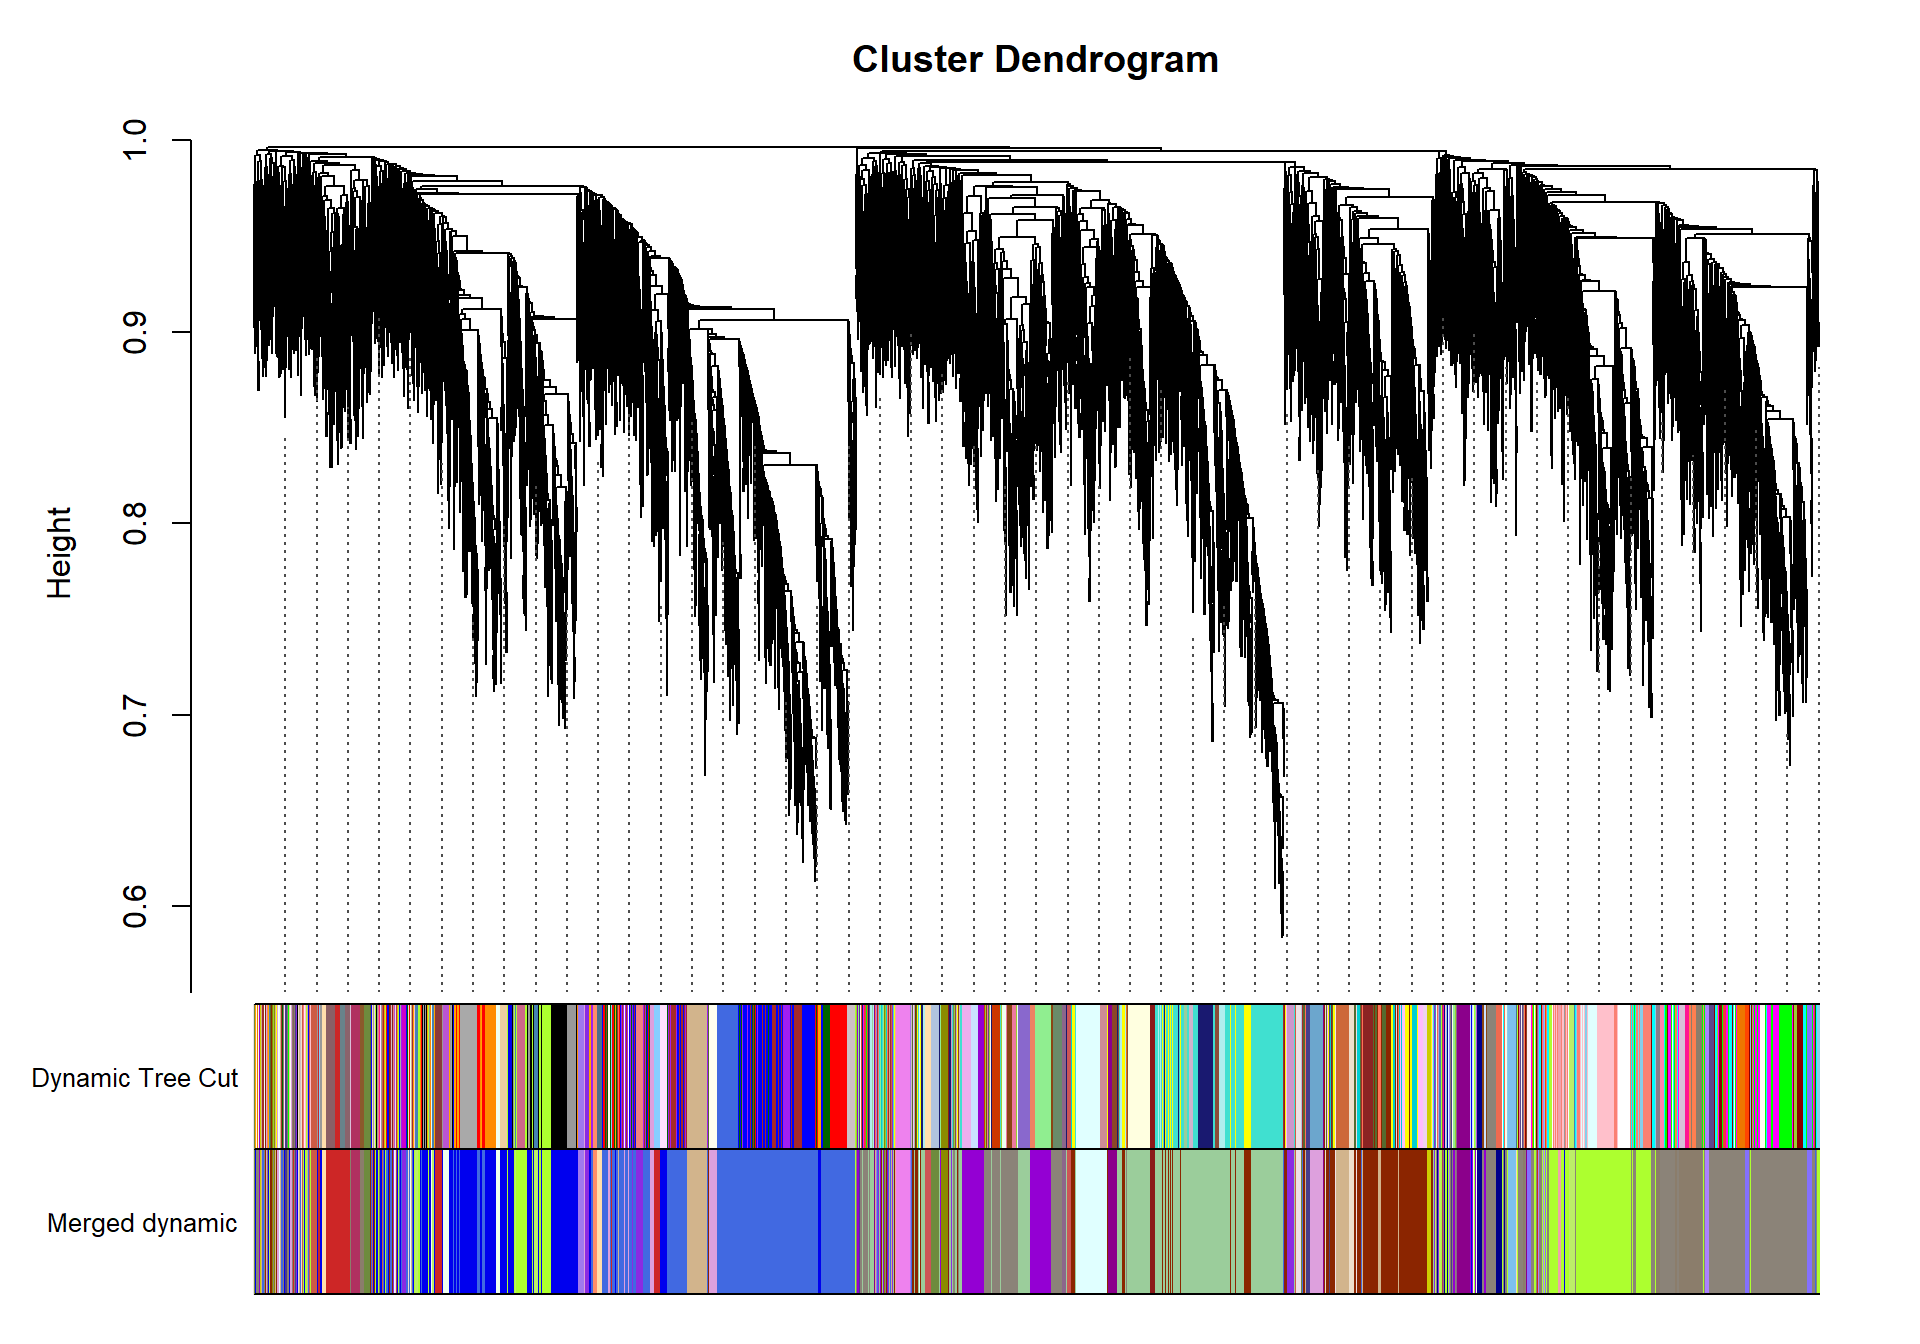
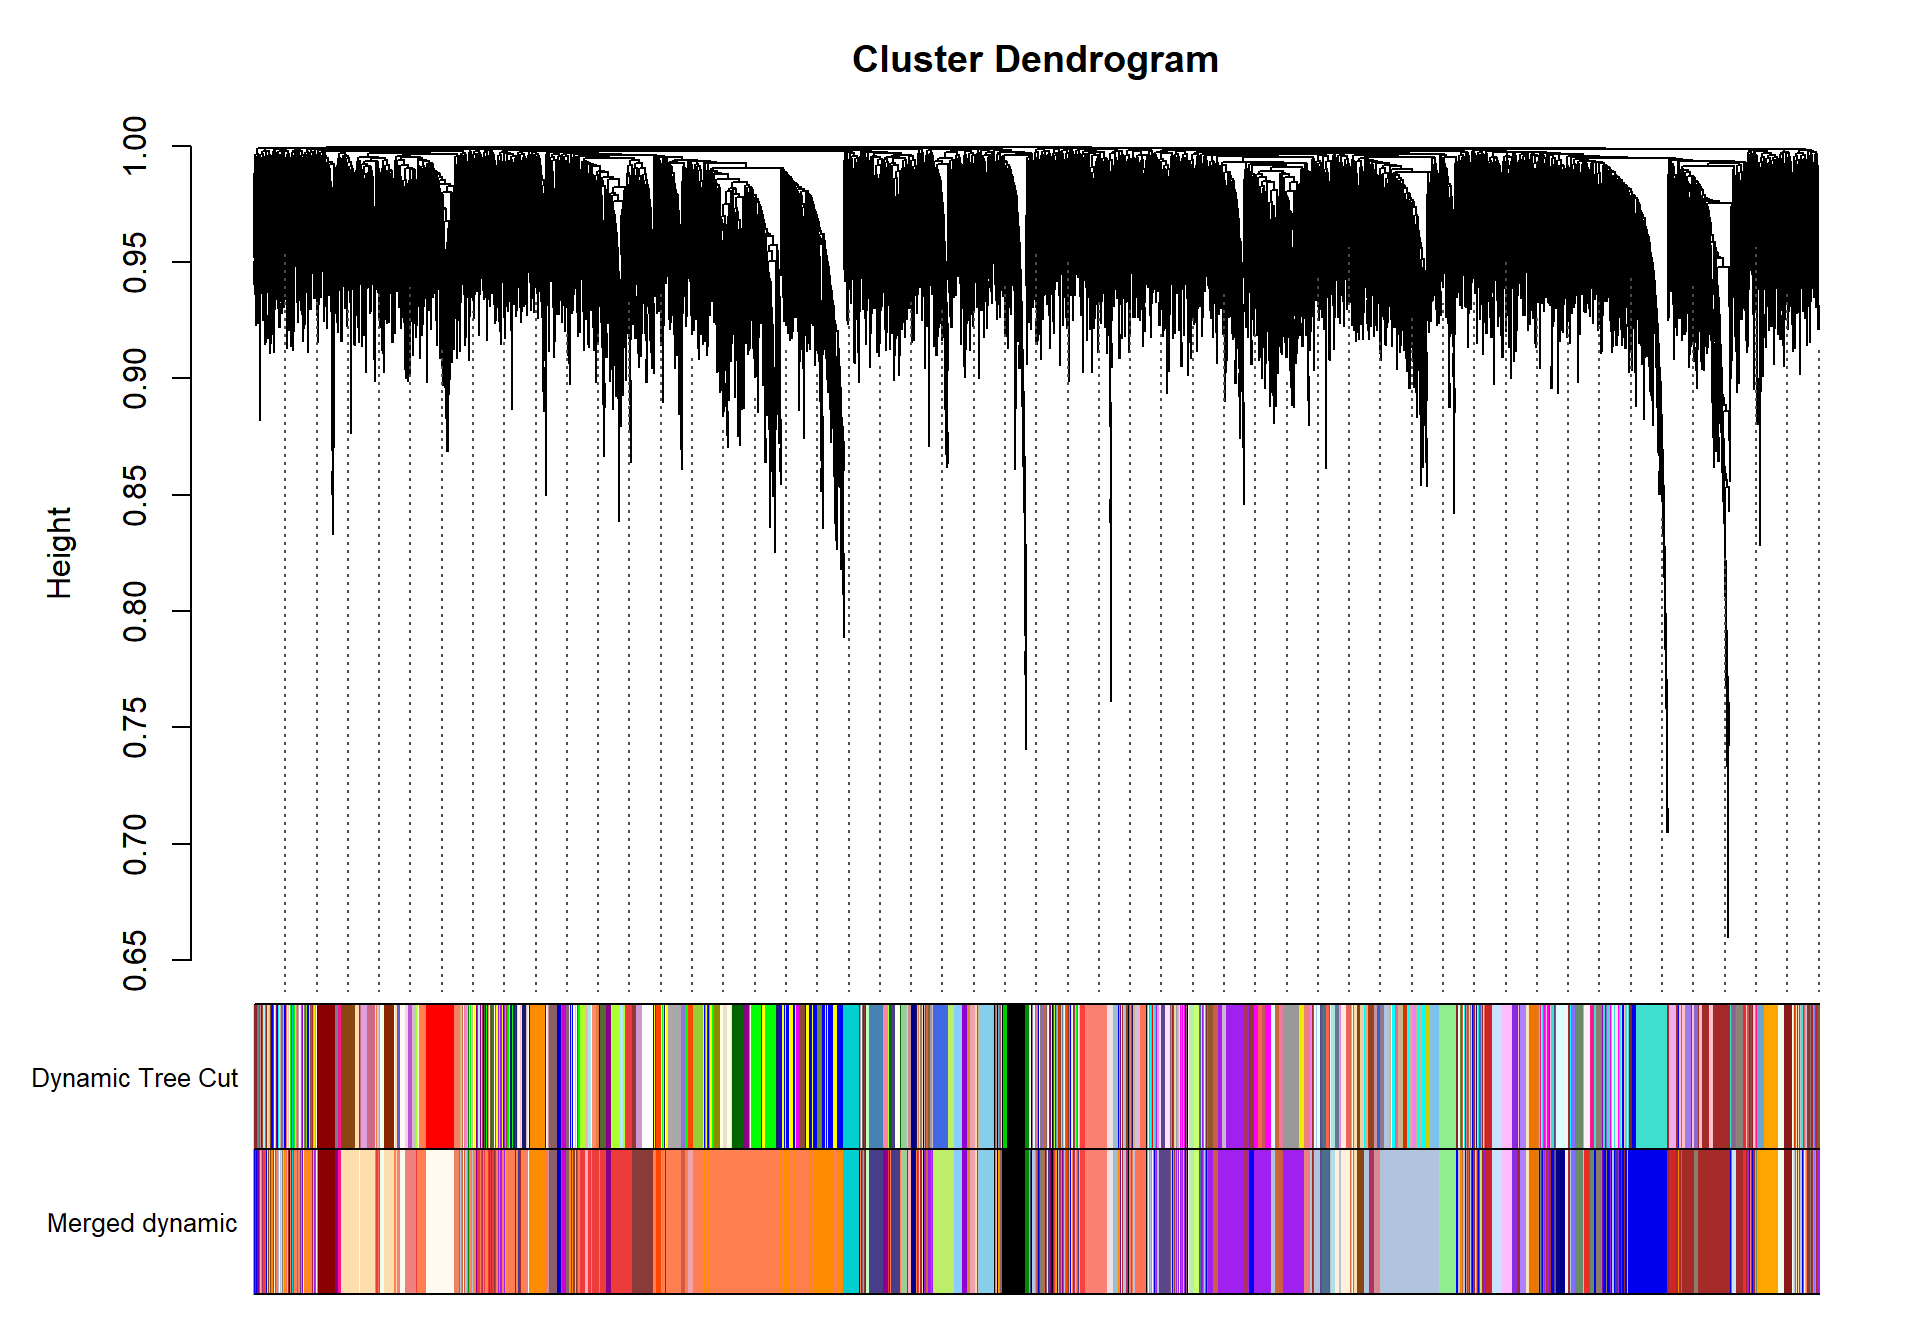
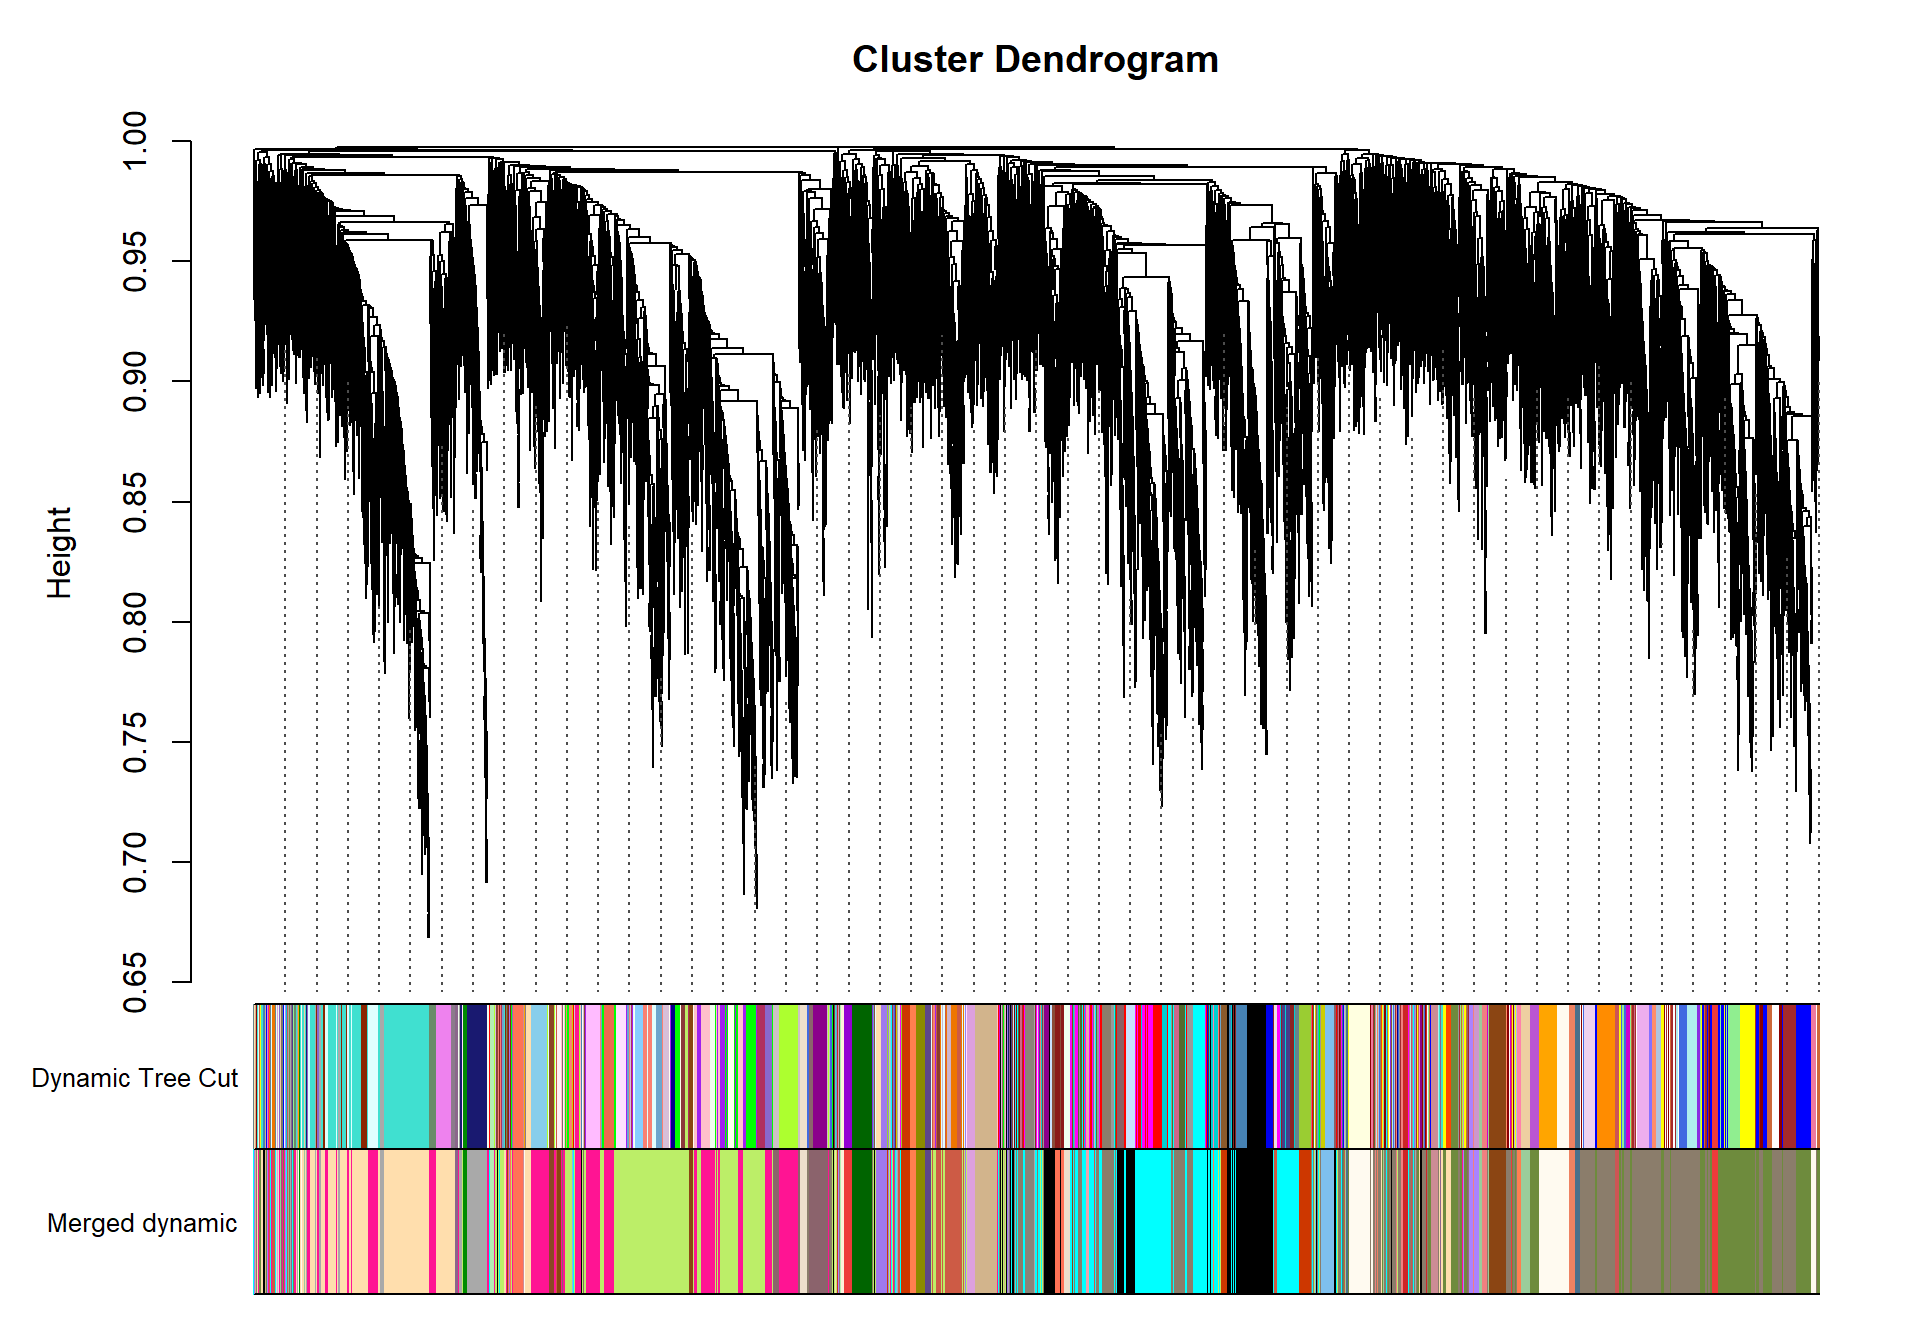
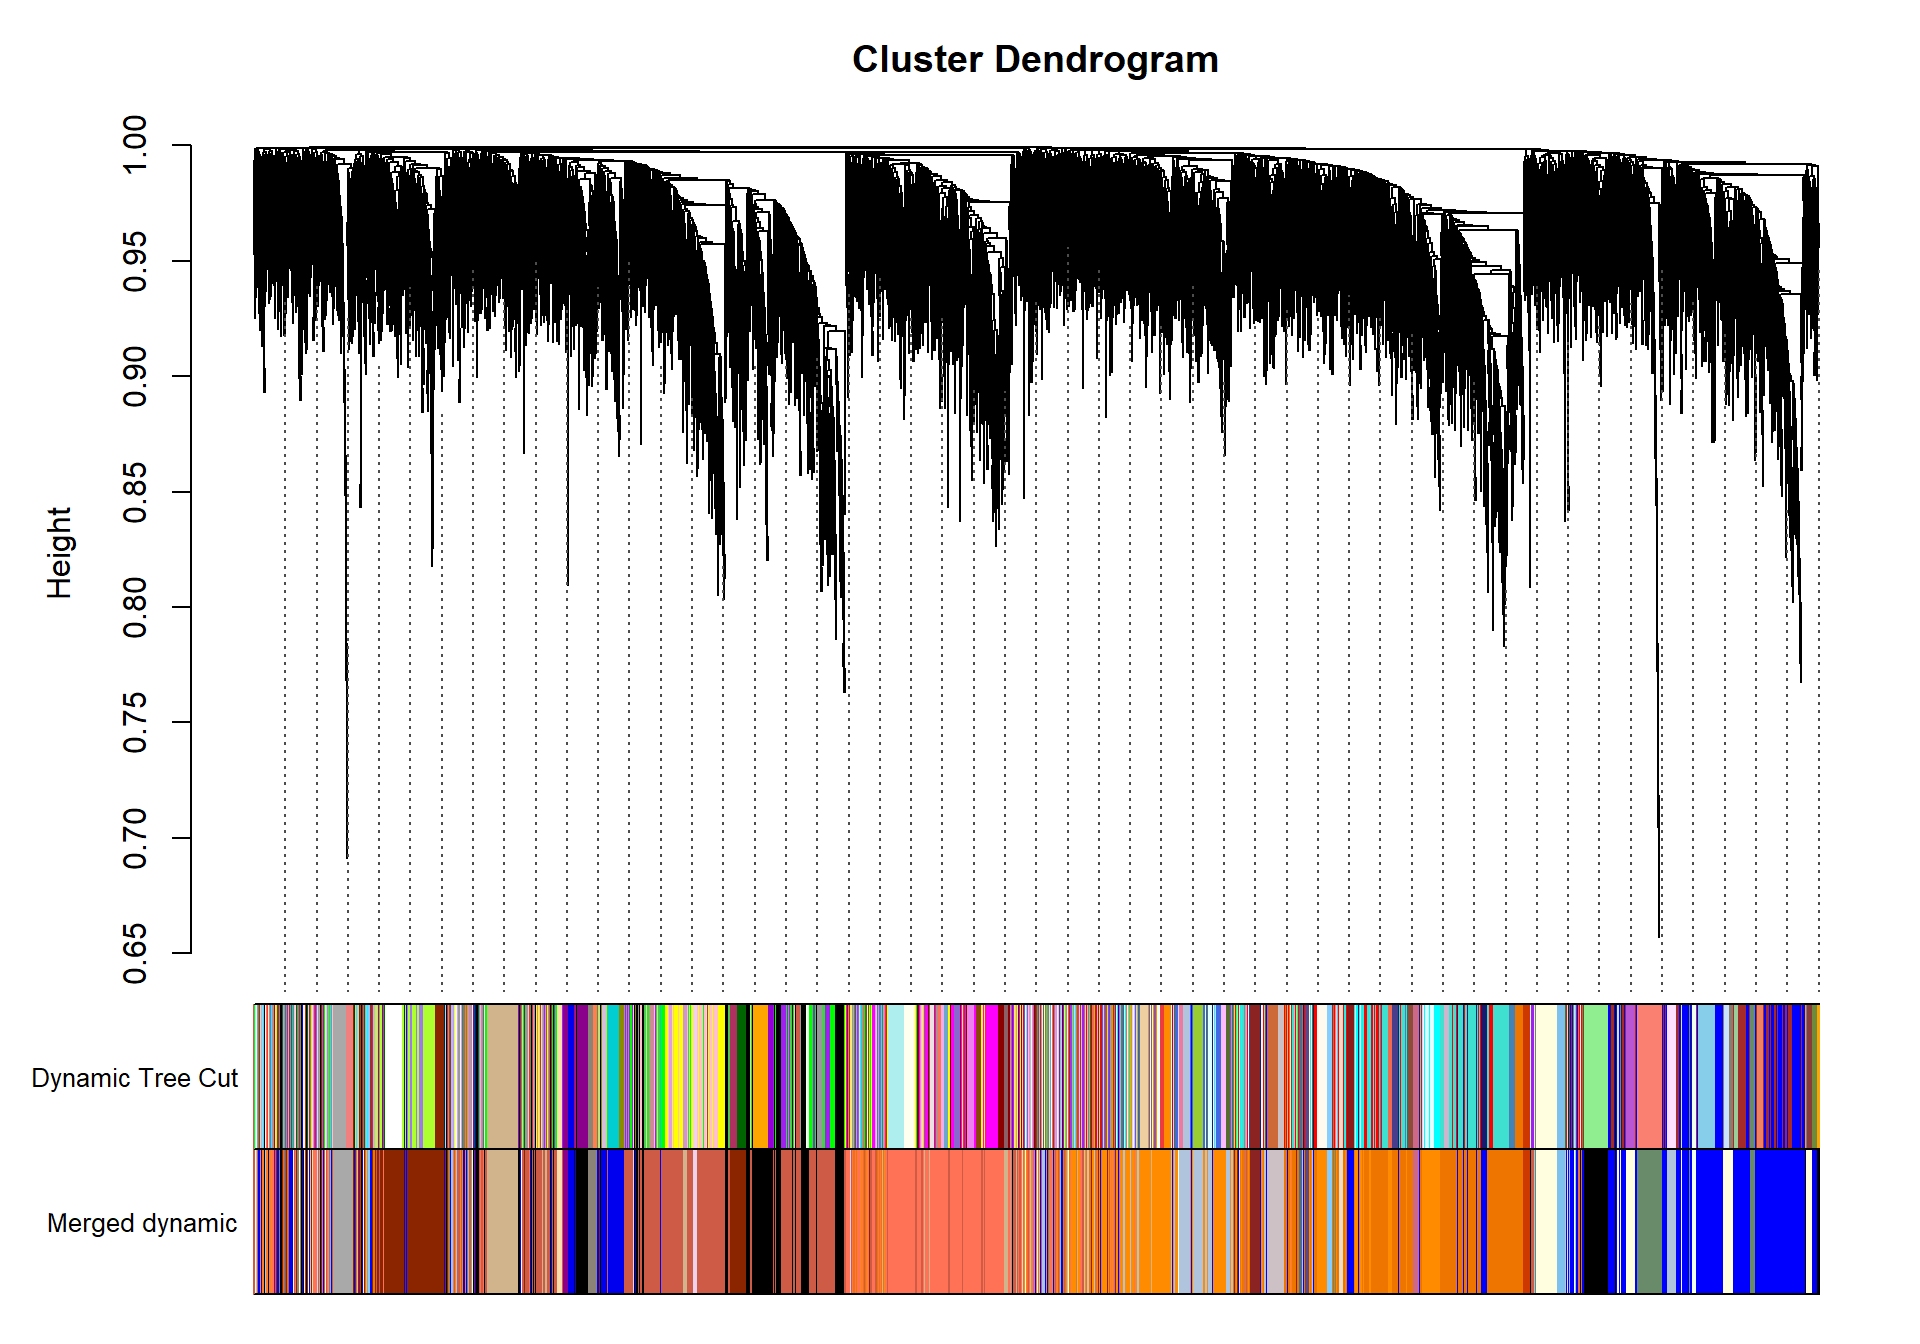
load("../WGCNA_results/within_tissues/GON_network.RData")
dissTOM<- 1-TOM
geneTree= flashClust(as.dist(dissTOM), method="average")

#plot(geneTree, xlab="", sub="", main= "Gene Clustering on TOM-based dissimilarity", labels= FALSE, hang=0.04)
minModuleSize<-30
dynamicMods<-cutreeDynamic(dendro= geneTree, distM= dissTOM, deepSplit=2, pamRespectsDendro= FALSE, minClusterSize= minModuleSize)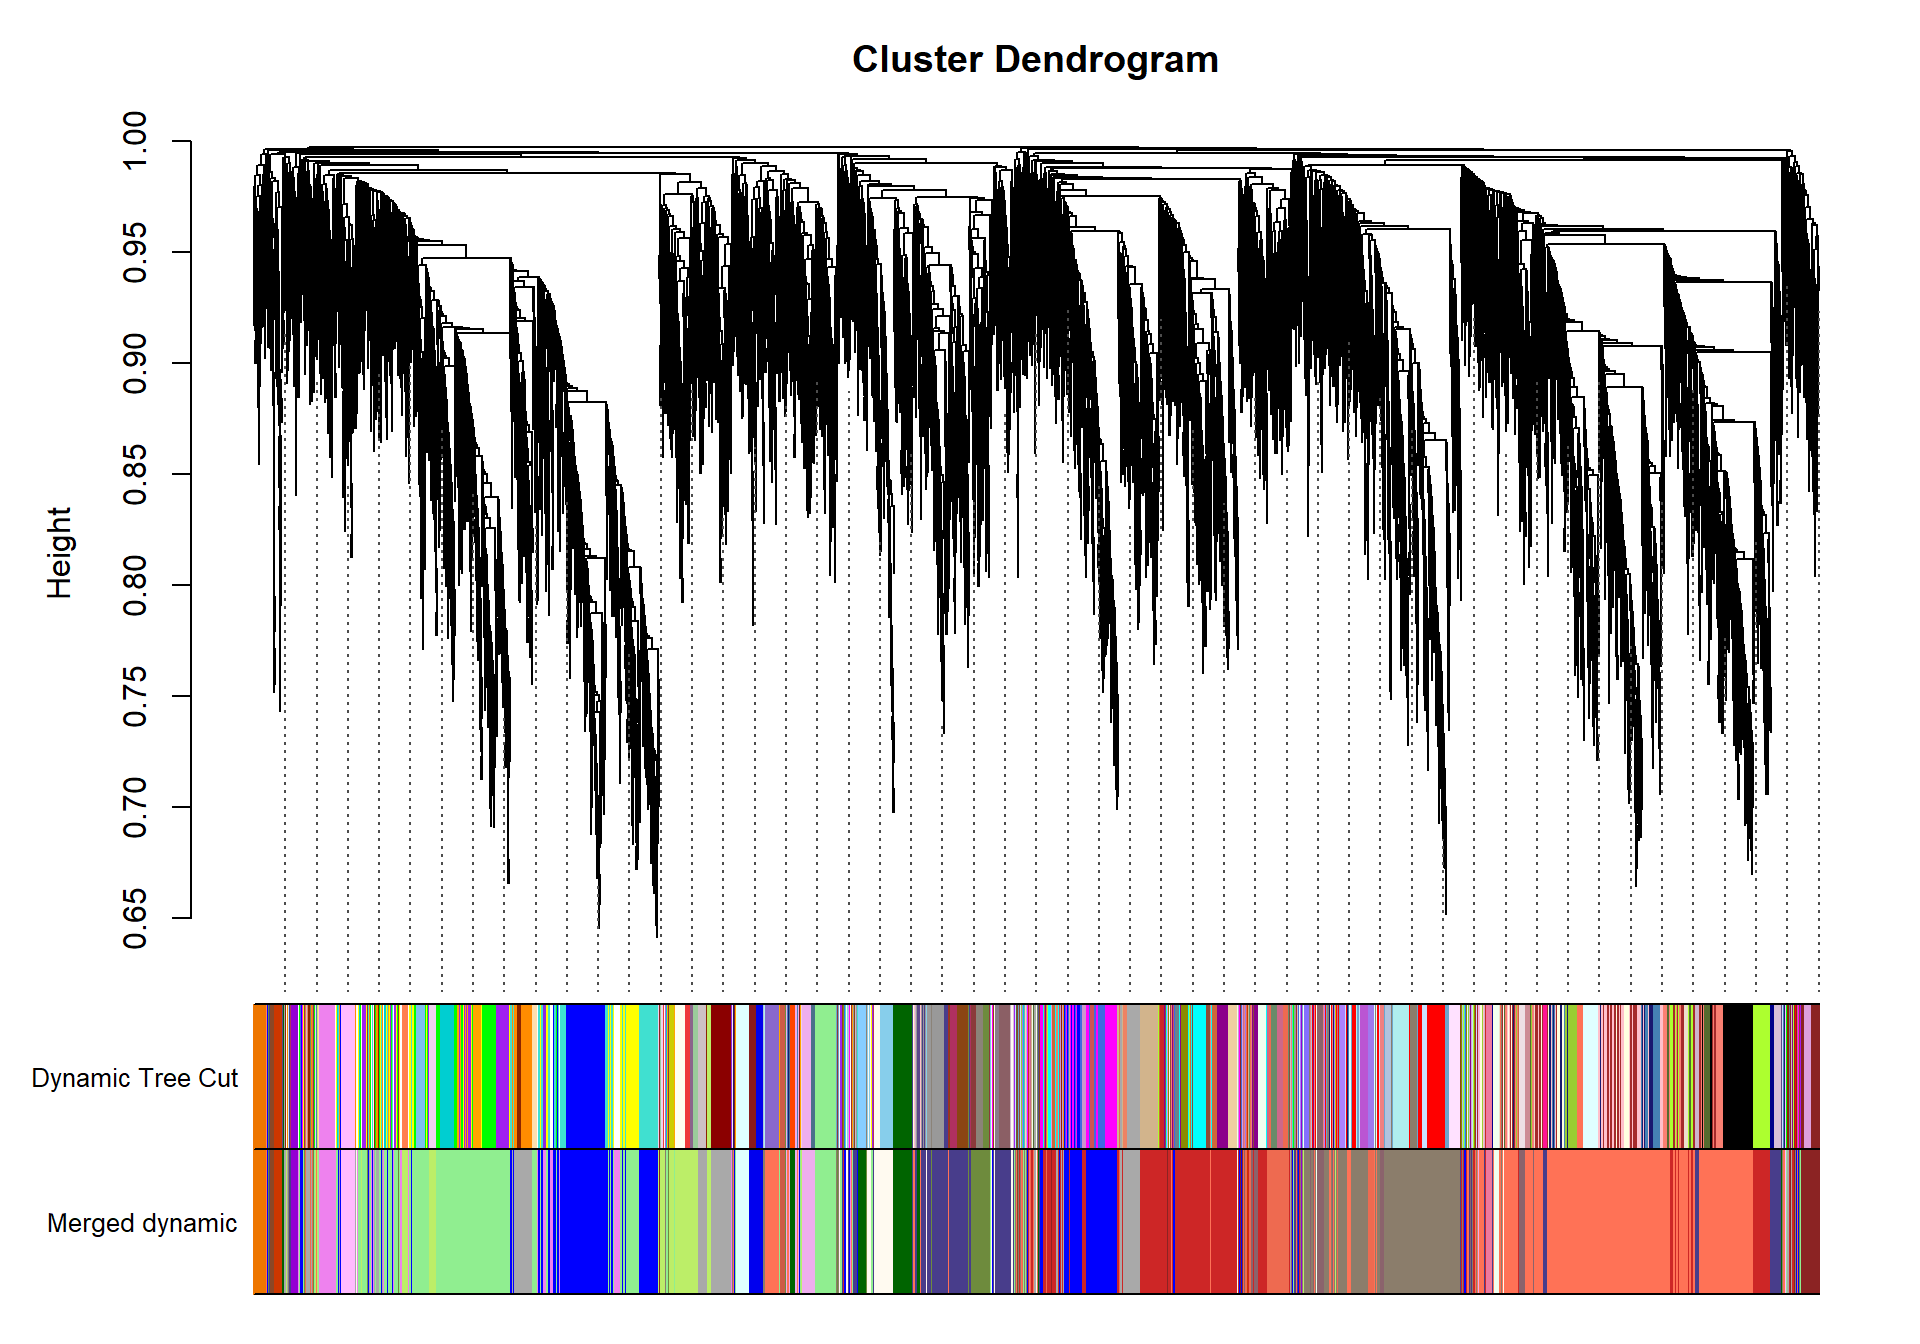
#table(dynamicMods)dynamicColors= labels2colors(dynamicMods)
plotDendroAndColors(geneTree, dynamicColors, "Dynamic Tree Cut", dendroLabels= FALSE, hang=0.03, addGuide= TRUE, guideHang= 0.05, main= "Gene dendrogram and module colors")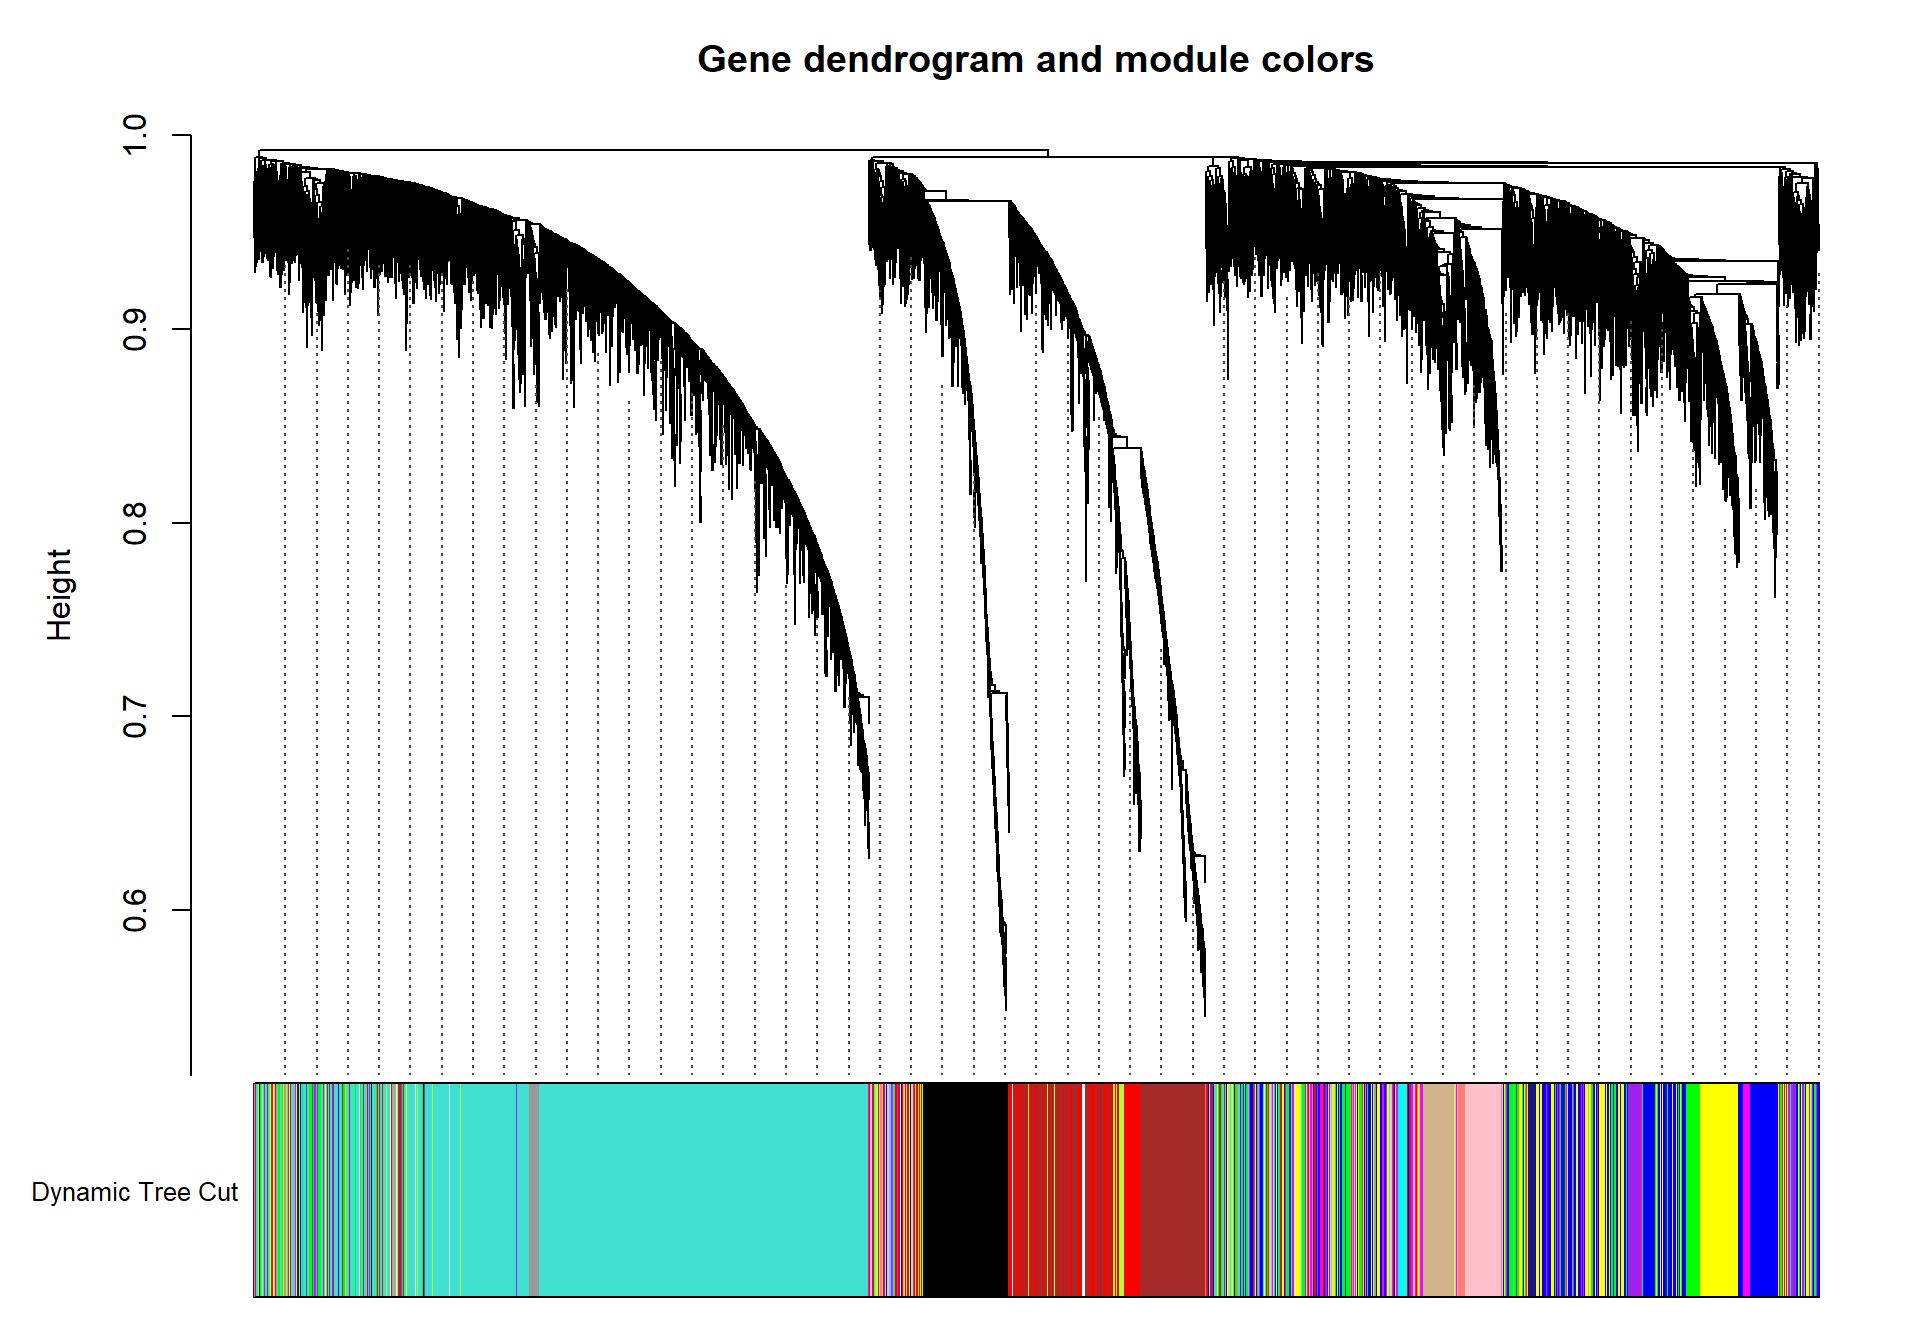
#-----Merge modules whose expression profiles are very similar
MEList= moduleEigengenes(datExpr0, colors= dynamicColors)
MEs= MEList$eigengenes
#Calculate dissimilarity of module eigenegenes
MEDiss= 1-cor(MEs)
#Cluster module eigengenes
METree= flashClust(as.dist(MEDiss), method= "average")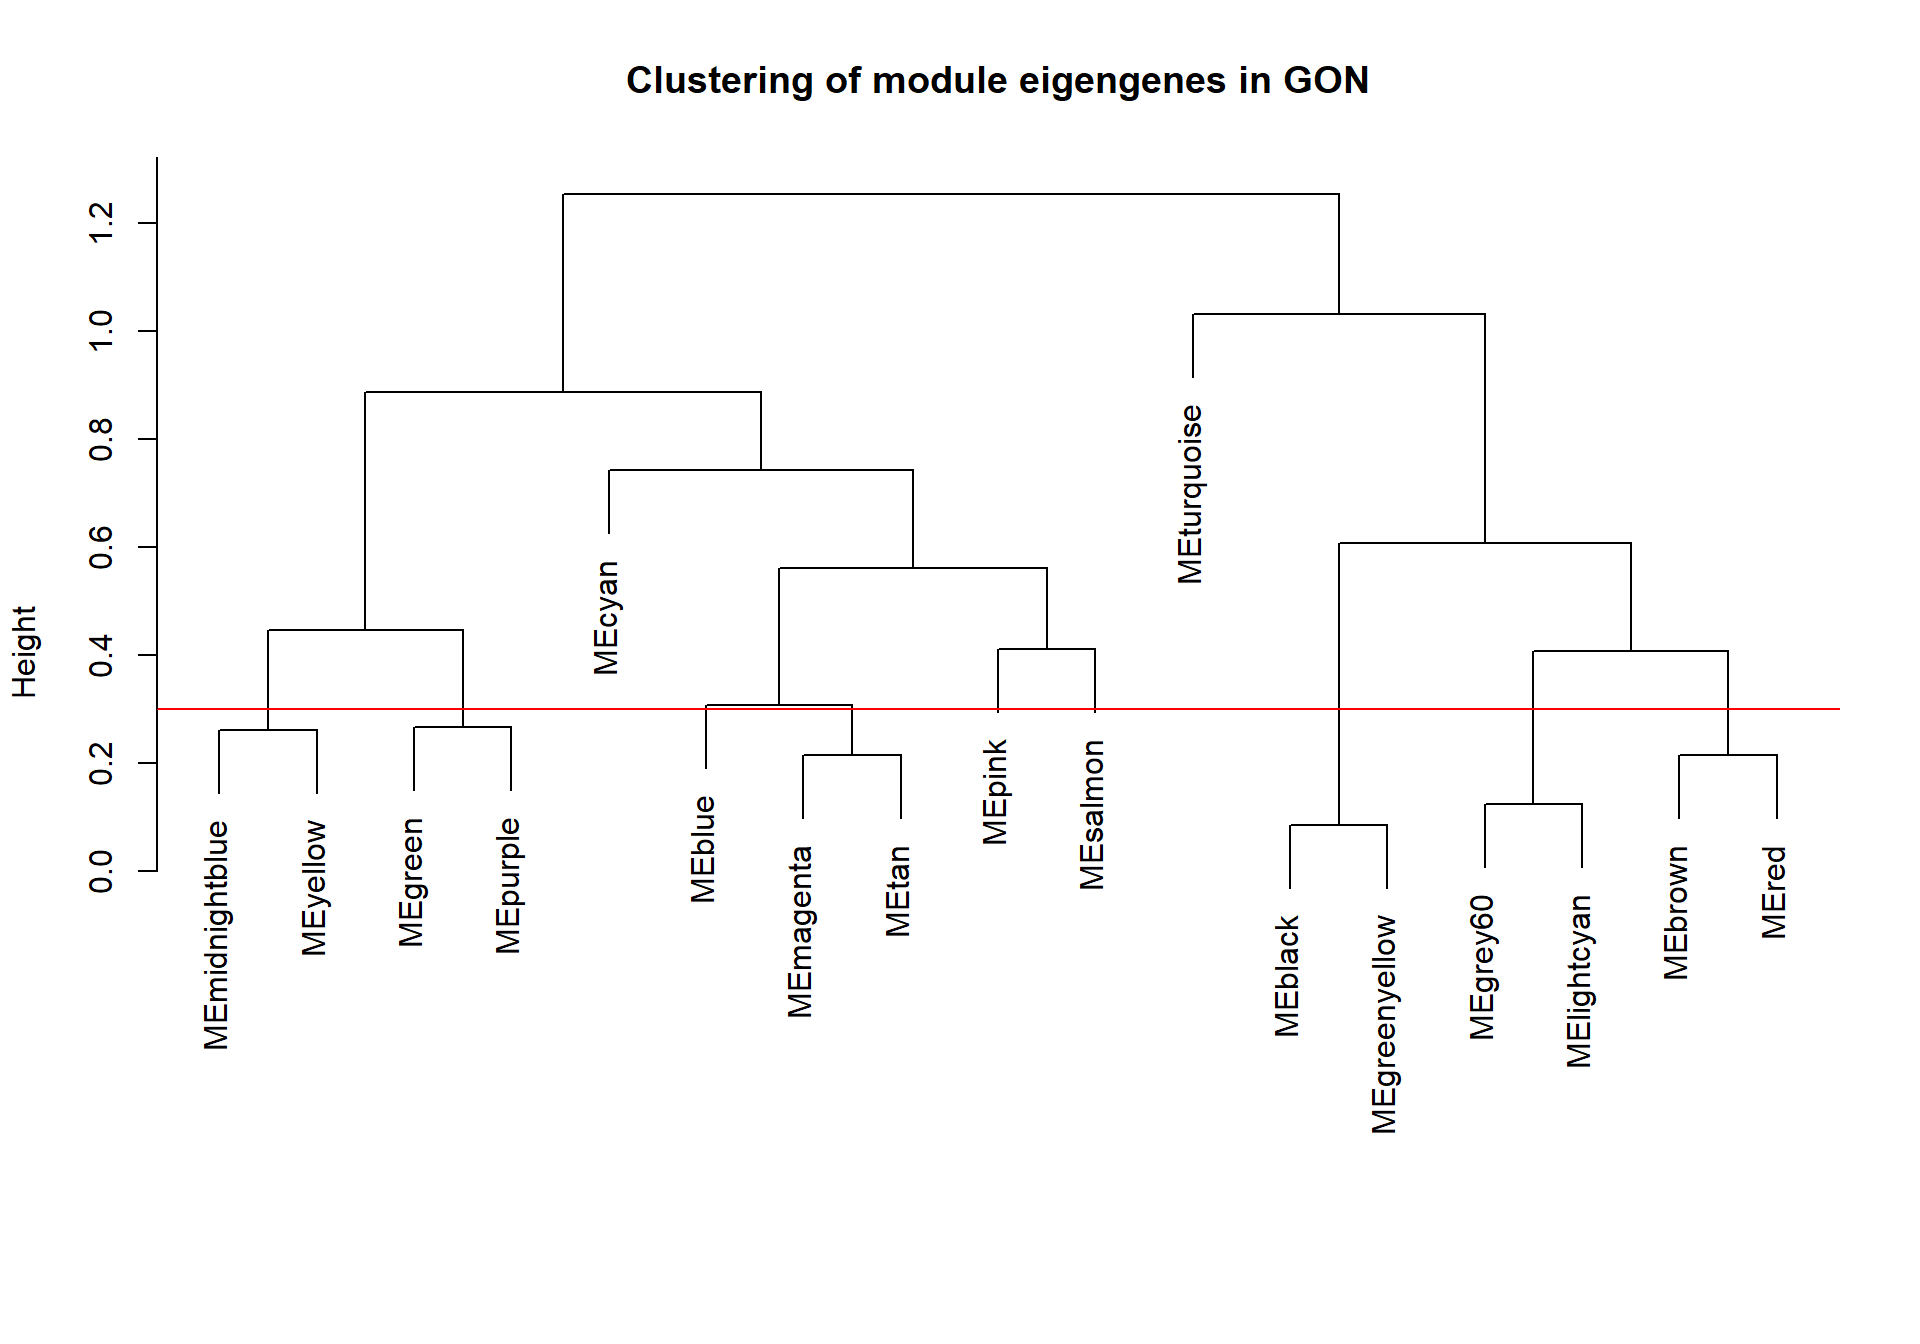
##  mergeCloseModules: Merging modules whose distance is less than 0.3
##    multiSetMEs: Calculating module MEs.
##      Working on set 1 ...
##      moduleEigengenes: Calculating 17 module eigengenes in given set.
##    multiSetMEs: Calculating module MEs.
##      Working on set 1 ...
##      moduleEigengenes: Calculating 11 module eigengenes in given set.
##    multiSetMEs: Calculating module MEs.
##      Working on set 1 ...
##      moduleEigengenes: Calculating 10 module eigengenes in given set.
##    Calculating new MEs...
##    multiSetMEs: Calculating module MEs.
##      Working on set 1 ...
## moduleEigengenes: Calculating 10 module eigengenes in given set.plotDendroAndColors(geneTree, cbind(dynamicColors, mergedColors), c("Dynamic Tree Cut", "Merged dynamic"), dendroLabels= FALSE, hang=0.03, addGuide= TRUE, guideHang=0.05)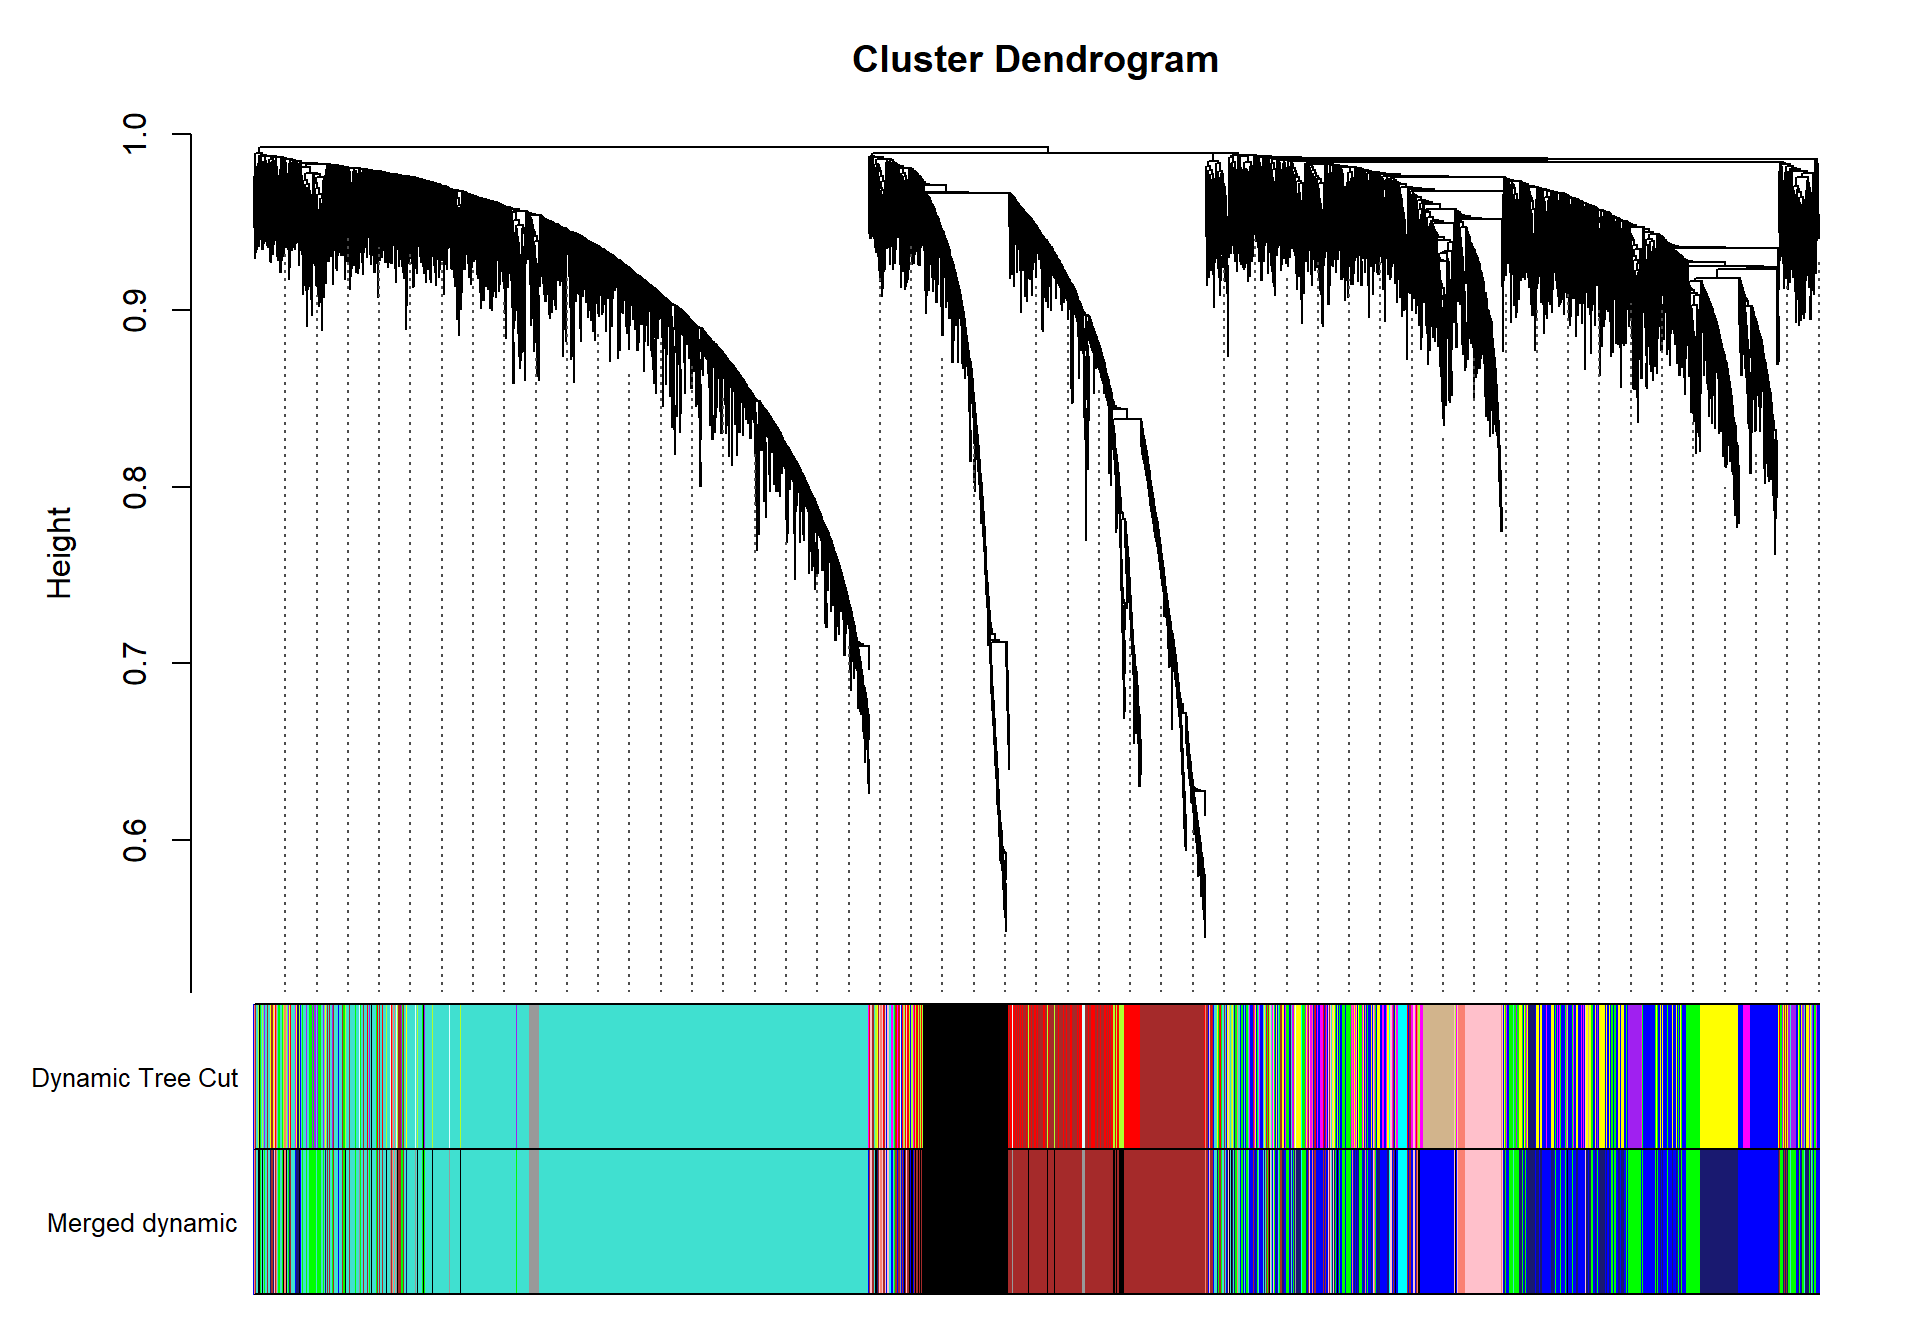
moduleColors= mergedColors
colorOrder= c("grey", standardColors(50))
moduleLabels= match(moduleColors, colorOrder)-1
MEs=mergedMEs
1.5 Module-trait correlation
datTraits<- gon_key
all.equal(rownames(datExpr0), rownames(datTraits))
datTraits$sampleID<- as.numeric(as.factor(datTraits$sampleID))
datTraits$Status2<- as.numeric(ifelse(datTraits$Status=="territorial",1,0))
datTraits<- subset(datTraits, select=c("sampleID", "Status2", "mean_T", "strength.all_study"))
names(datTraits)[names(datTraits)=="Status2"] <- "Status"
names(datTraits)[names(datTraits)=="sampleID"] <- "Individual"
#-----Define numbers of genes and samples
nGenes = ncol(datExpr0);
nSamples = nrow(datExpr0);
#-----Recalculate MEs with color labels
MEs0 = moduleEigengenes(datExpr0, moduleColors)$eigengenes
MEs = orderMEs(MEs0)
#-----Correlations of genes with eigengenes
moduleGeneCor=cor(MEs,datExpr0)
moduleGenePvalue = corPvalueStudent(moduleGeneCor, nSamples);
moduleTraitCor = cor(MEs, datTraits, use = "p");
moduleTraitPvalue = corPvalueStudent(moduleTraitCor, nSamples);
wgcnasum<- as.data.frame(moduleTraitPvalue)
wgcnasum<- data.frame(Tissue=tissue,
Individual=nrow(wgcnasum[wgcnasum$Individual<0.05,]),
Status=nrow(wgcnasum[wgcnasum$Status<0.05,]),
mean_T=nrow(wgcnasum[wgcnasum$mean_T<0.05,]), strength=nrow(wgcnasum[wgcnasum$strength.all_study<0.05,]),
status_meanT=nrow(wgcnasum[which(wgcnasum$Status<0.05 & wgcnasum$mean_T<0.05),]),
meanT_strength=nrow(wgcnasum[which(wgcnasum$mean_T<0.05 & wgcnasum$strength.all_study<0.05),]),
status_strength=nrow(wgcnasum[which(wgcnasum$Status<0.05 & wgcnasum$strength.all_study<0.05),]),
total_modules=ncol(MEs))
wgcna_summary<- list()
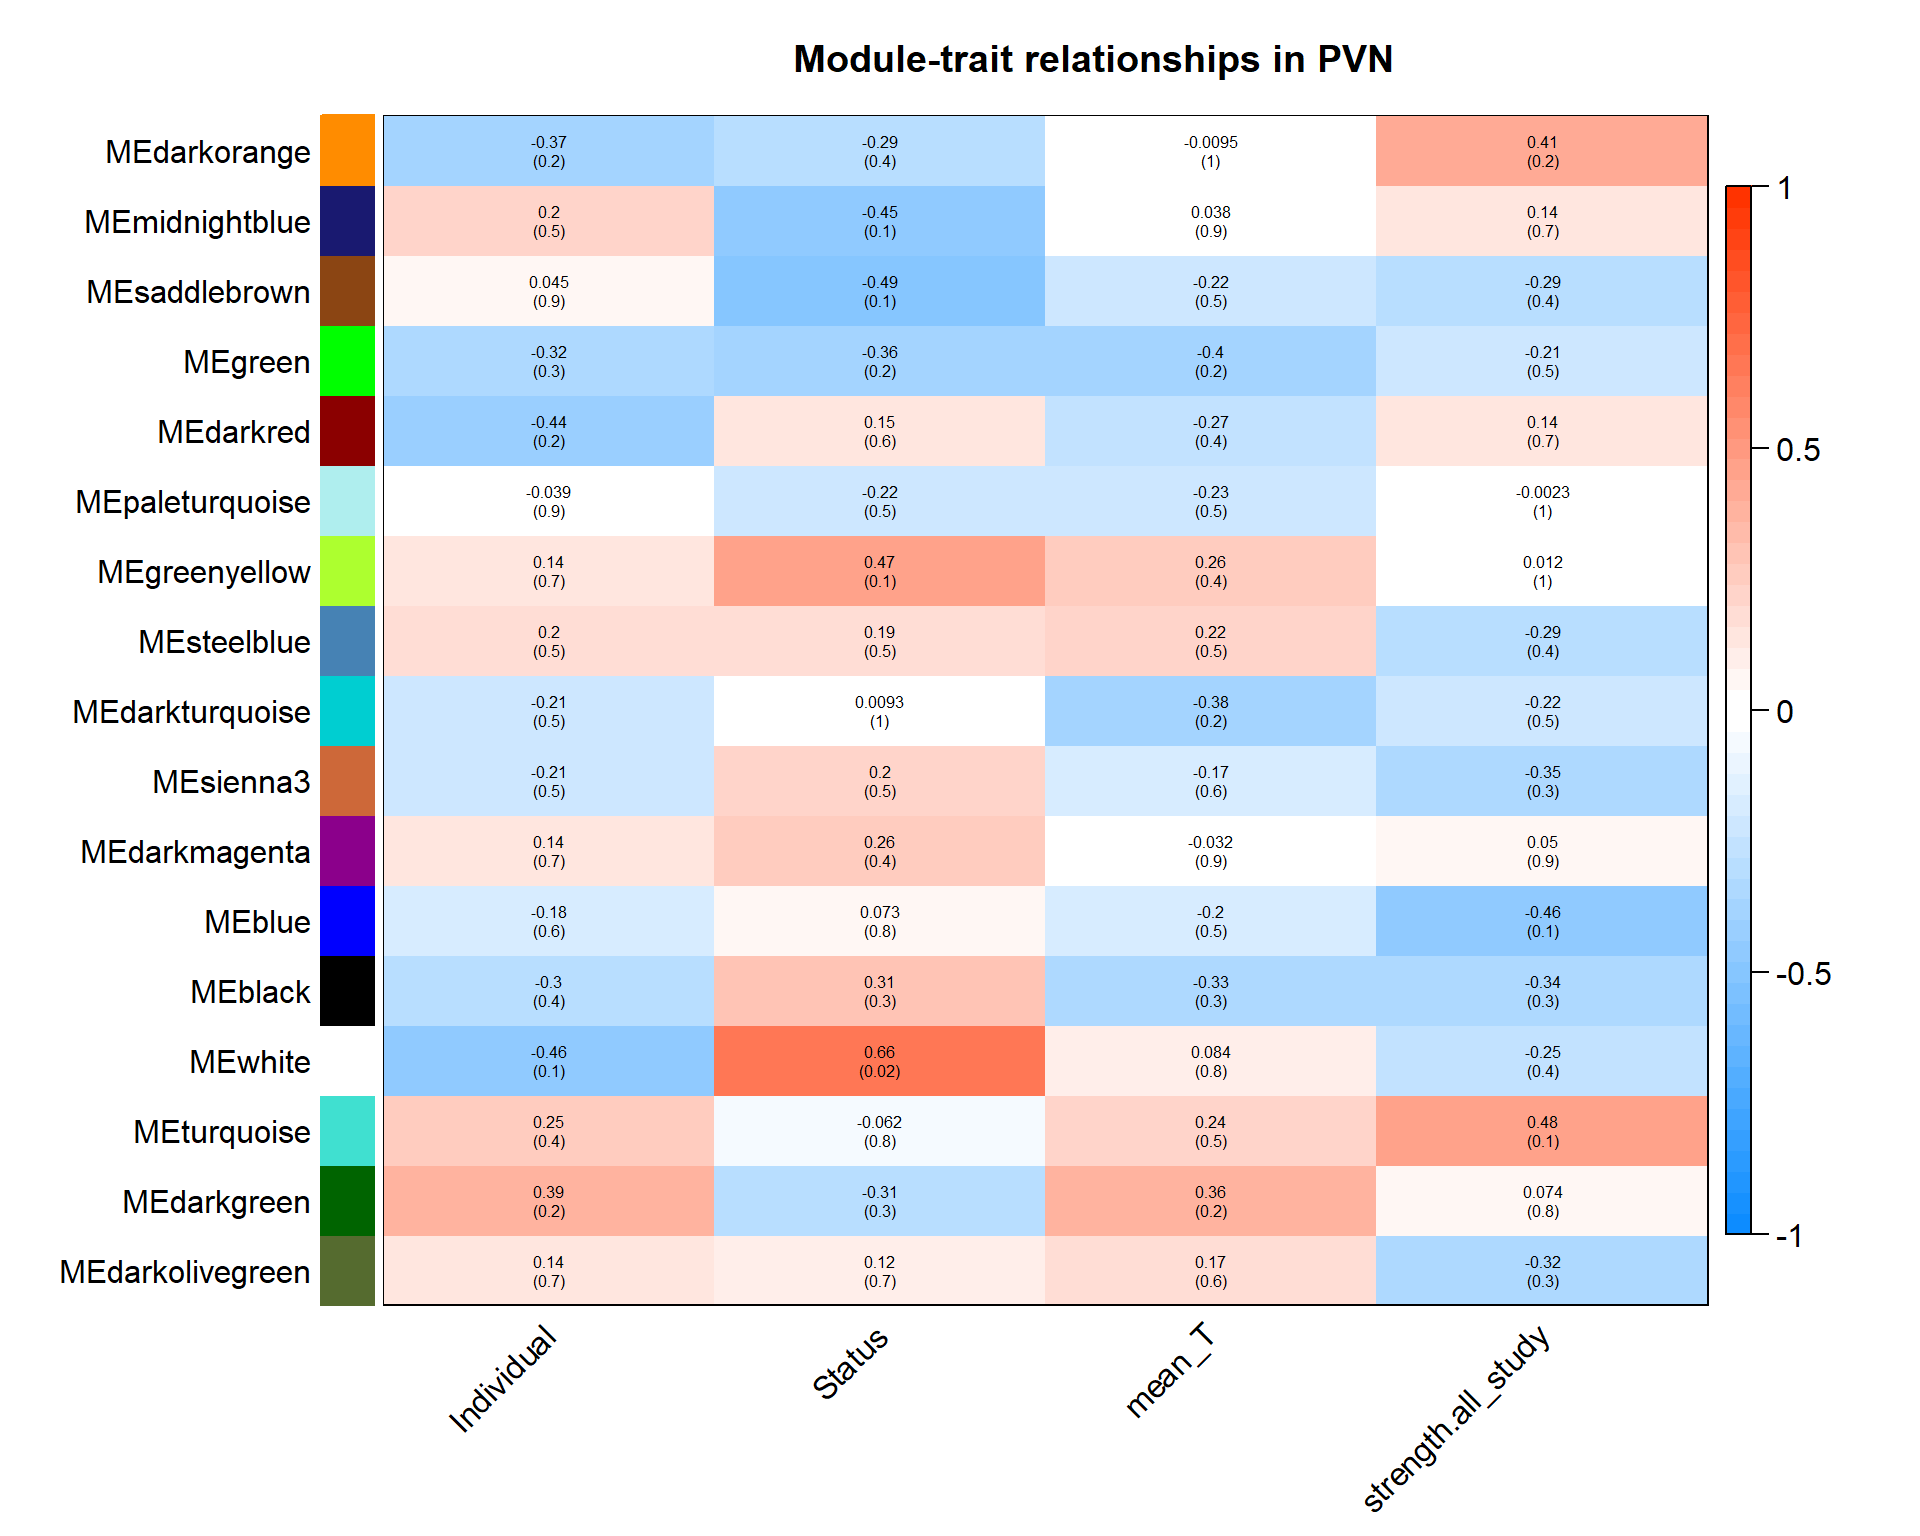
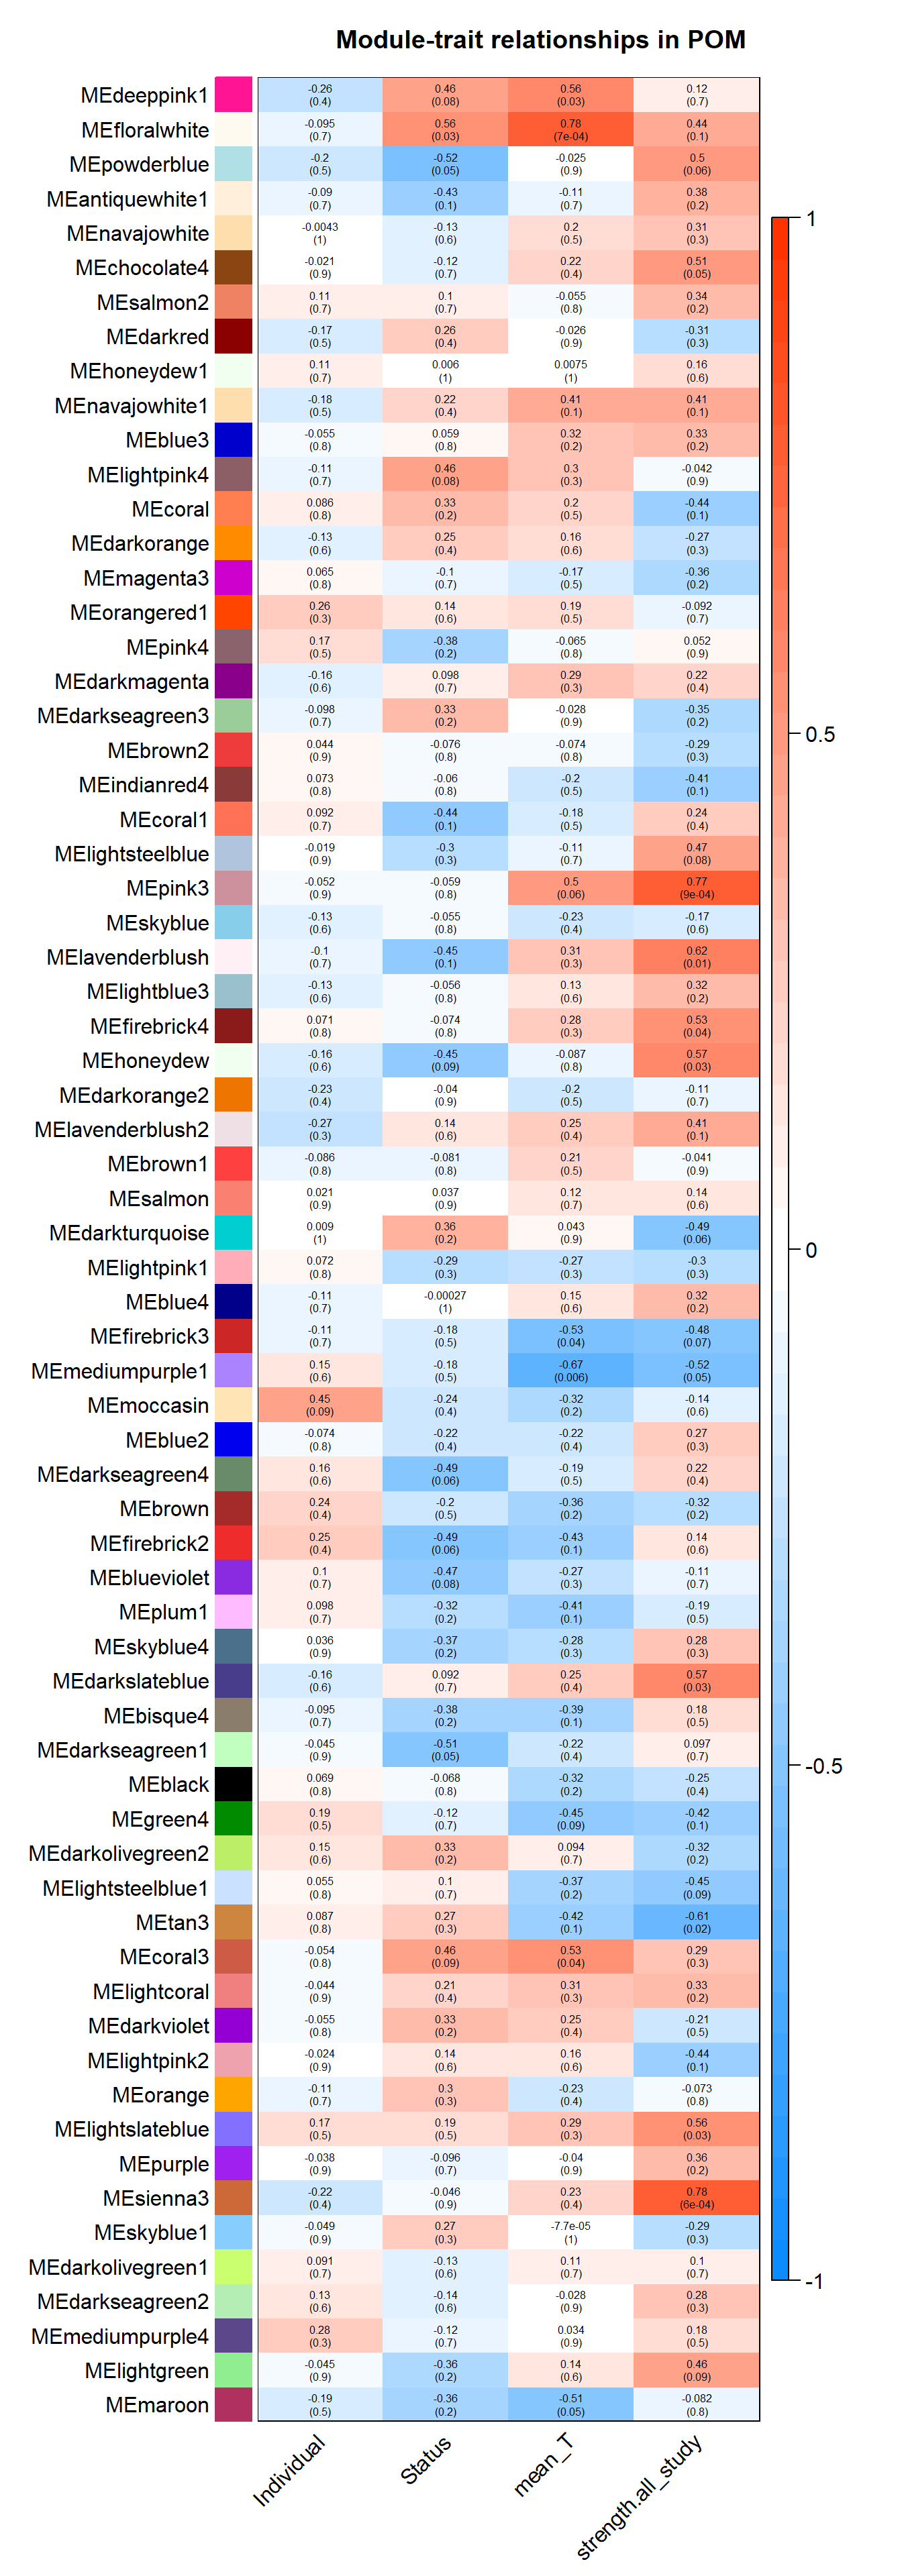
wgcna_summary[[tissue]]<- wgcnasum#---------------------Module-trait heatmap
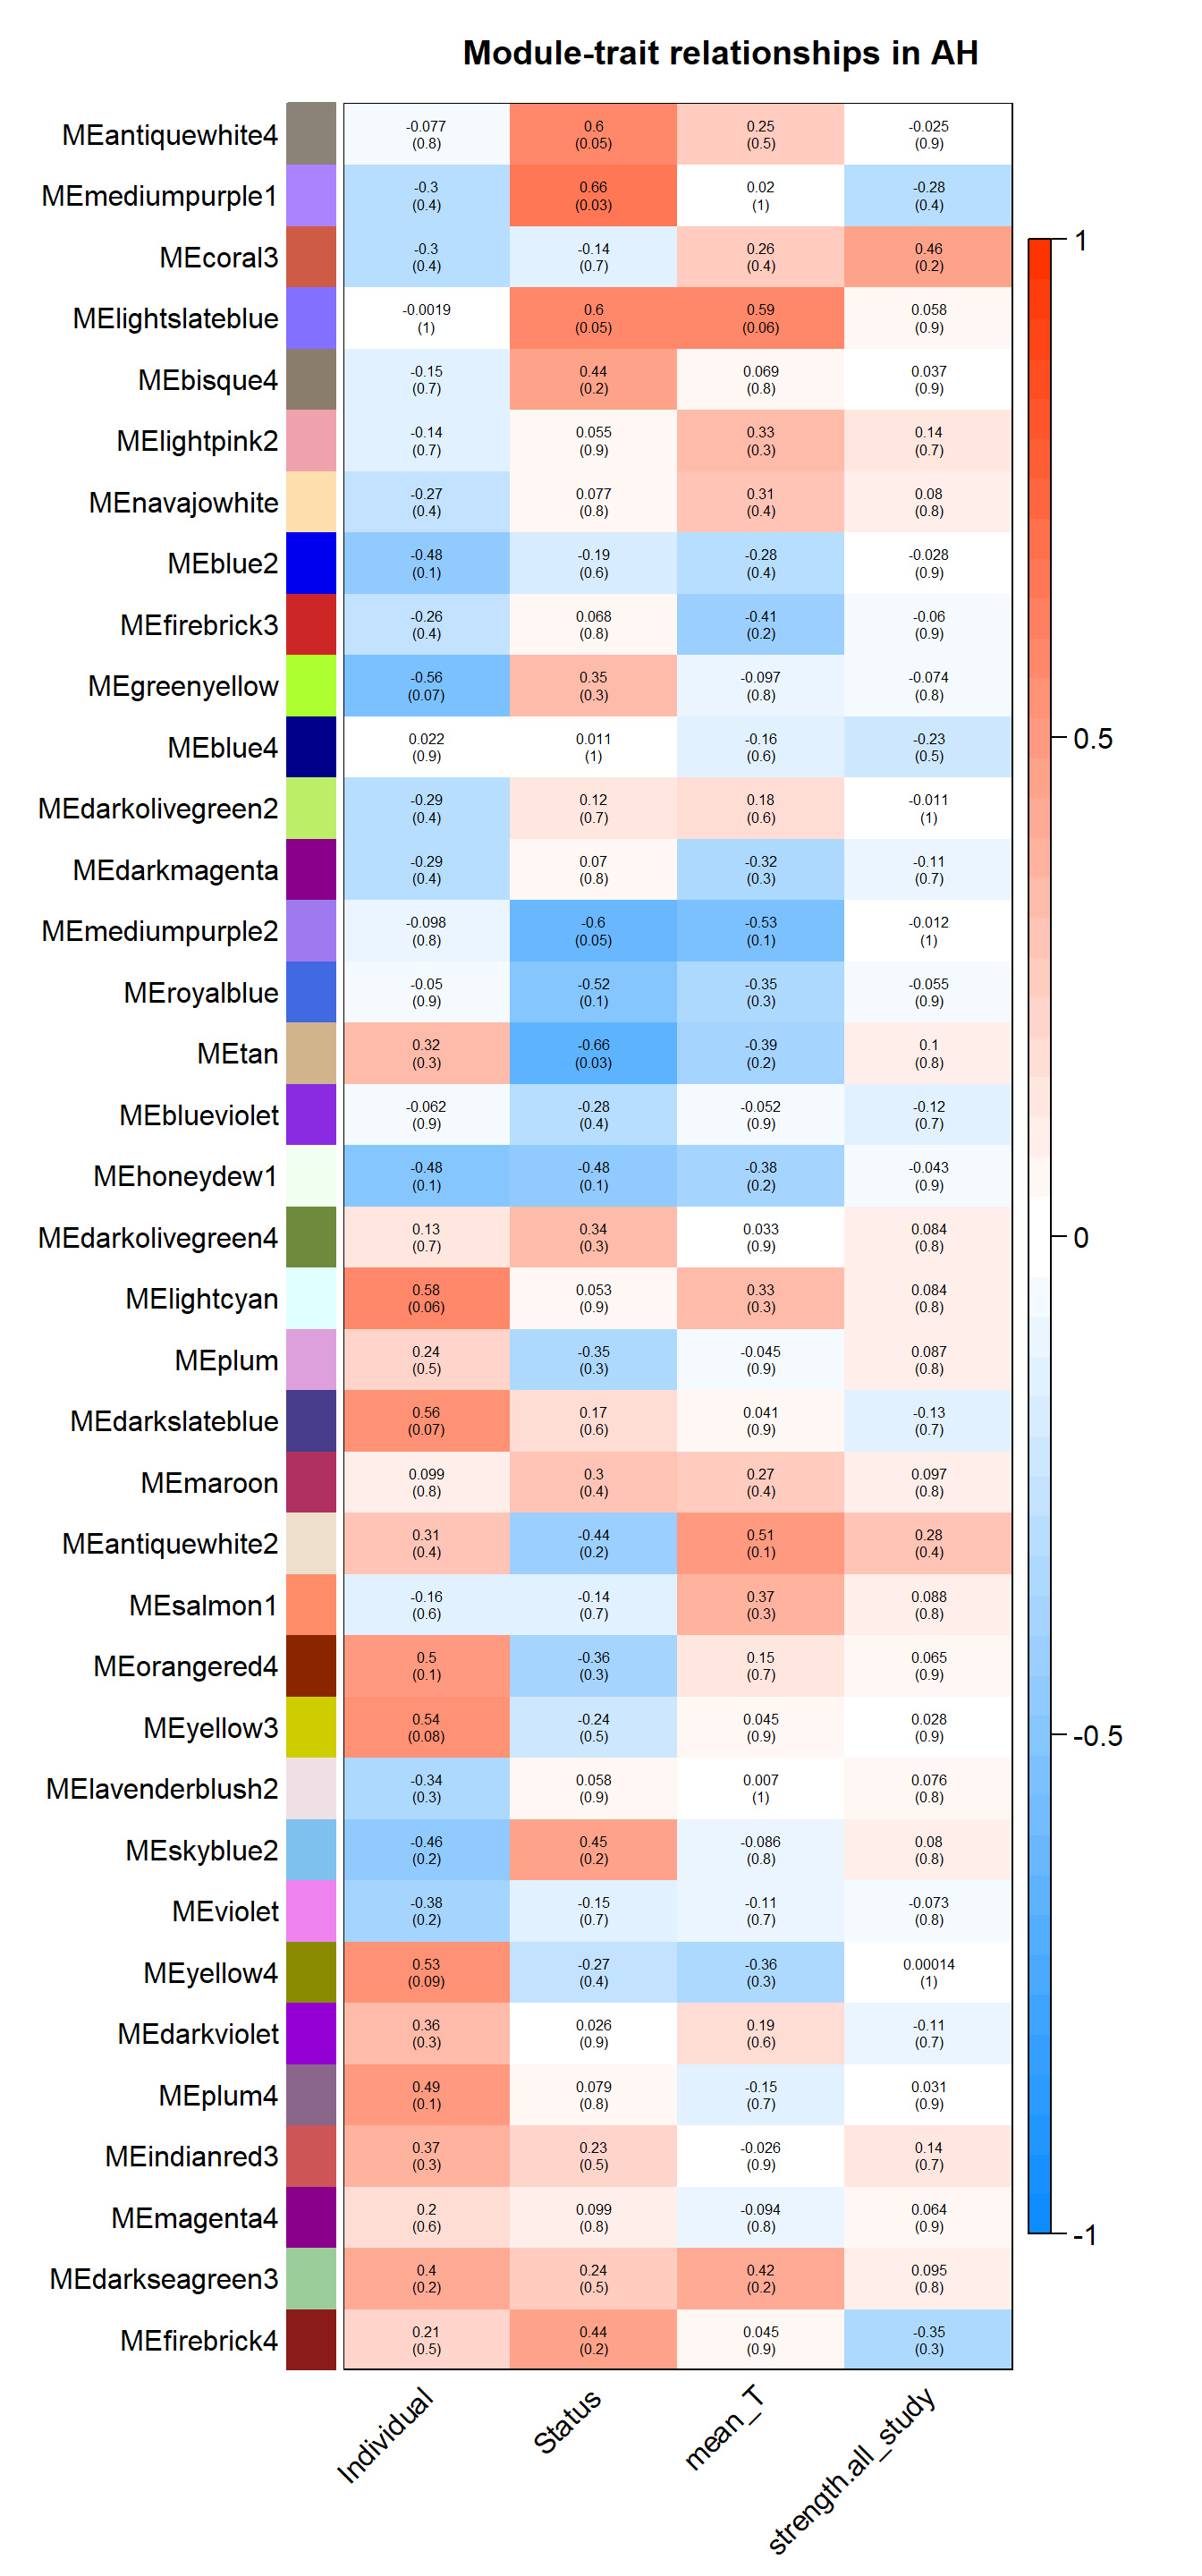
textMatrix = paste(signif(moduleTraitCor, 2), "\n(",
signif(moduleTraitPvalue, 1), ")", sep = "");
dim(textMatrix) = dim(moduleTraitCor)
par(mar = c(6, 8.5, 3, 3));
# Display the correlation values within a heatmap plot
labeledHeatmap(Matrix = moduleTraitCor,
xLabels = names(datTraits),
yLabels = names(MEs),
ySymbols = names(MEs),
colorLabels = FALSE,
colors = blueWhiteRed(50),
textMatrix = textMatrix,
setStdMargins = FALSE,
cex.text = 0.5,
zlim = c(-1,1),
main = paste("Module-trait relationships in", tissue))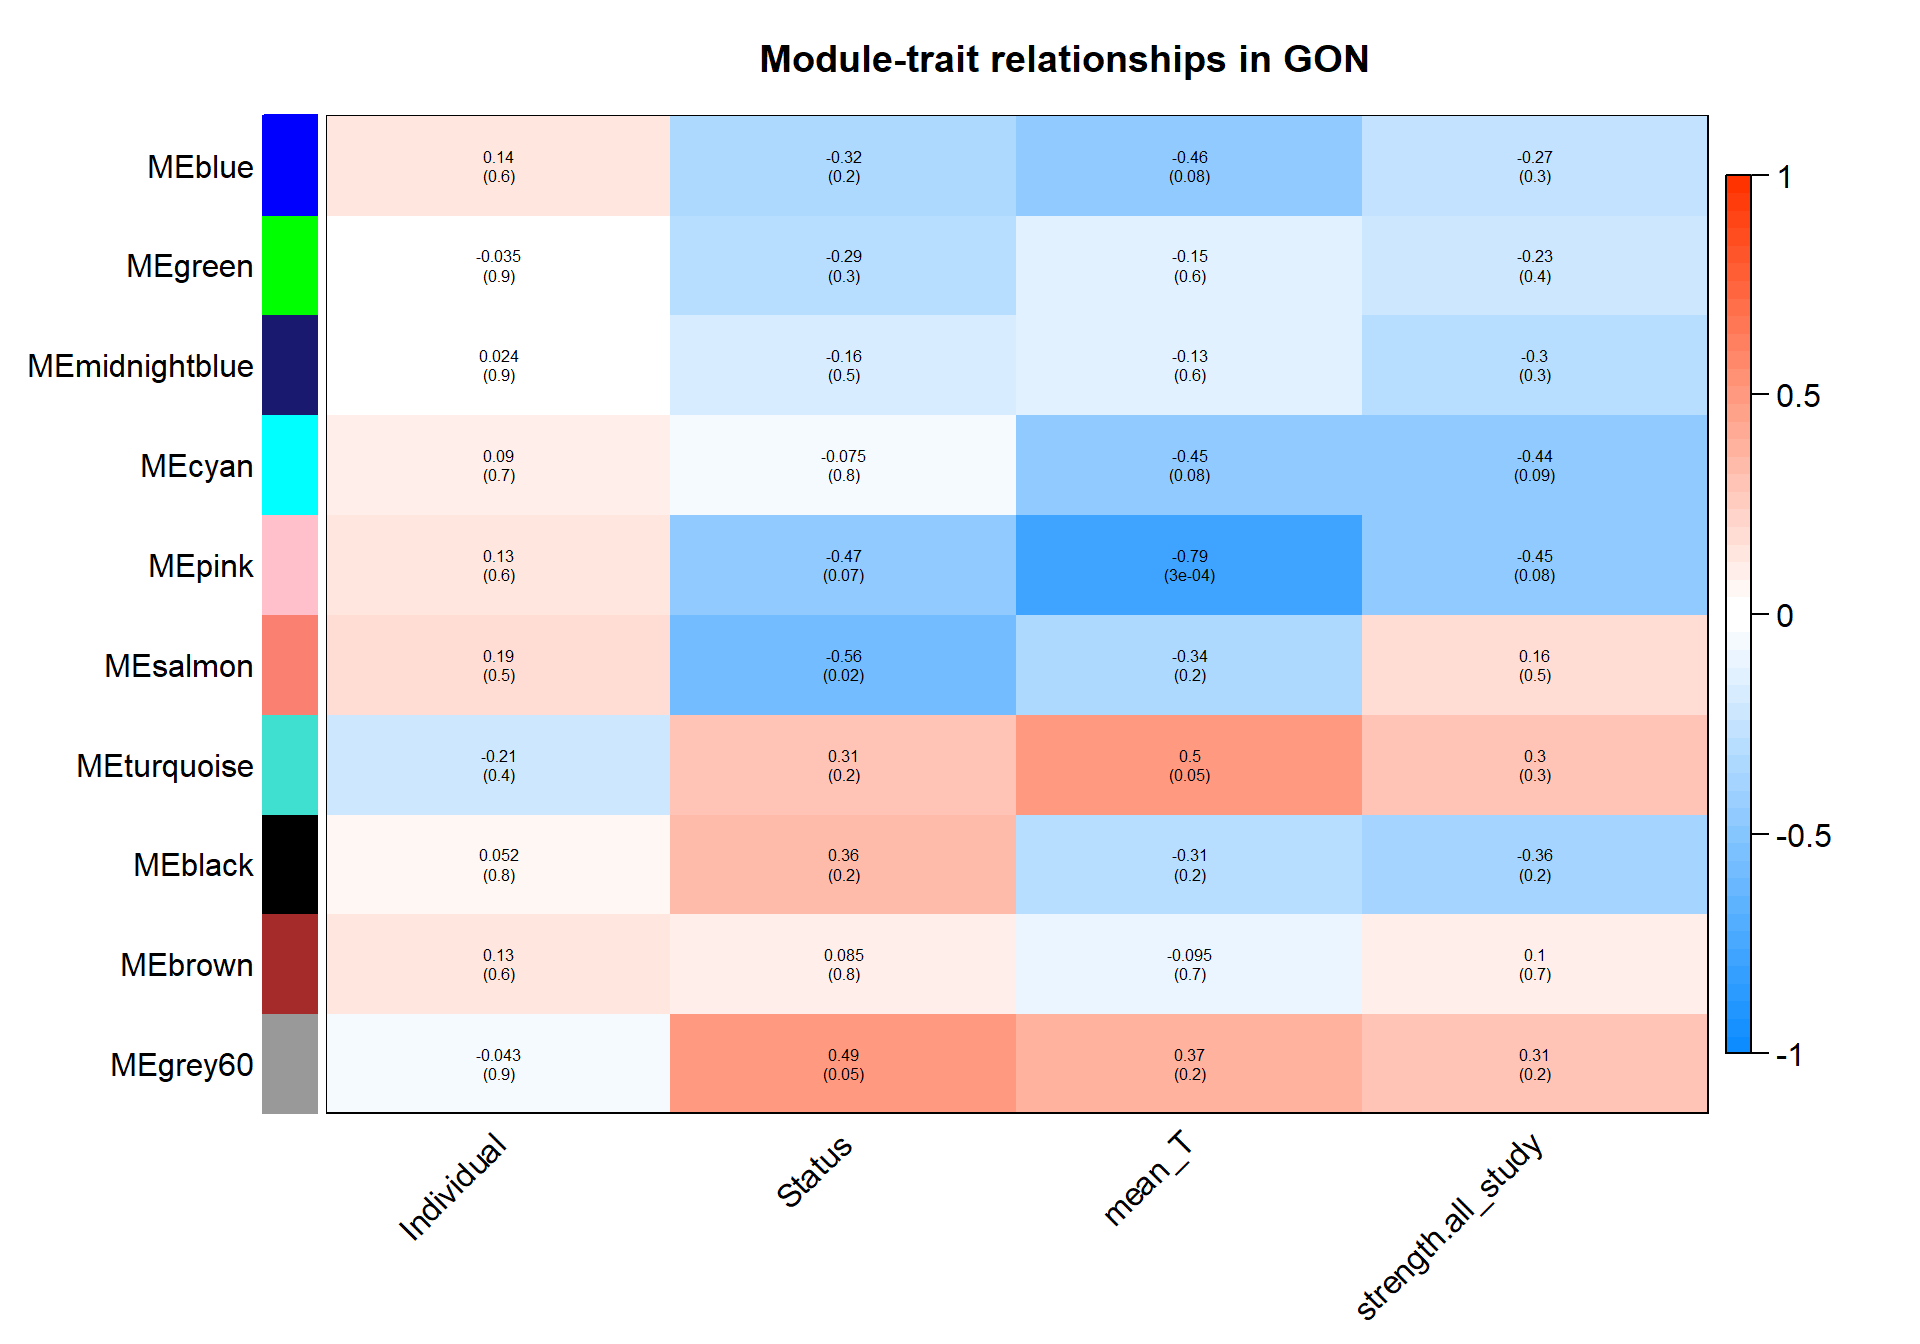
| moduleColors | Freq |
|---|---|
| black | 1361 |
| blue | 2584 |
| brown | 2686 |
| cyan | 140 |
| green | 1431 |
| grey60 | 215 |
| midnightblue | 1393 |
| pink | 590 |
| salmon | 243 |
| turquoise | 5526 |
1.6 Module Membership and Gene Significance
#### module membership
datME<- moduleEigengenes(datExpr0,mergedColors)$eigengenes
datKME<- signedKME(datExpr0, datME, outputColumnName="MM.") #use the "signed eigennode connectivity" or module membership
MMPvalue <- as.data.frame(corPvalueStudent(as.matrix(datKME), nSamples)) # Calculate module membership P-values
datKME$gene<- rownames(datKME)
MMPvalue$gene<- rownames(MMPvalue)
genes=names(datExpr0)
geneInfo0 <- data.frame(gene=genes,moduleColor=moduleColors)
geneInfo0 <- merge(geneInfo0, genes_key, by="gene", all.x=TRUE)
color<- merge(geneInfo0, datKME, by="gene") #these are from your original WGCNA analysis
#head(color)
write.csv(as.data.frame(color), file = paste("../WGCNA_results/within_tissues/",tissue,"results_ModuleMembership.csv", sep=""), row.names = FALSE)
MMPvalue<- merge(geneInfo0, MMPvalue, by="gene")
write.csv(MMPvalue, file=paste("../WGCNA_results/within_tissues/",tissue,"_results_ModuleMembership_P-value.csv", sep=""), row.names = FALSE)
#### gene-significance
trait = as.data.frame(datTraits$Status) #change here for traits of interest
names(trait) = "status" #change here for traits of interest
modNames = substring(names(MEs), 3)
geneTraitSignificance = as.data.frame(cor(datExpr0, trait, use = "p"))
GSPvalue = as.data.frame(corPvalueStudent(as.matrix(geneTraitSignificance), nSamples))
names(geneTraitSignificance) = paste("GS.", names(trait), sep="")
names(GSPvalue) = paste("p.GS.", names(trait), sep="")
GS<- cbind(geneTraitSignificance,GSPvalue)
trait = as.data.frame(datTraits$mean_T)
names(trait)= "mean_T"
geneTraitSignificance = as.data.frame(cor(datExpr0, trait, use = "p"))
GSPvalue = as.data.frame(corPvalueStudent(as.matrix(geneTraitSignificance), nSamples))
names(geneTraitSignificance) = paste("GS.", names(trait), sep="")
names(GSPvalue) = paste("p.GS.", names(trait), sep="")
GS2<- cbind(geneTraitSignificance,GSPvalue)
trait = as.data.frame(datTraits$strength.all_study)
names(trait)= "strength"
geneTraitSignificance = as.data.frame(cor(datExpr0, trait, use = "p"))
GSPvalue = as.data.frame(corPvalueStudent(as.matrix(geneTraitSignificance), nSamples))
names(geneTraitSignificance) = paste("GS.", names(trait), sep="")
names(GSPvalue) = paste("p.GS.", names(trait), sep="")
GS3<- cbind(geneTraitSignificance,GSPvalue)
GS$gene<- rownames(GS)
GS<- cbind(GS,GS2, GS3)
GS<- merge(geneInfo0,GS, by="gene")
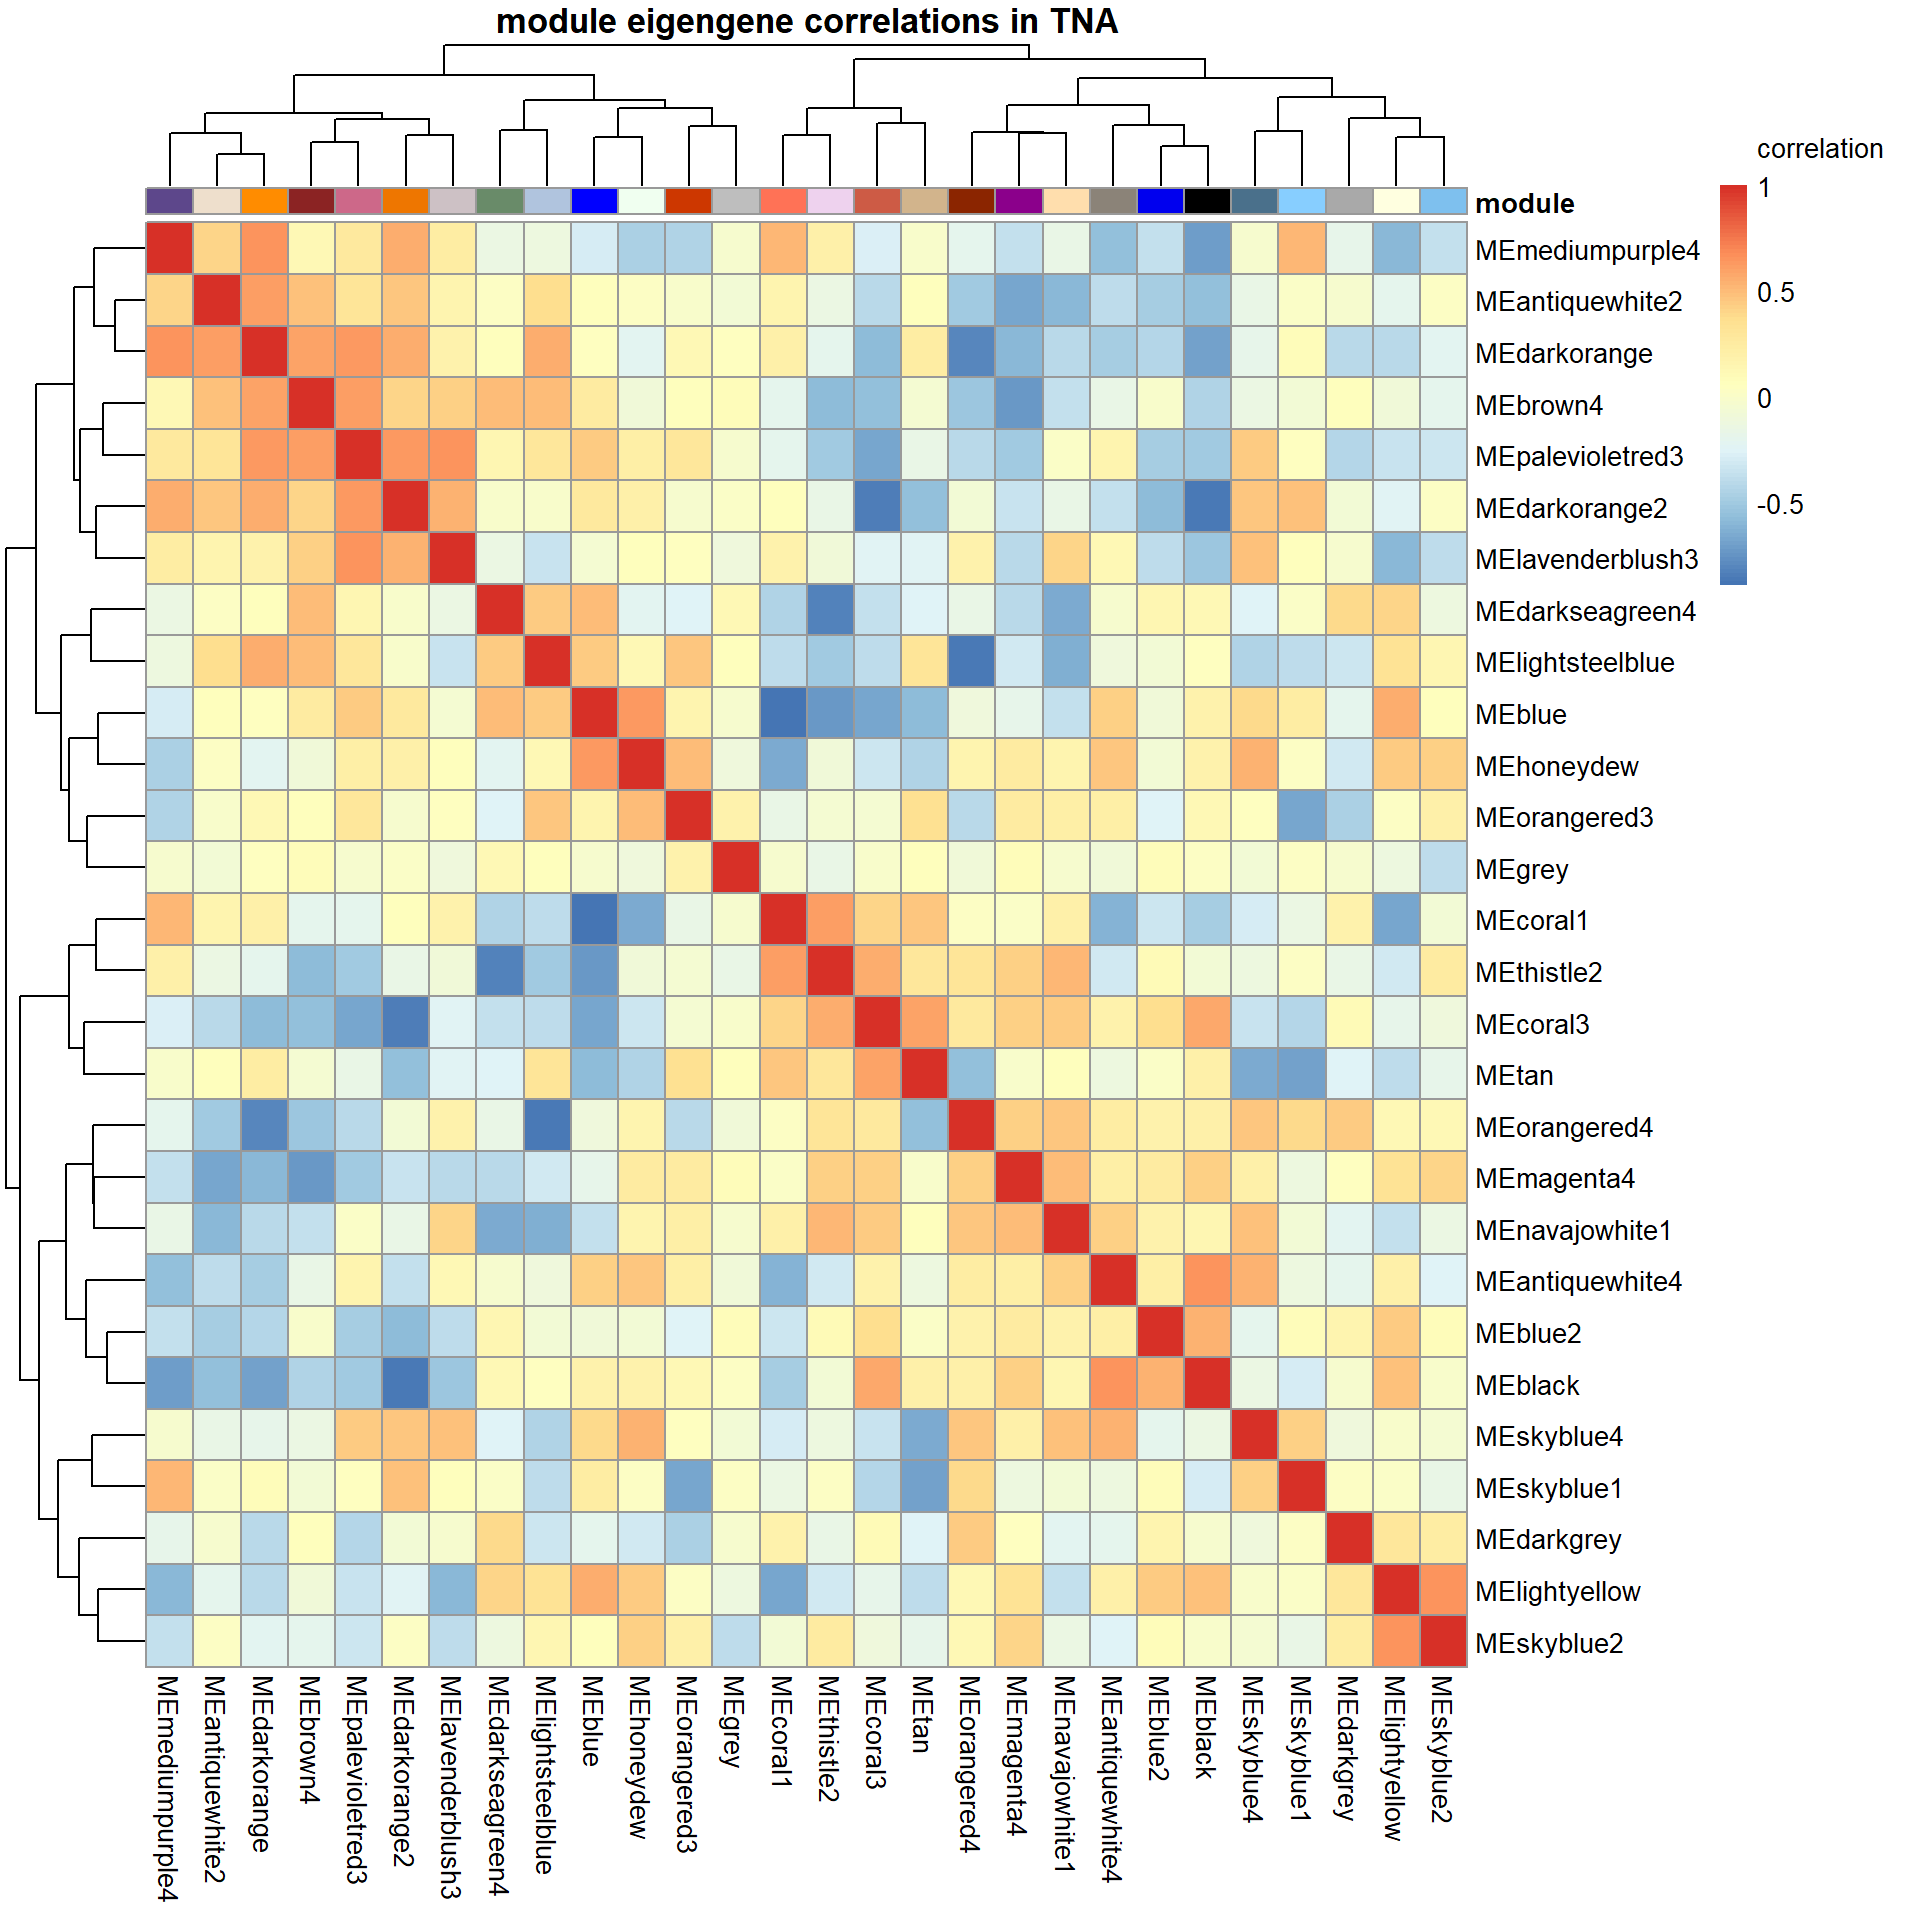
write.csv(GS, file=paste("../WGCNA_results/within_tissues/",tissue, "_results_GeneSignificance.csv", sep=""), row.names = FALSE)1.7 Intermodule correlations
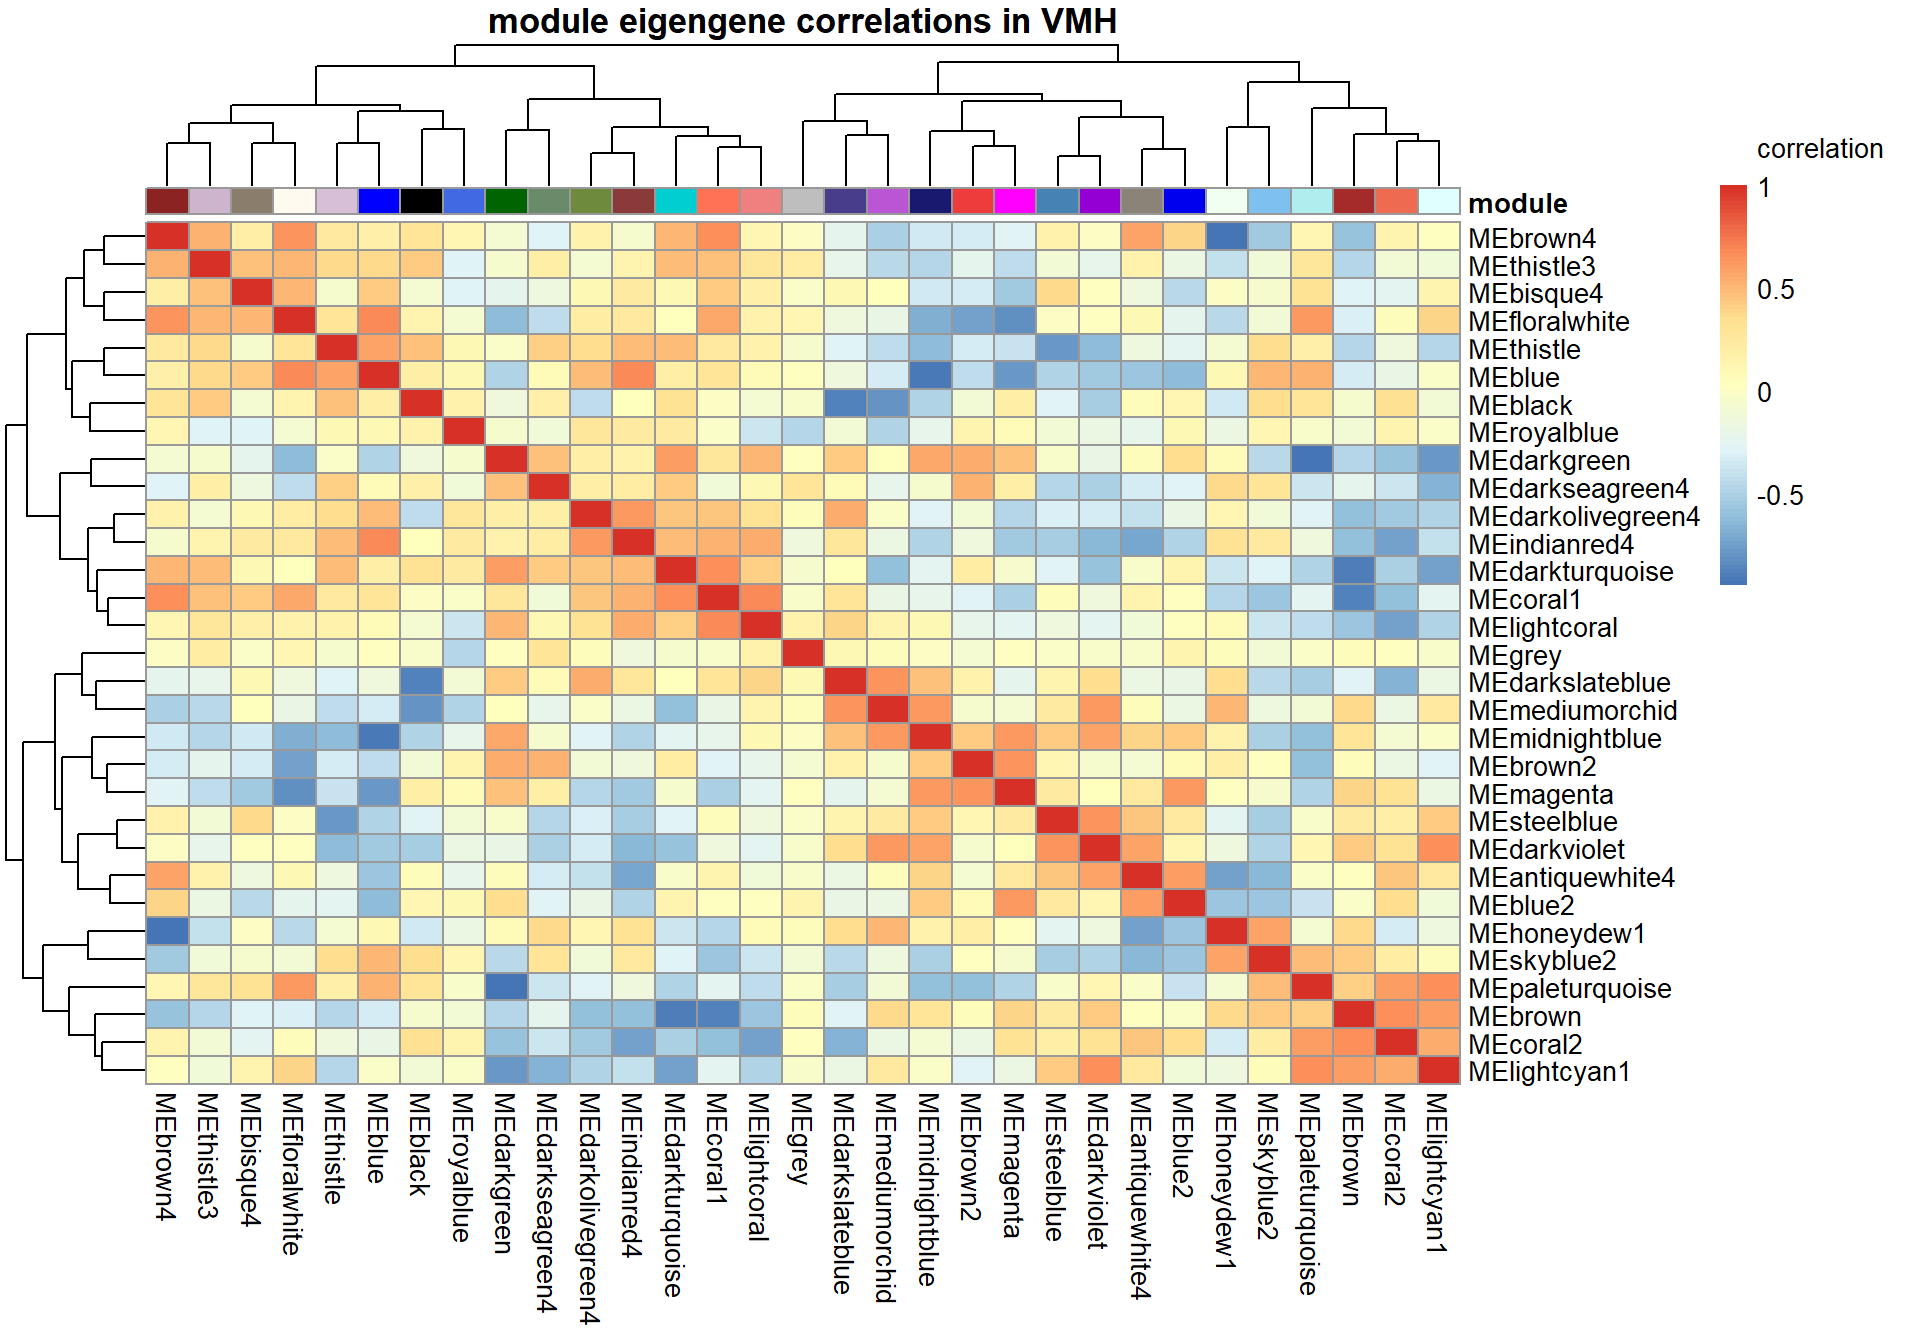
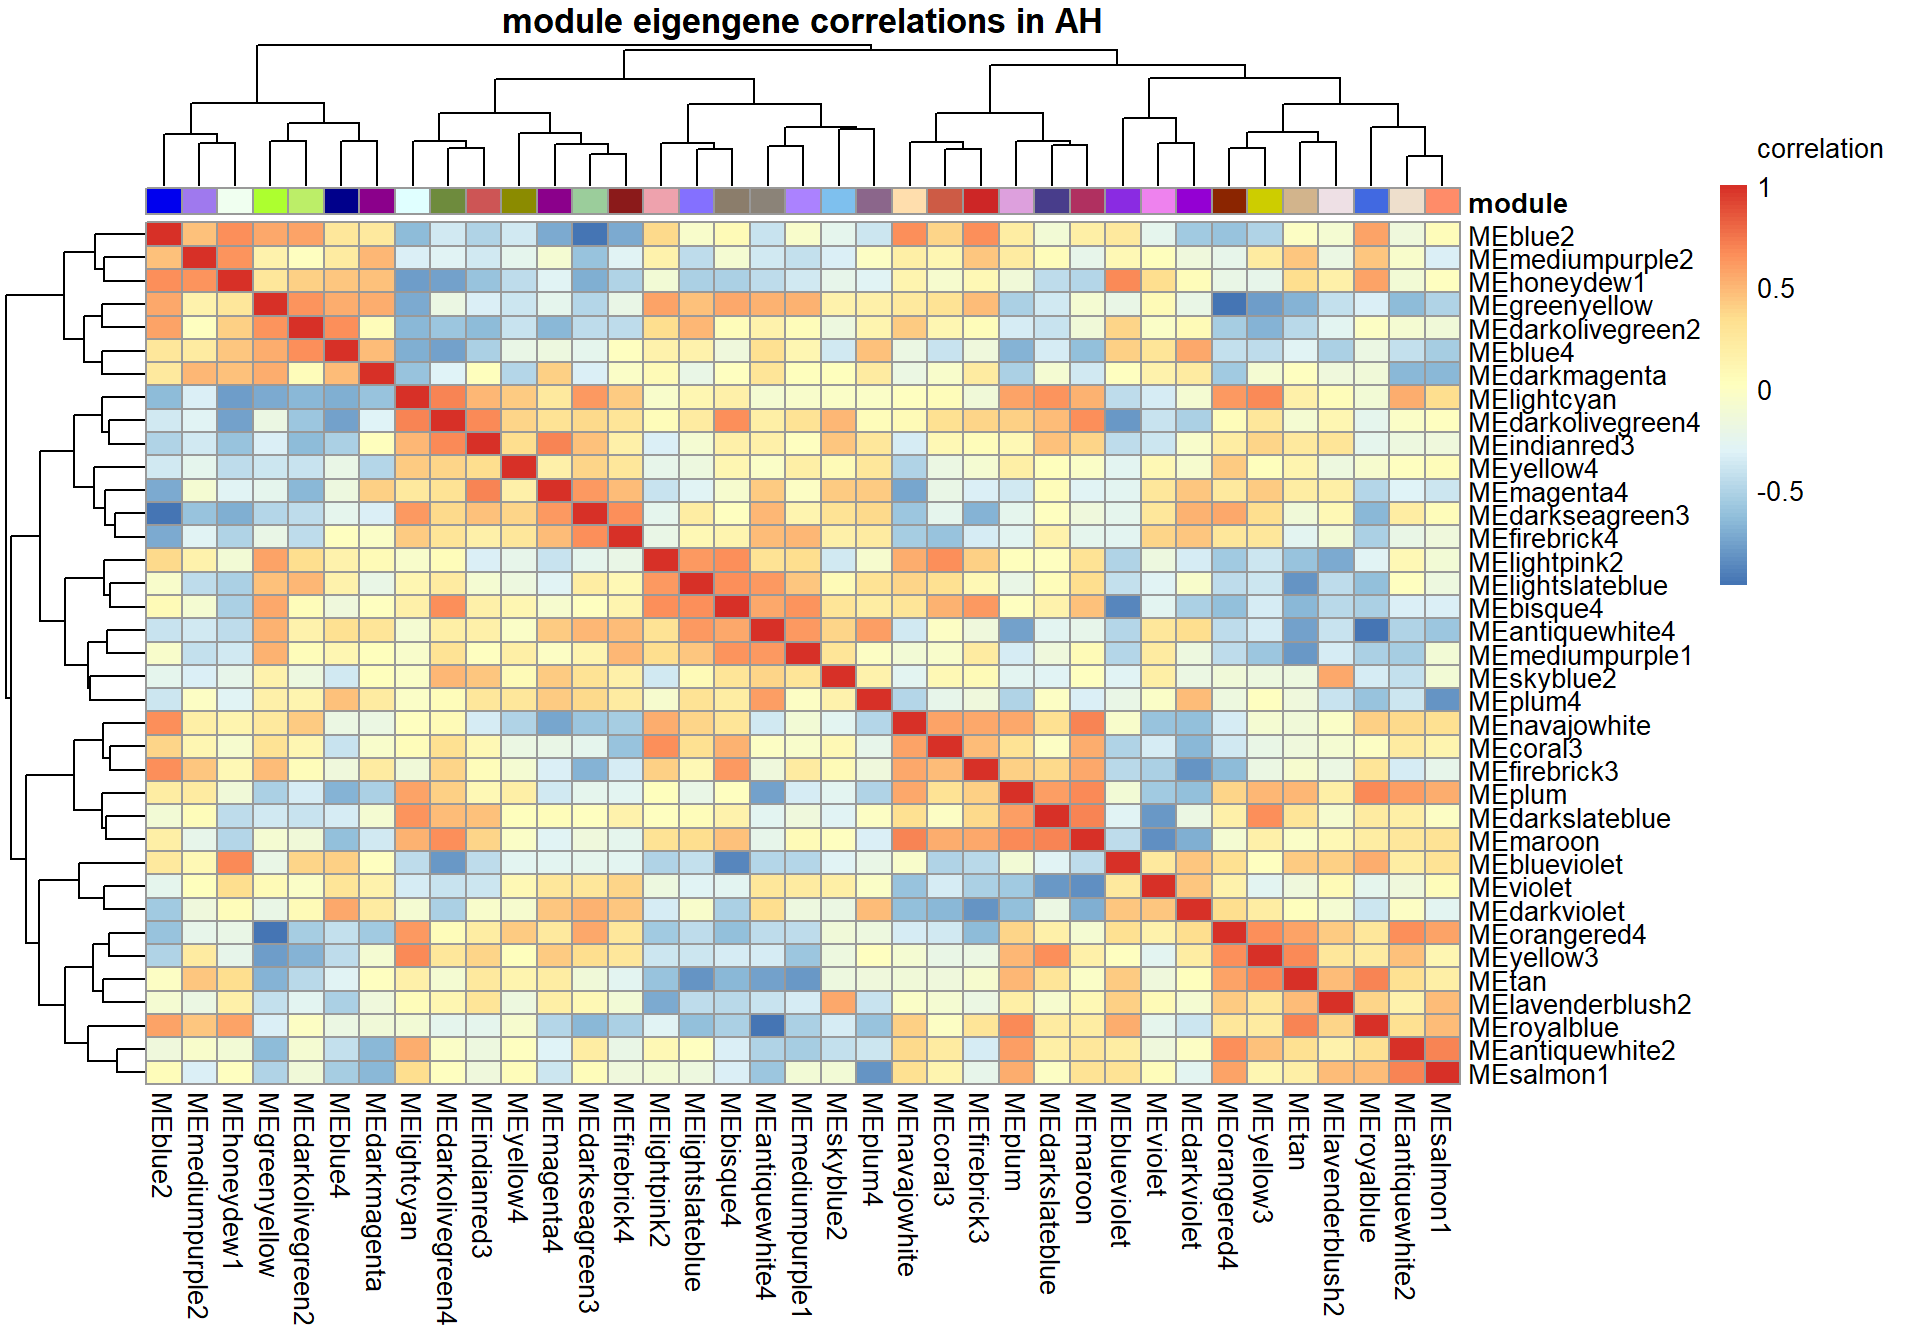
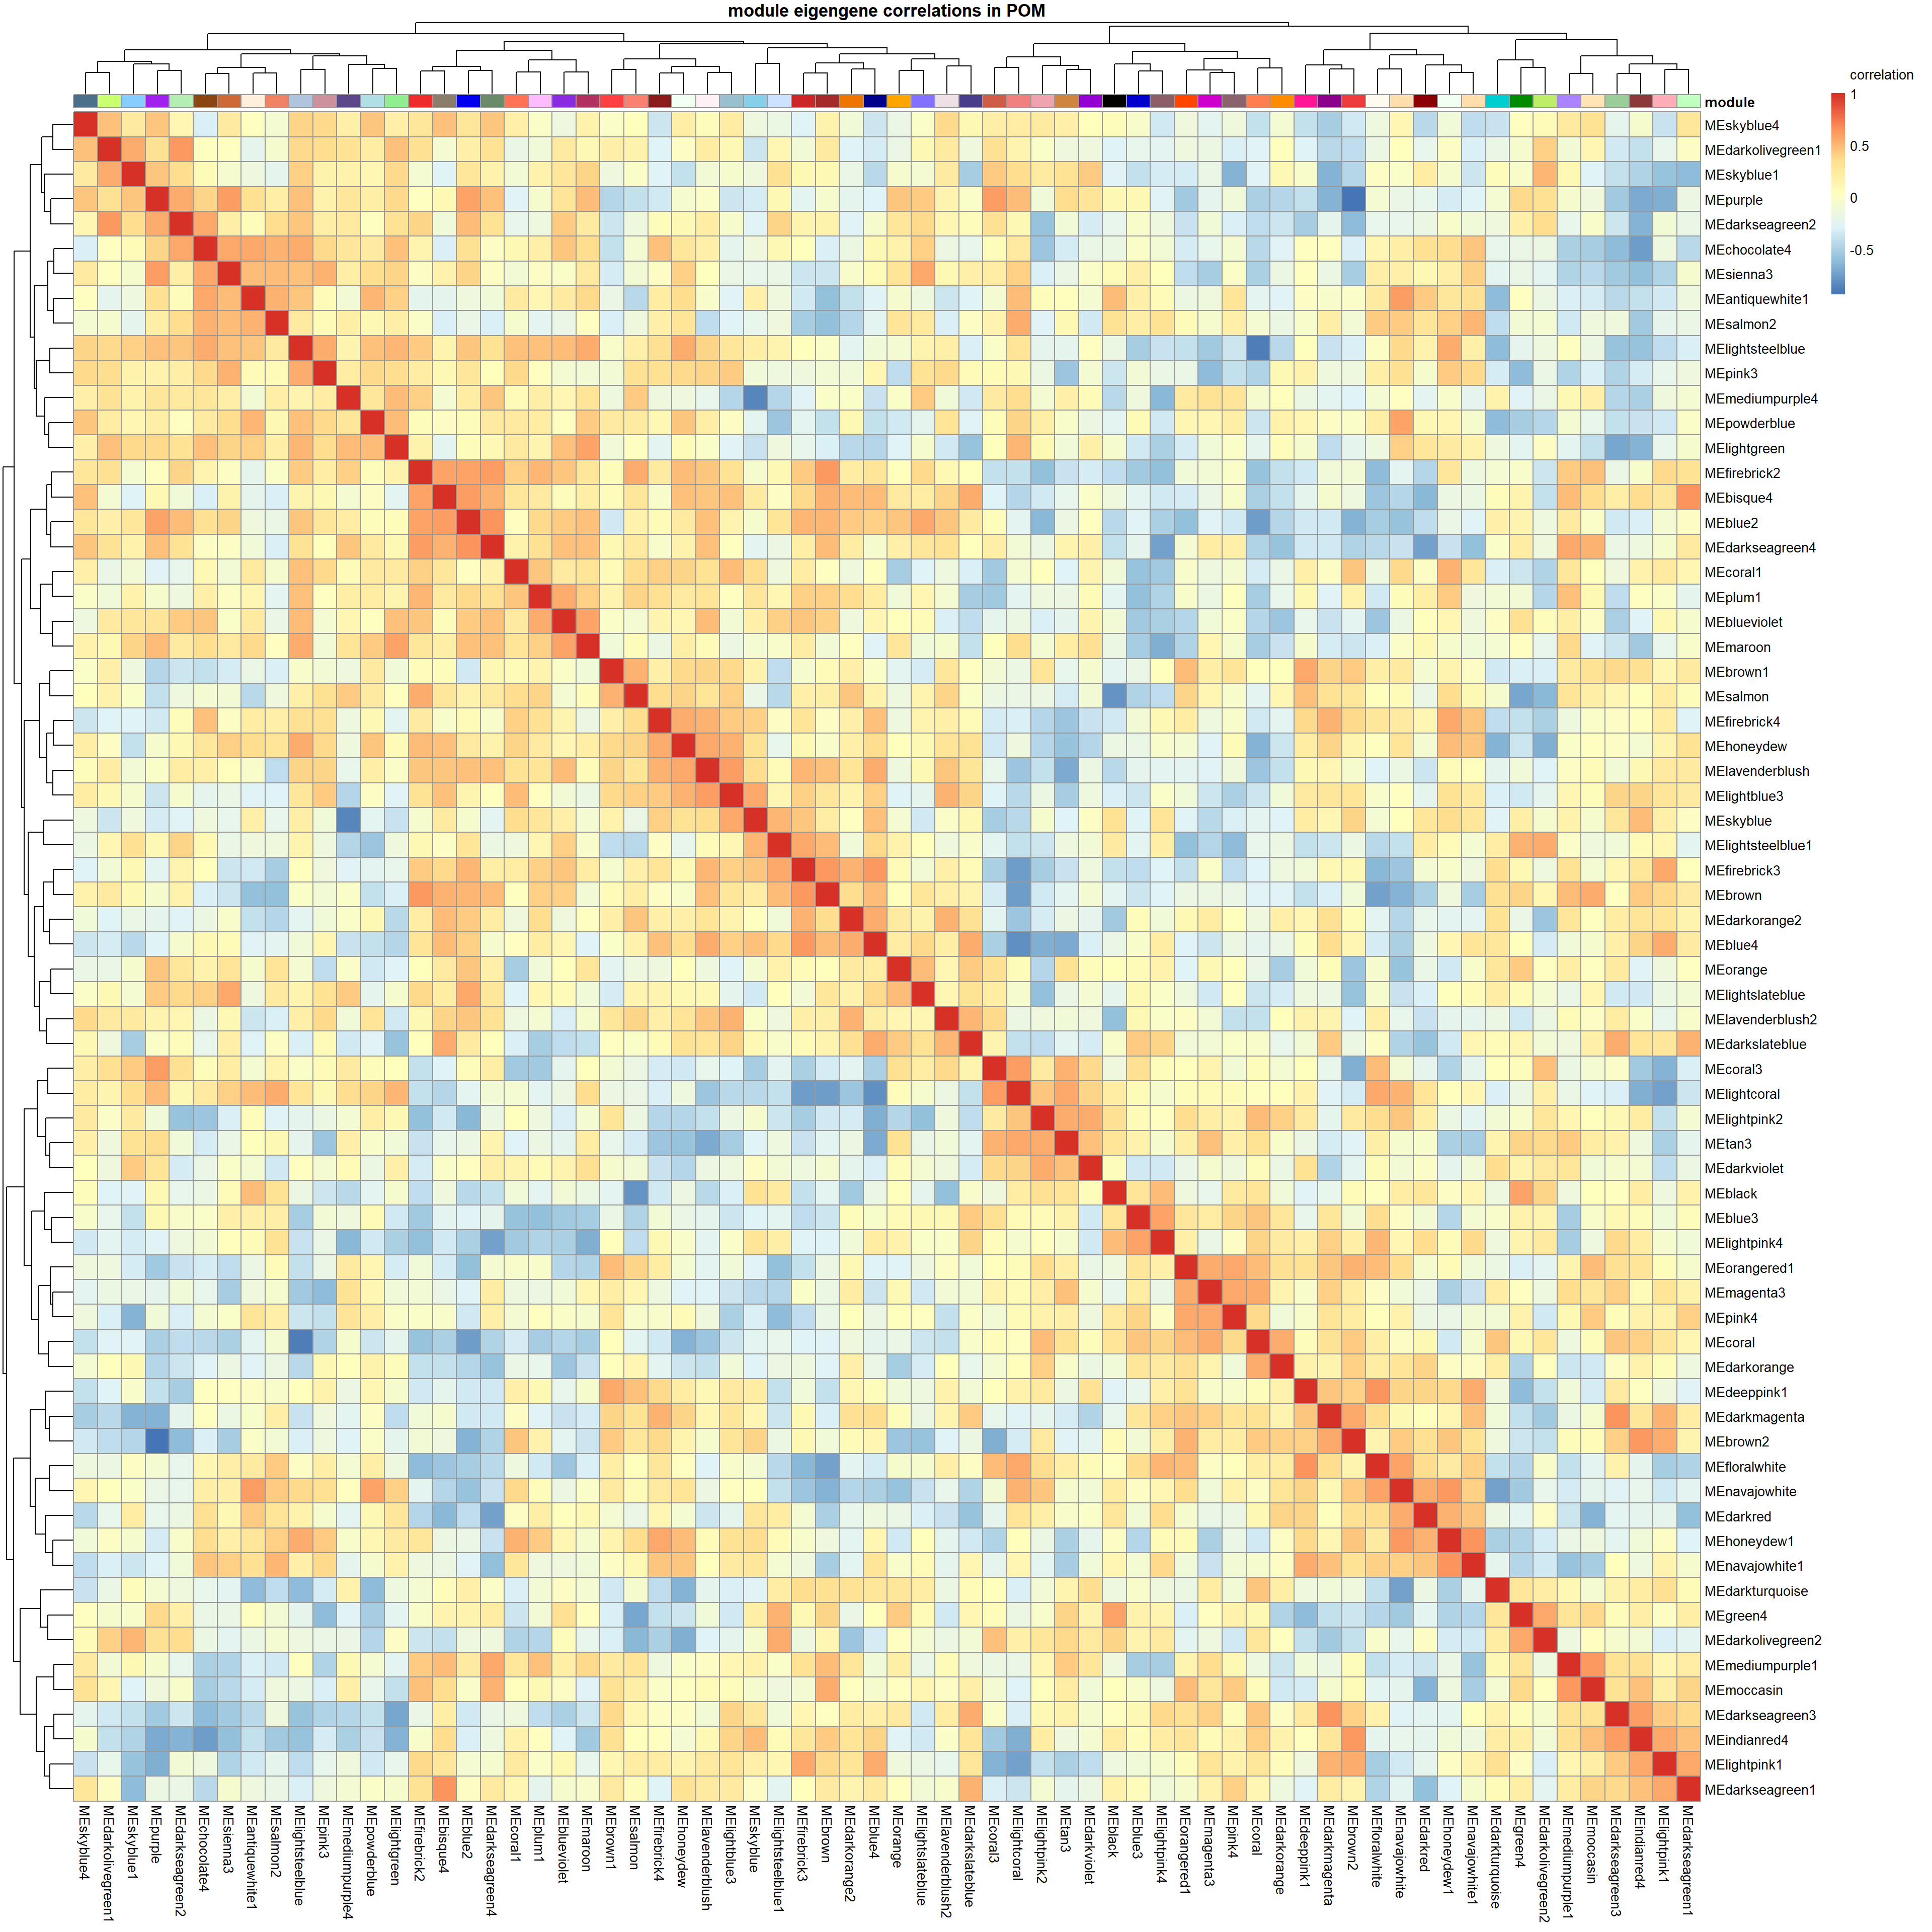
# Specify colors
colz<- gsub("ME","",colnames(MEs))
names(colz)<- colnames(MEs)
ann_colors = list(module=colz)
annotation_col<- data.frame(row.names=colnames(MEs), module=colnames(MEs))
correlation<- cor(MEs)
pheatmap(correlation, annotation_col = annotation_col, annotation_colors = ann_colors, annotation_legend=FALSE, legend_breaks = c(-1,-0.5,0,0.5, 1,1),
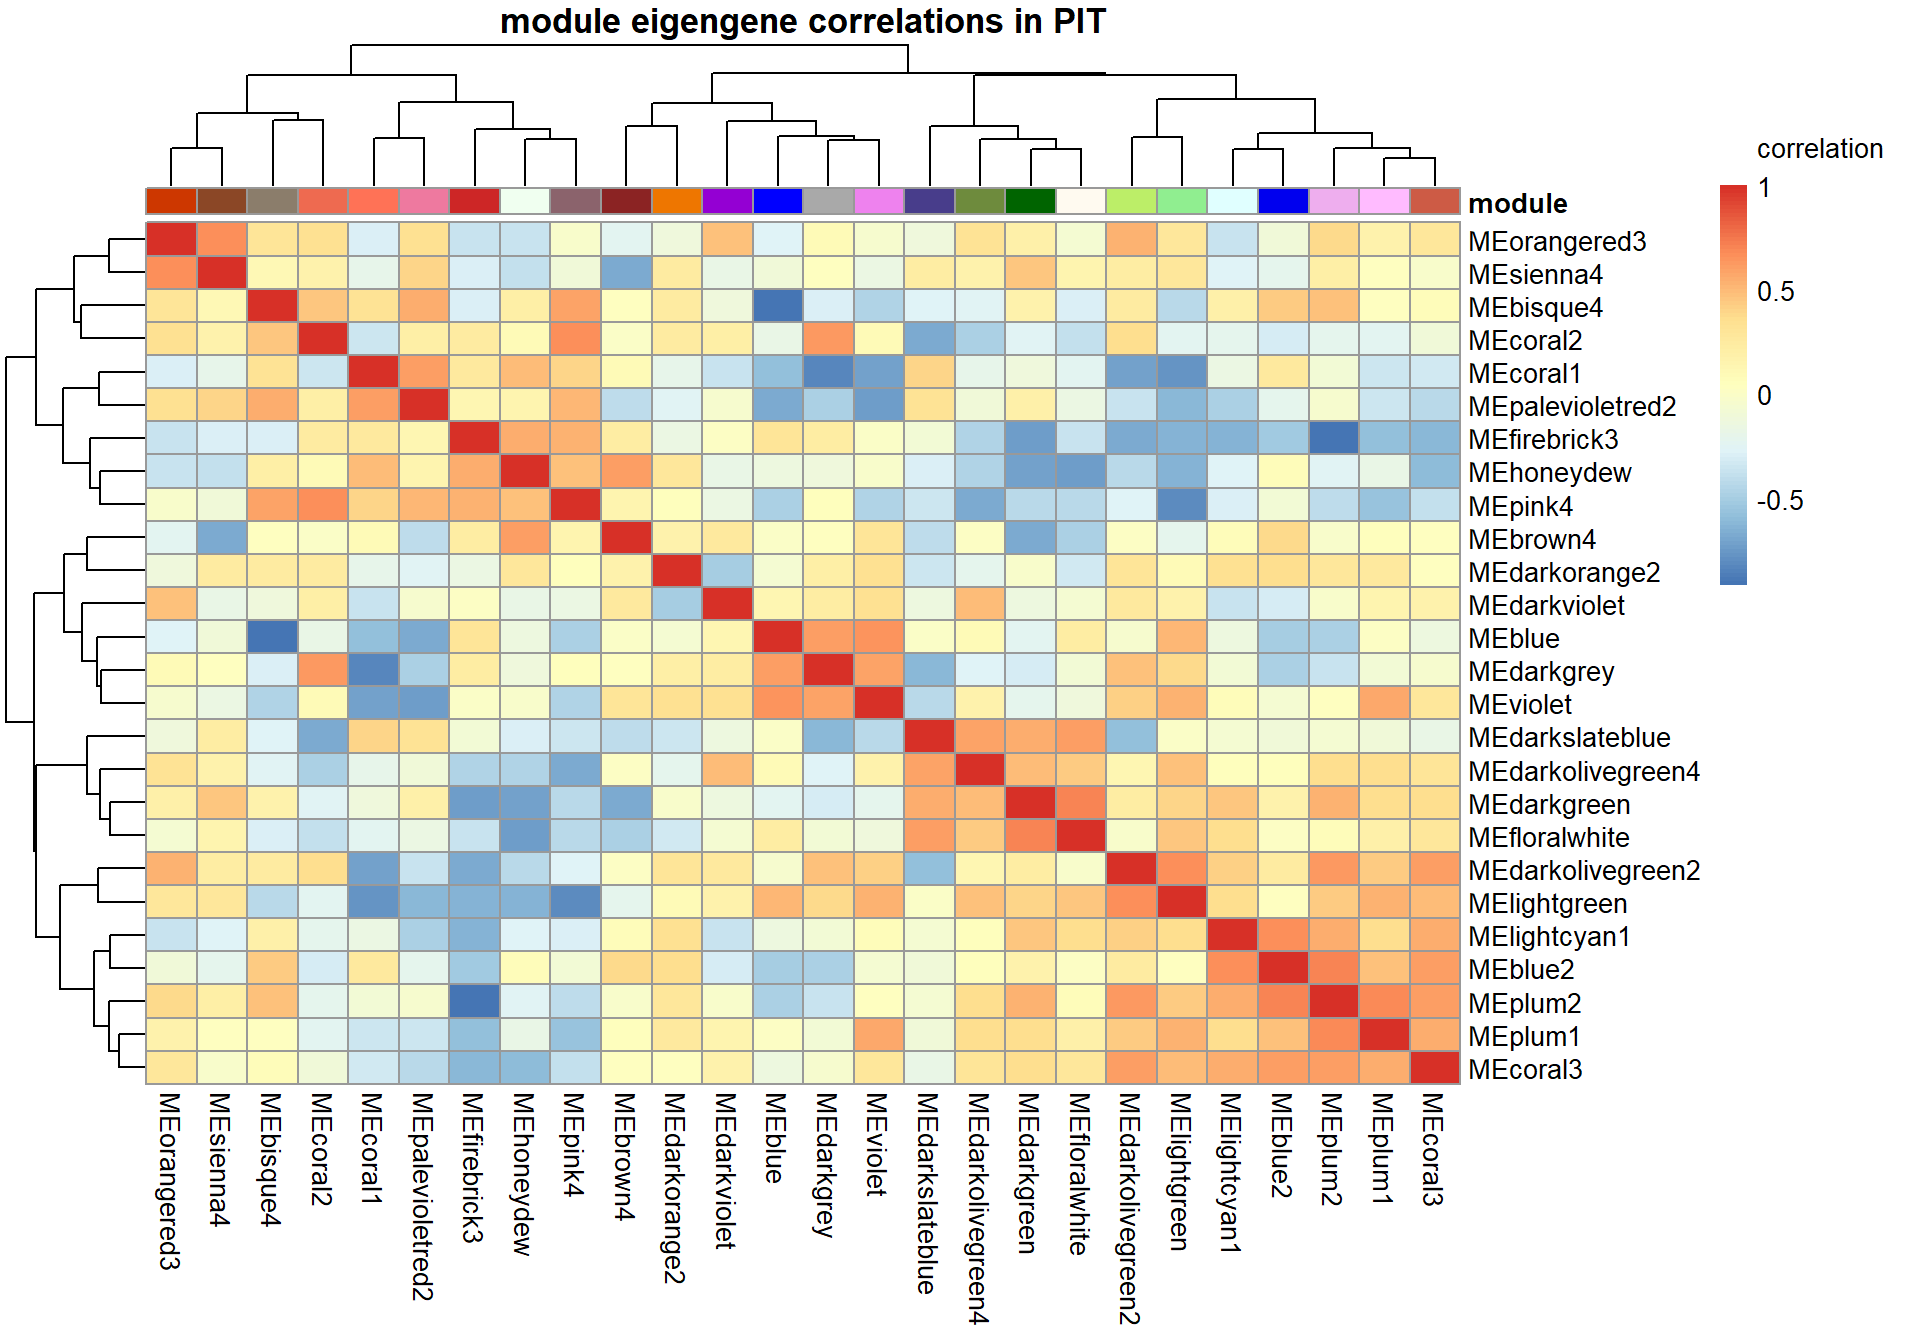
main=paste("module eigengene correlations in", tissue, sep=" "), legend_labels = c("-1", "-0.5", "0", "0.5","1","correlation\n\n"))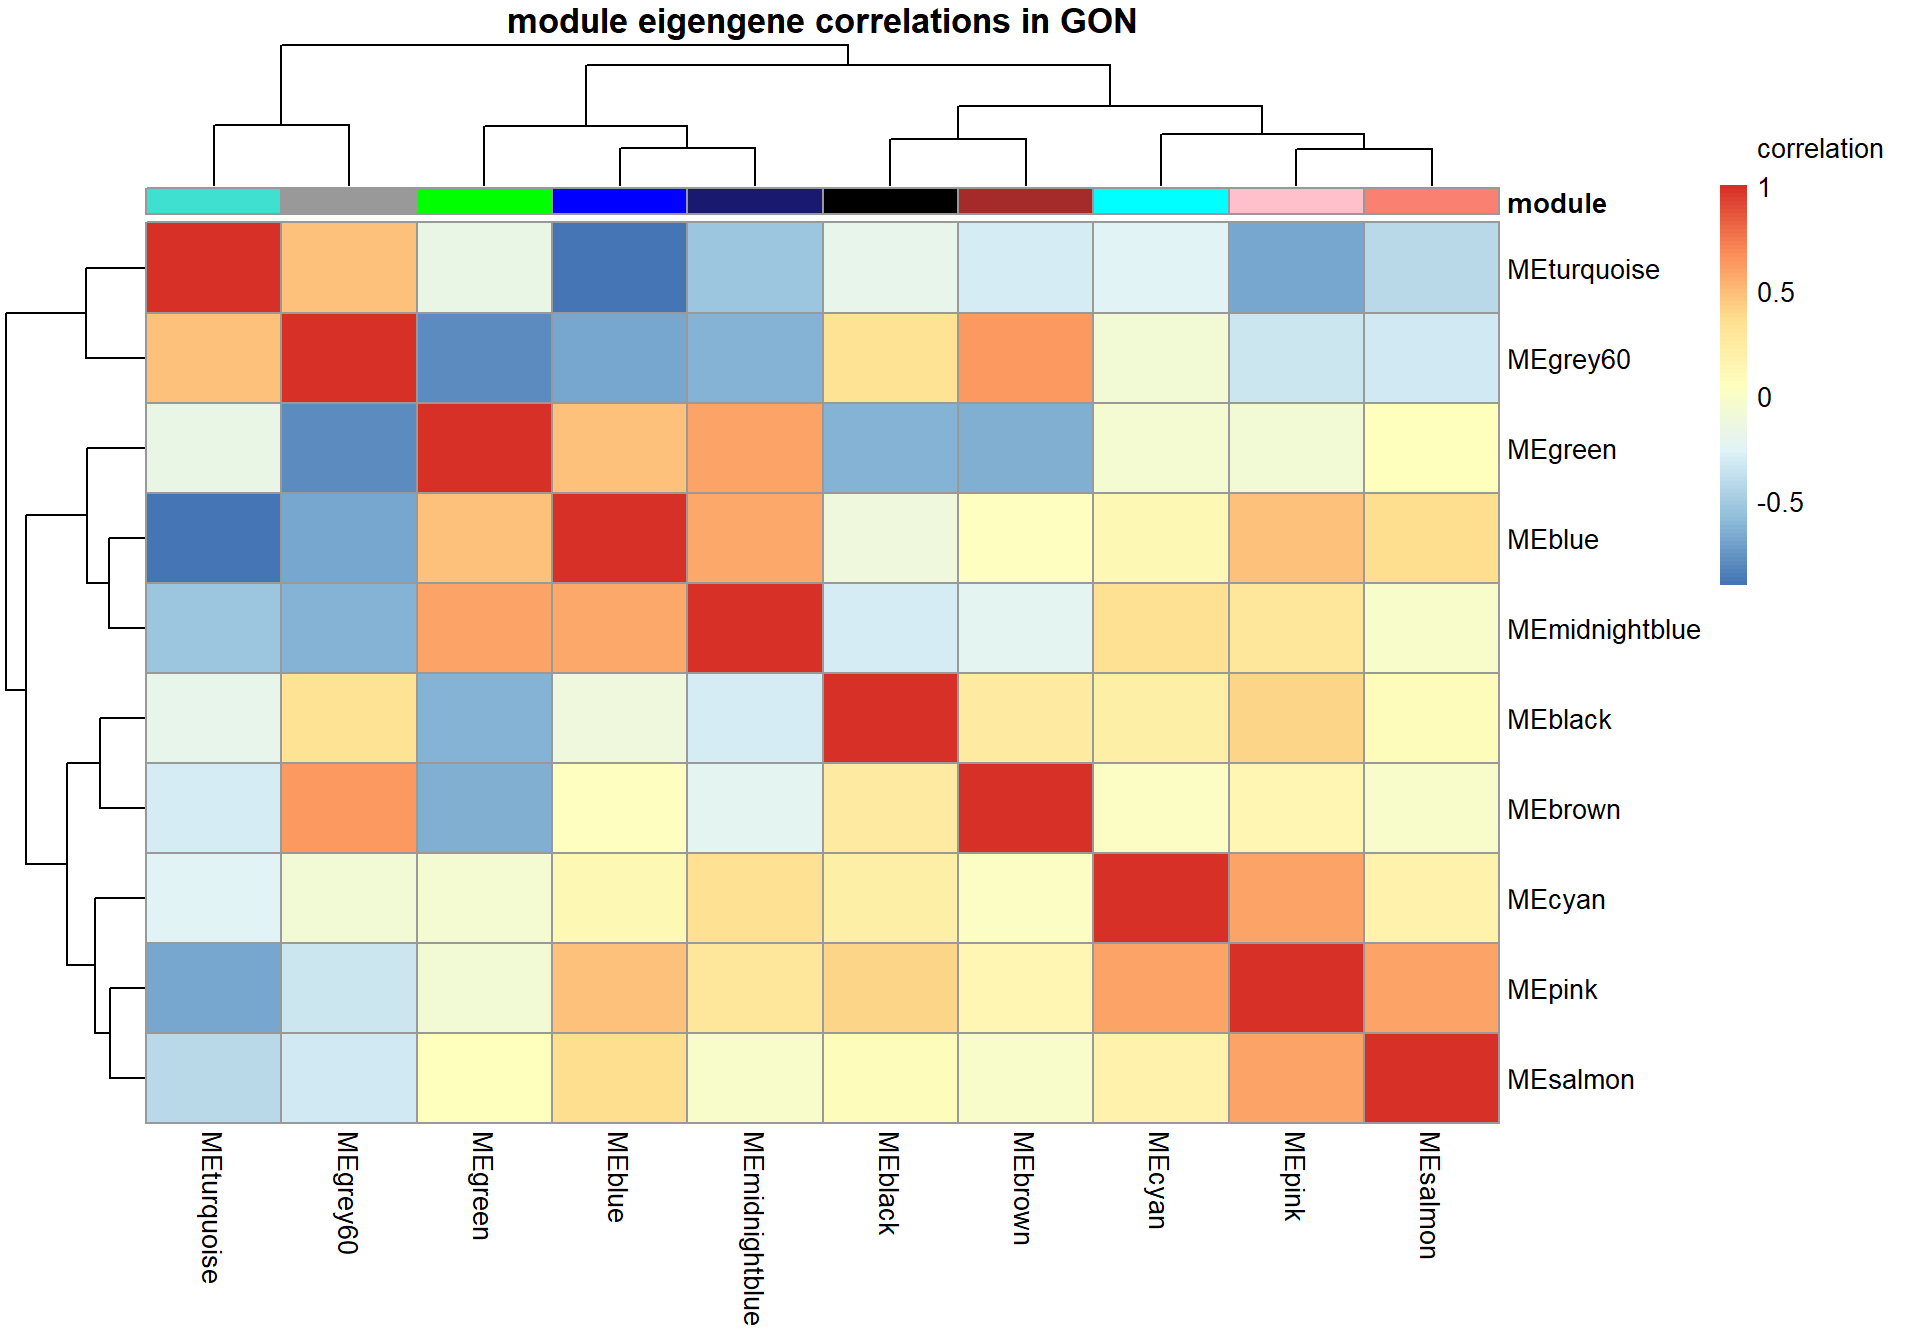
1.8 Interesting modules
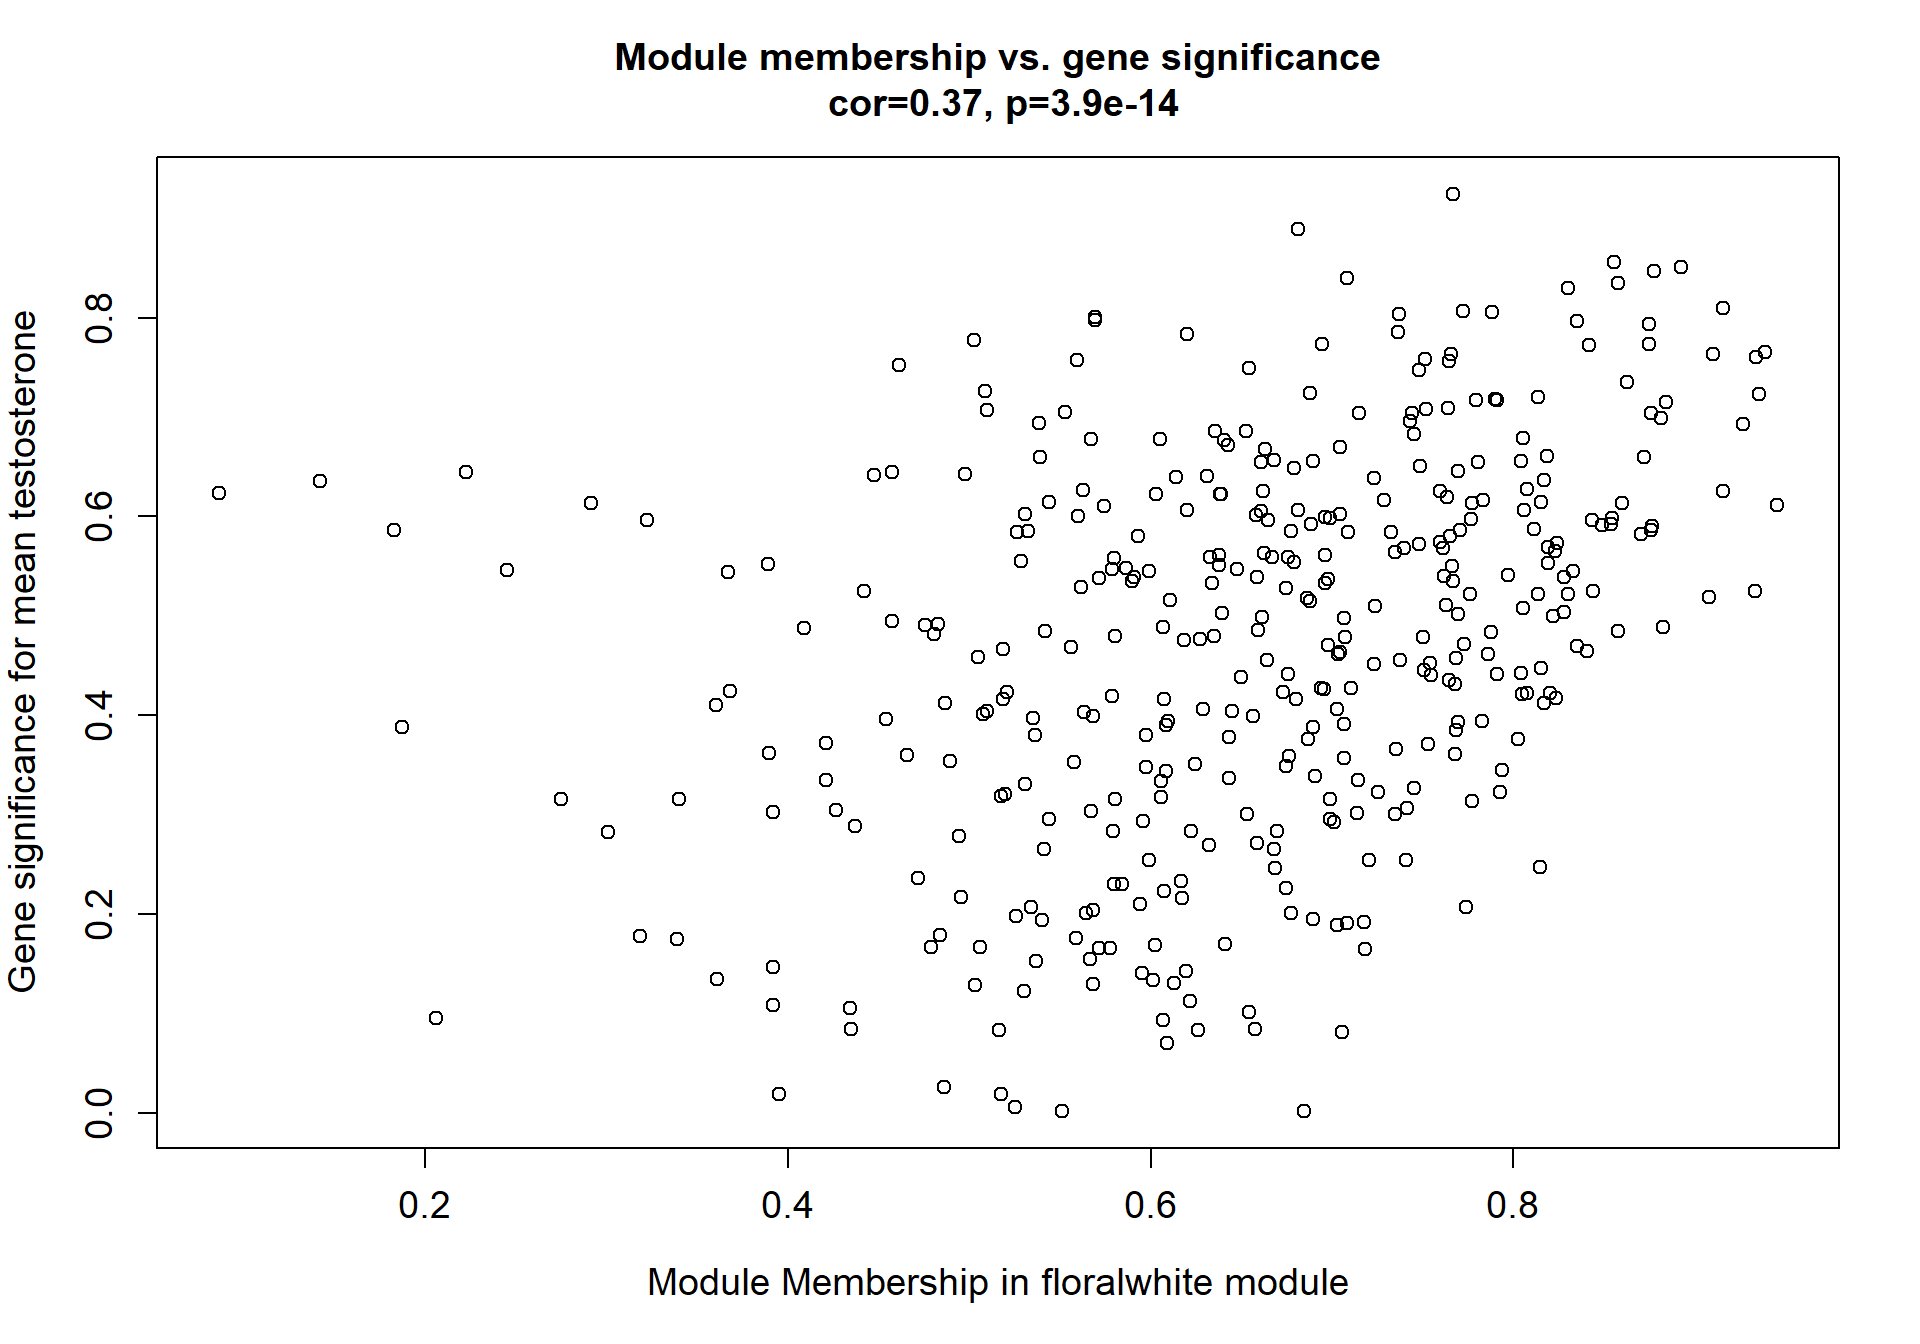
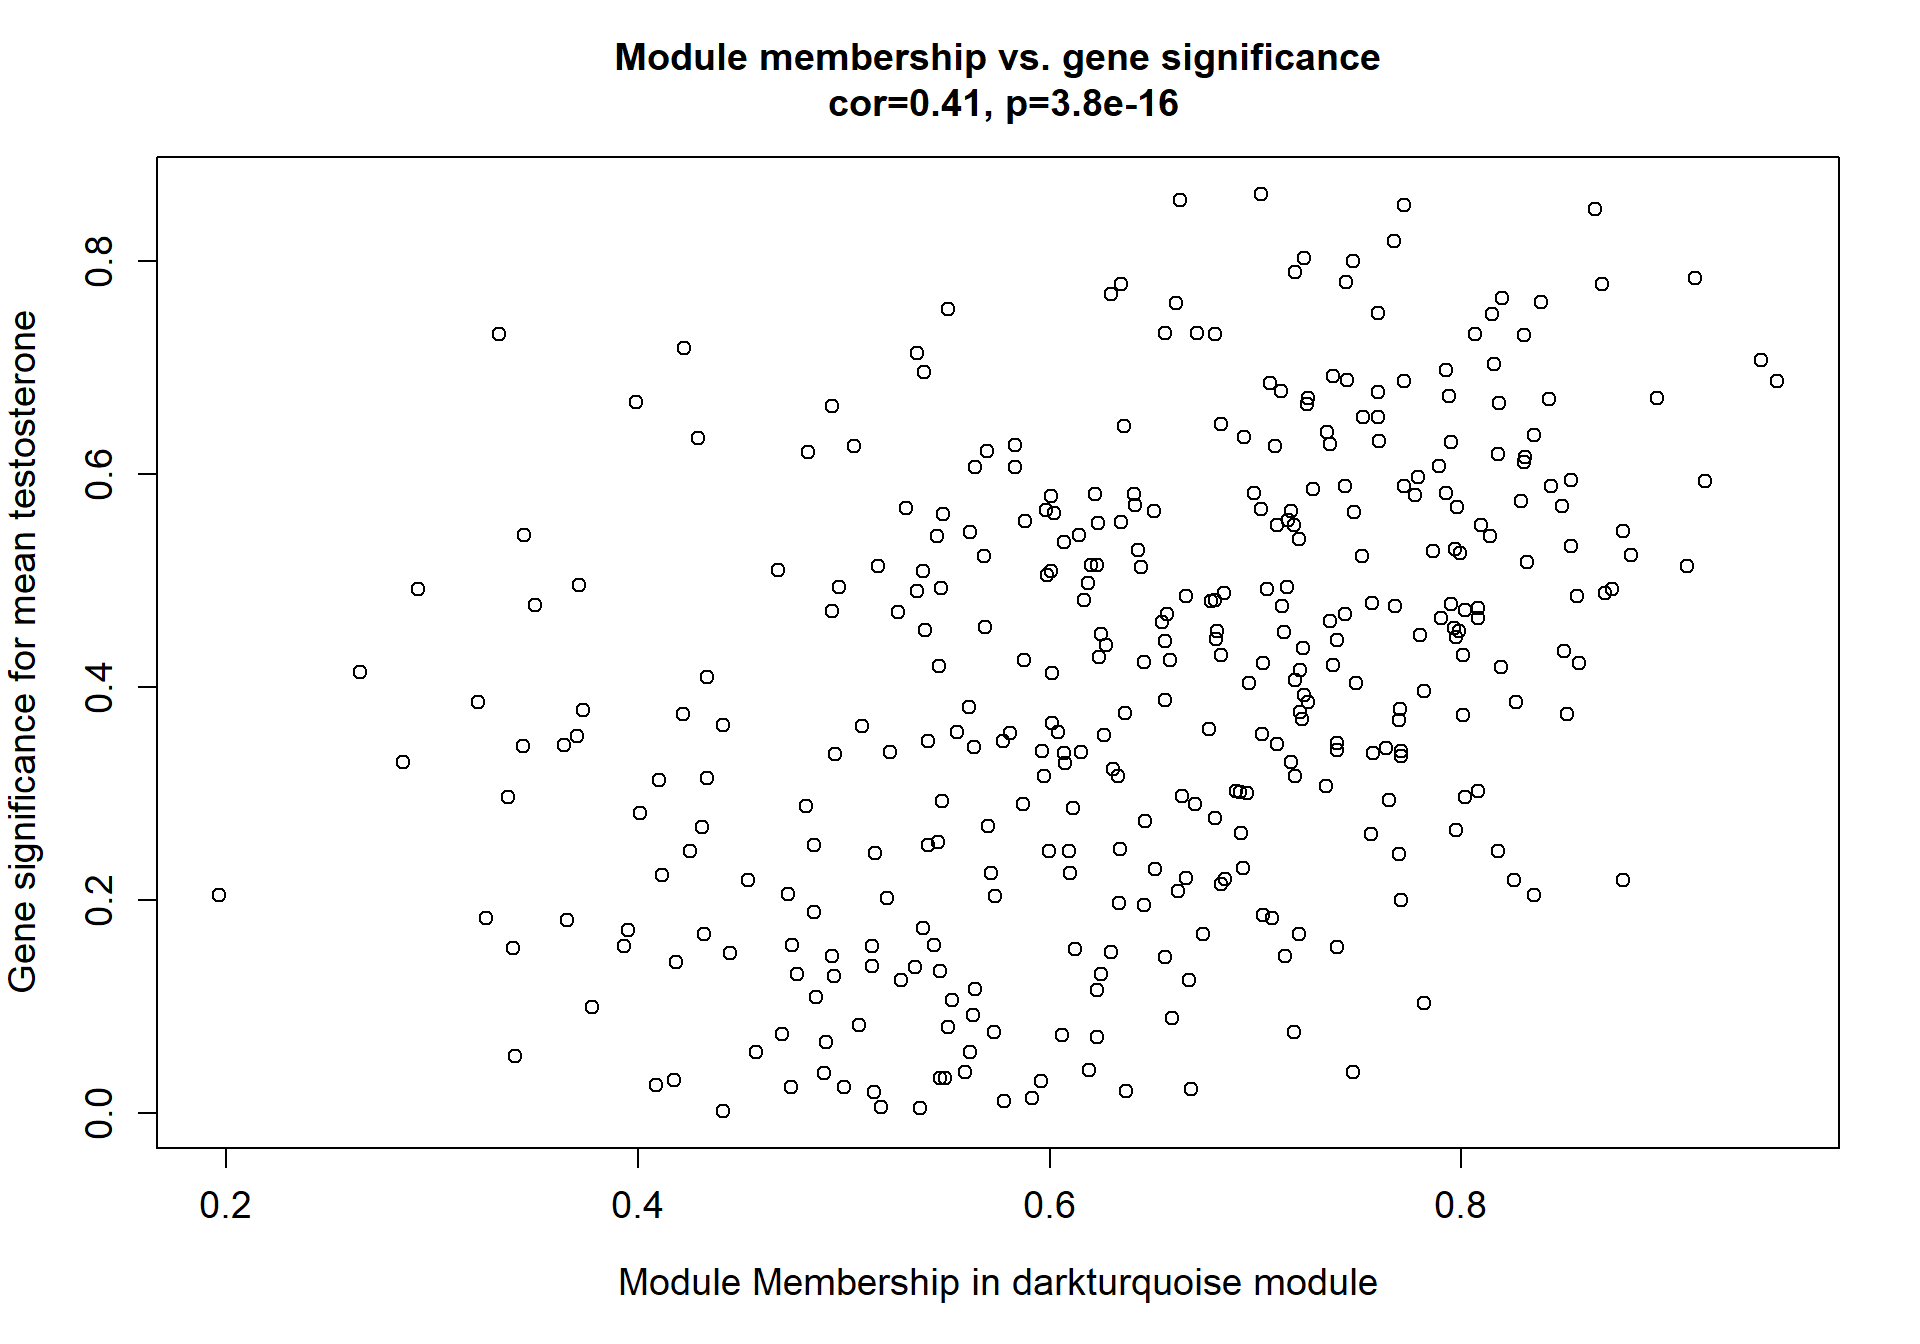
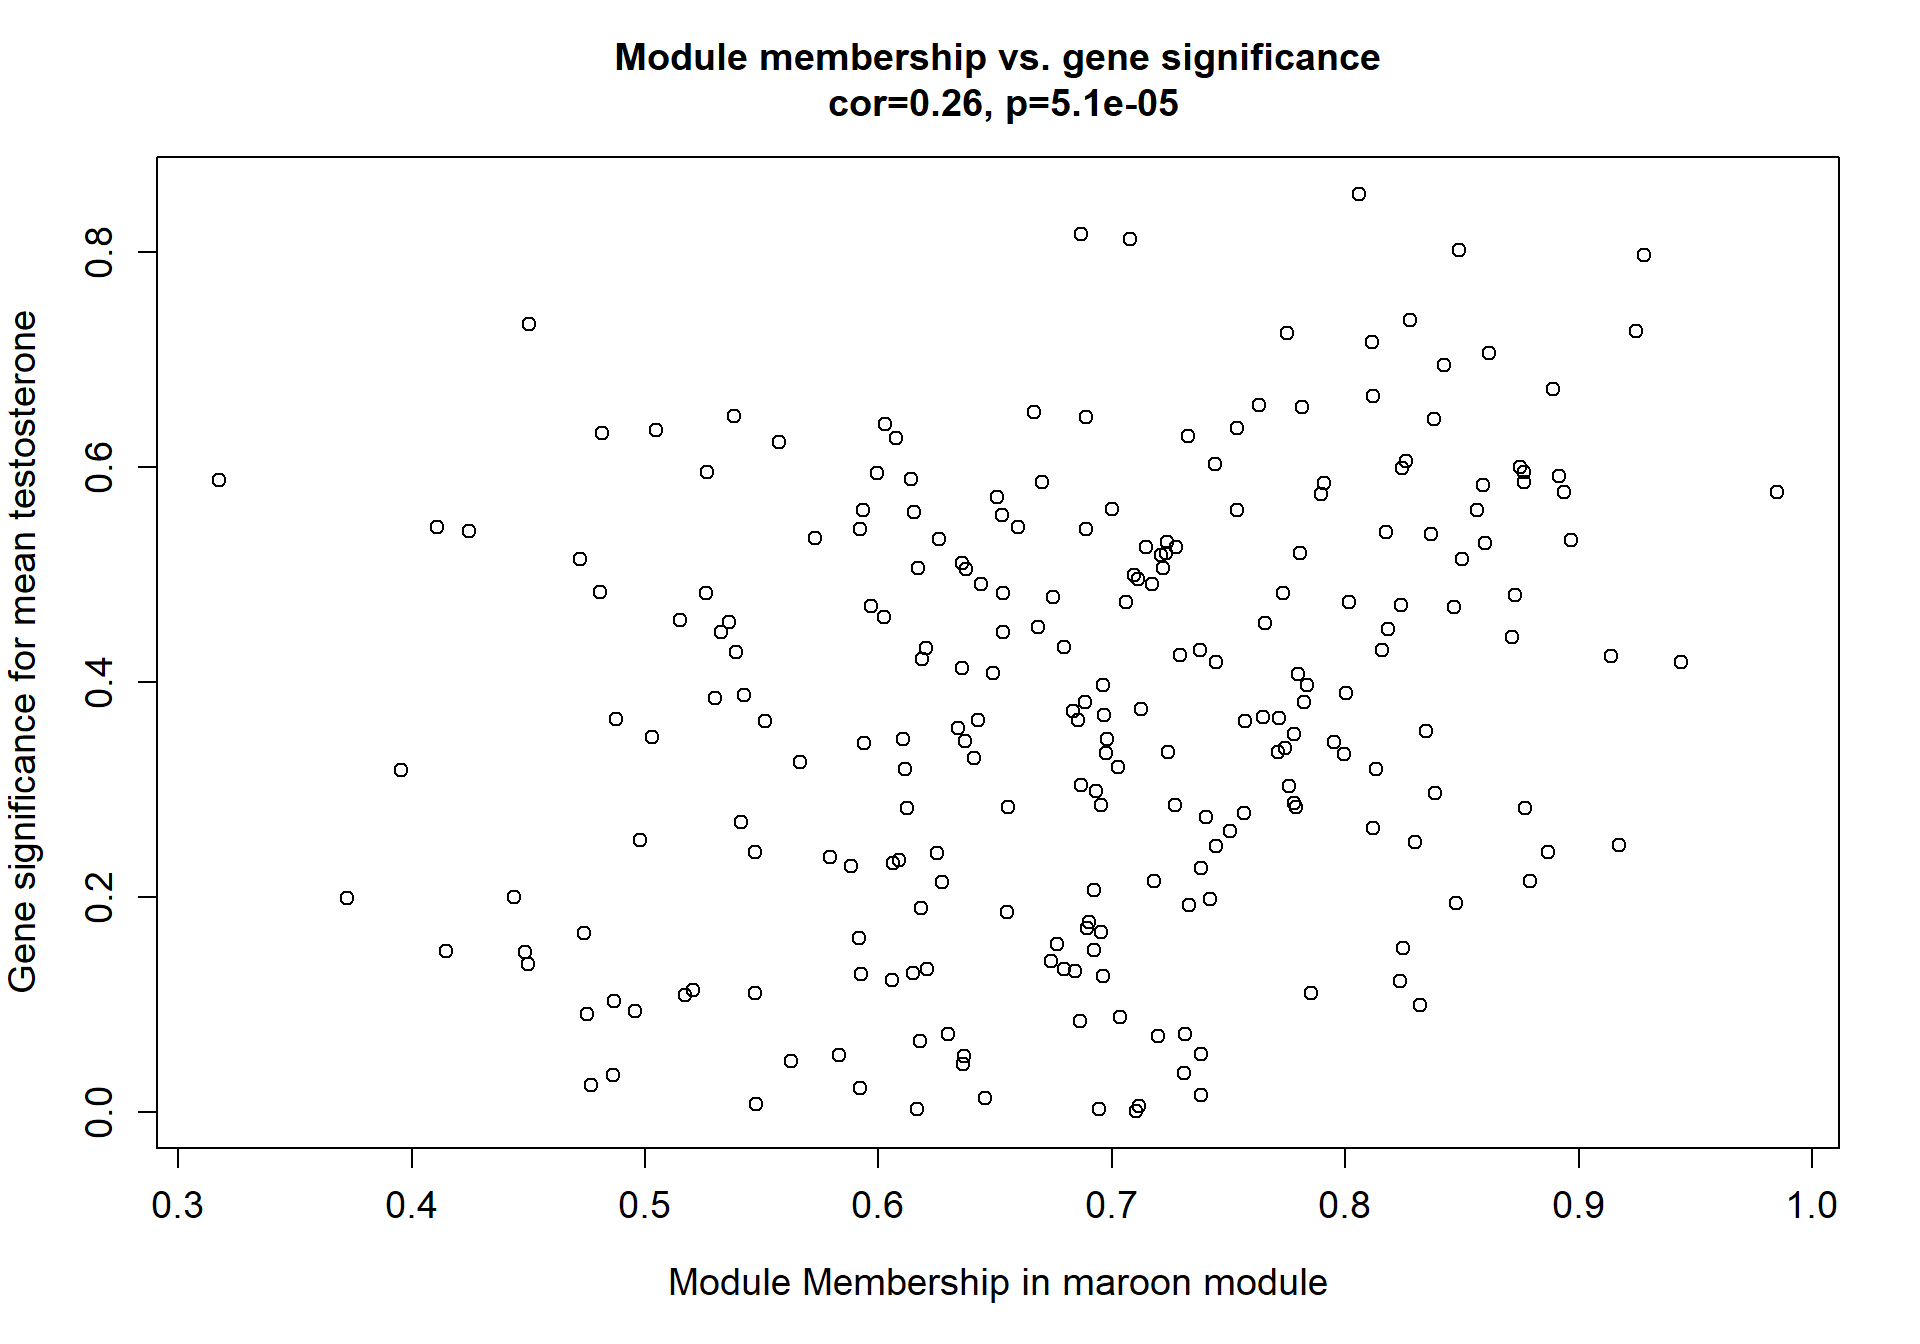
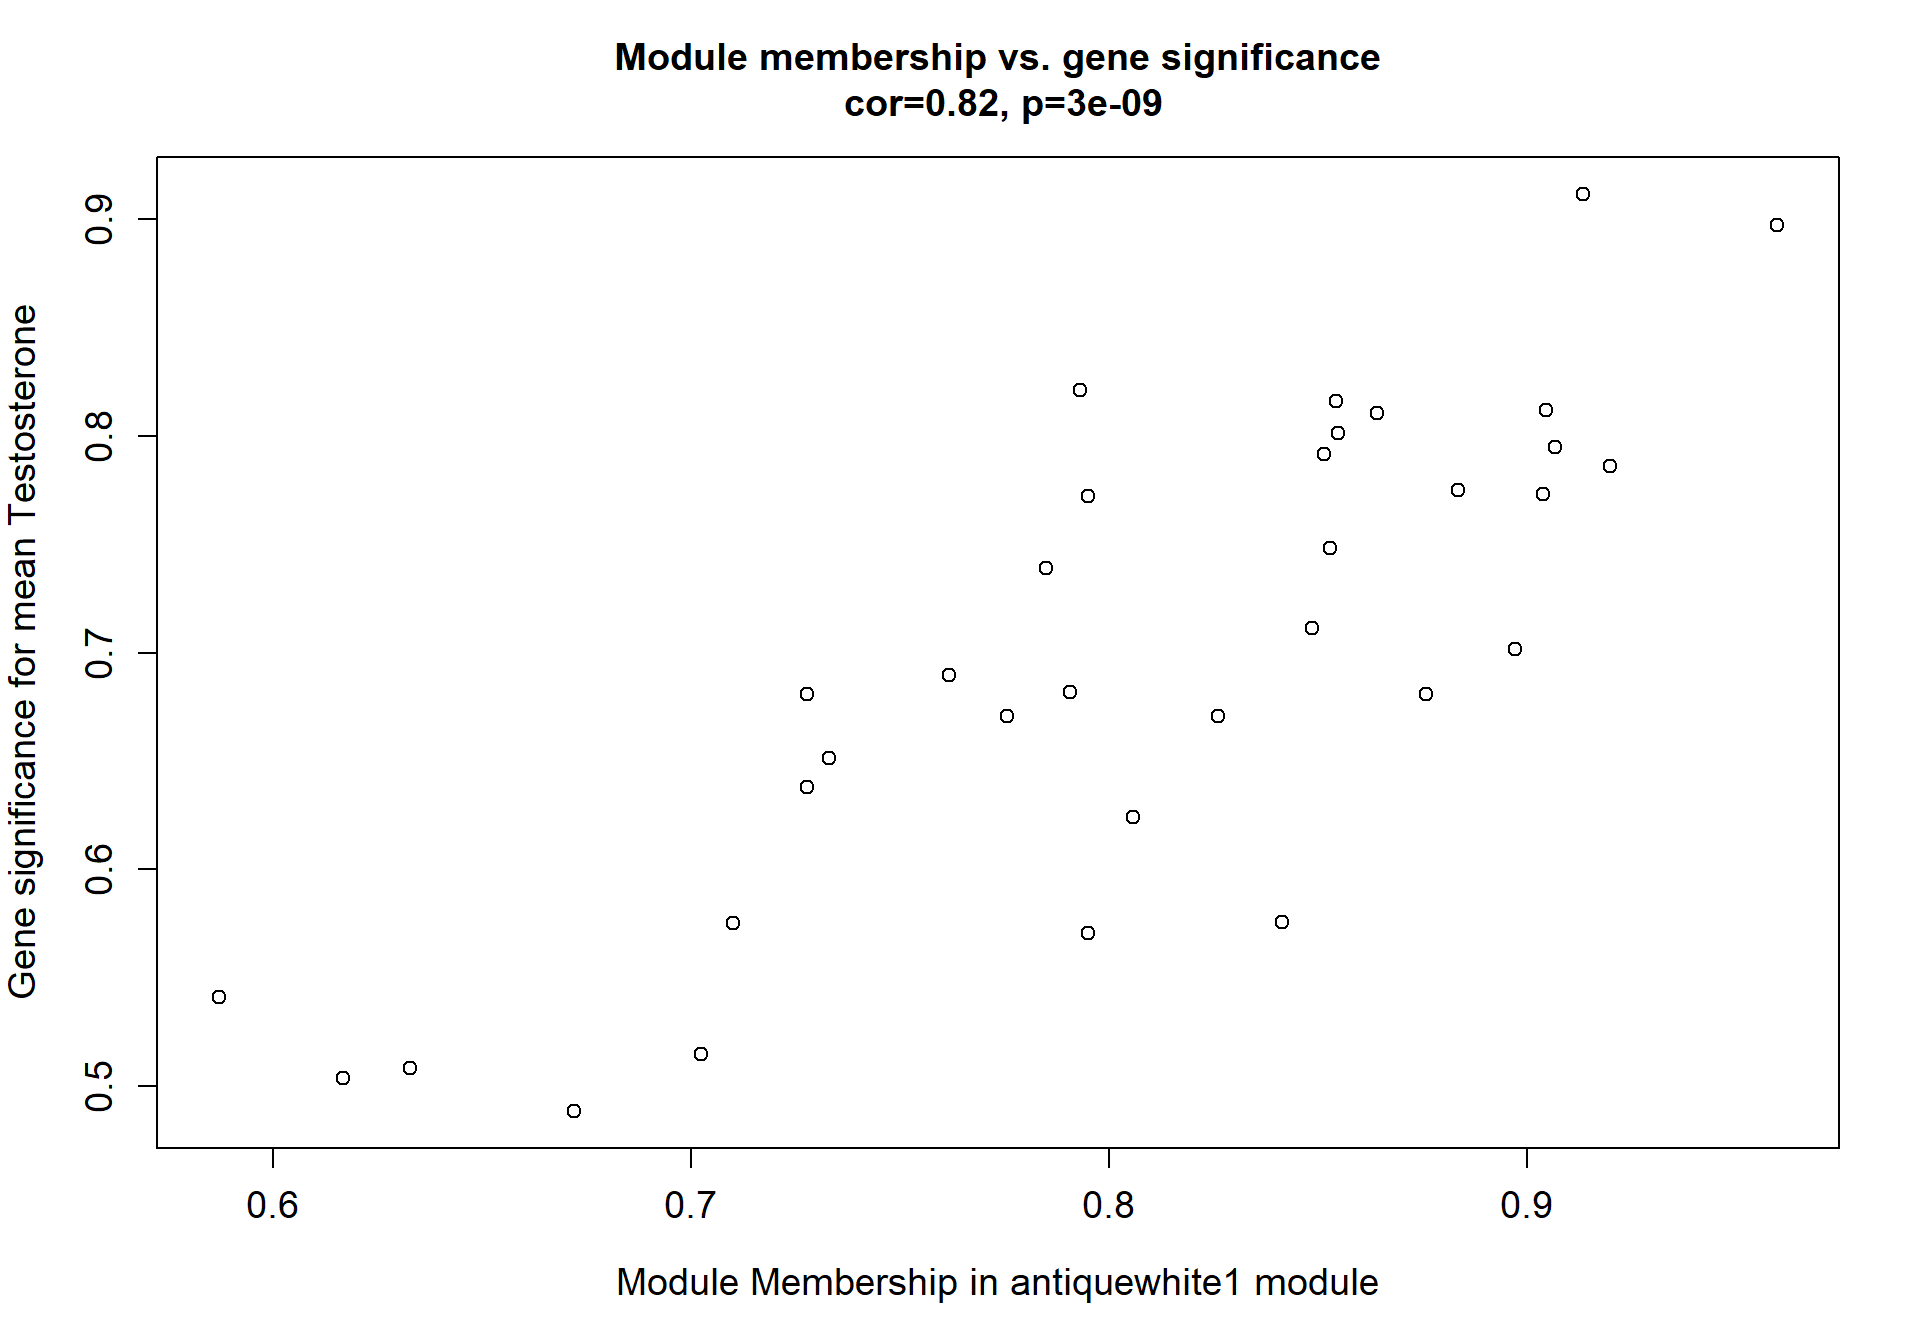
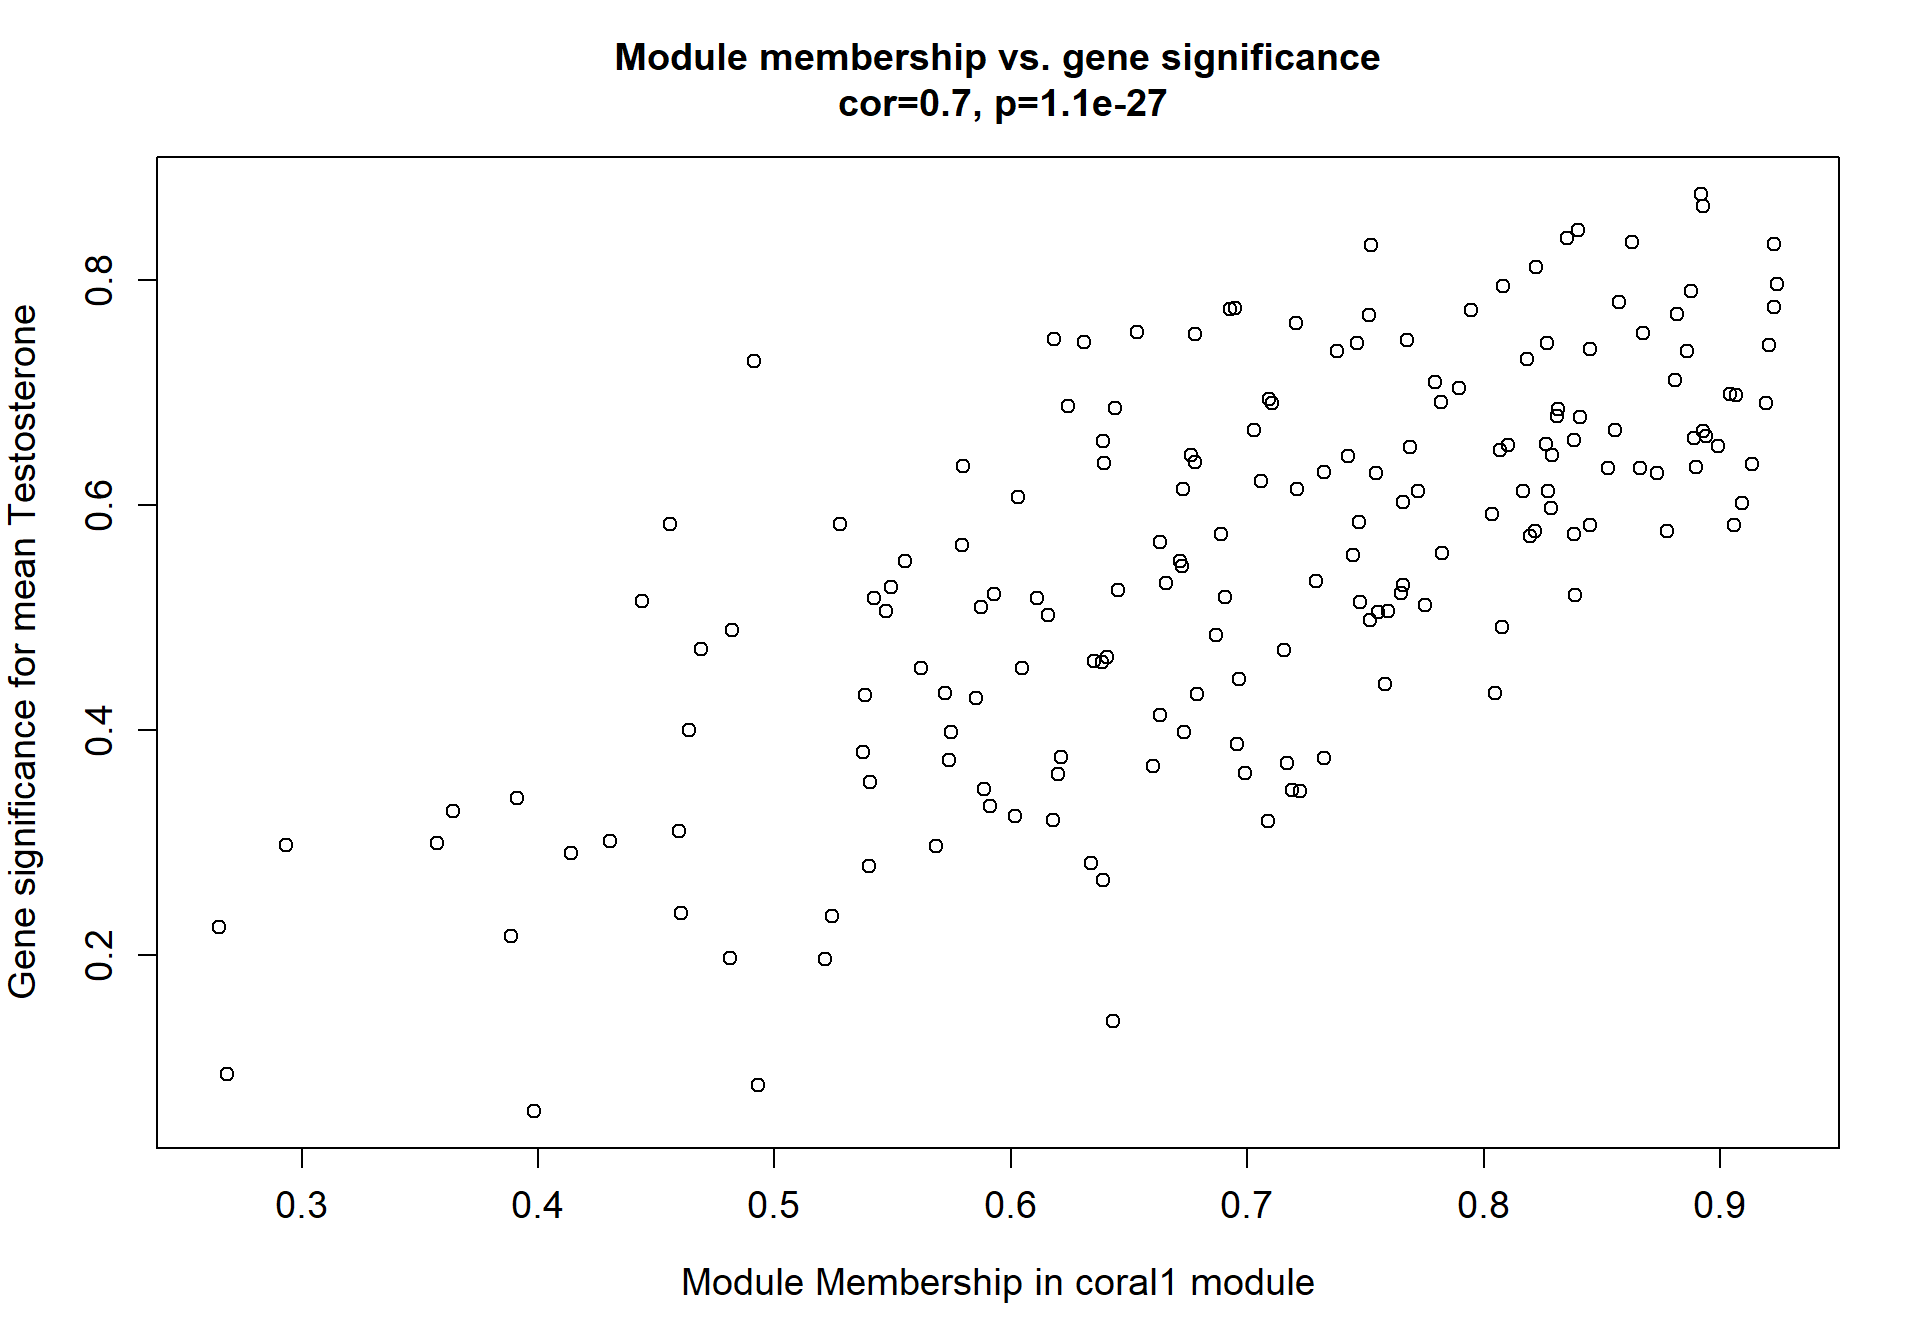
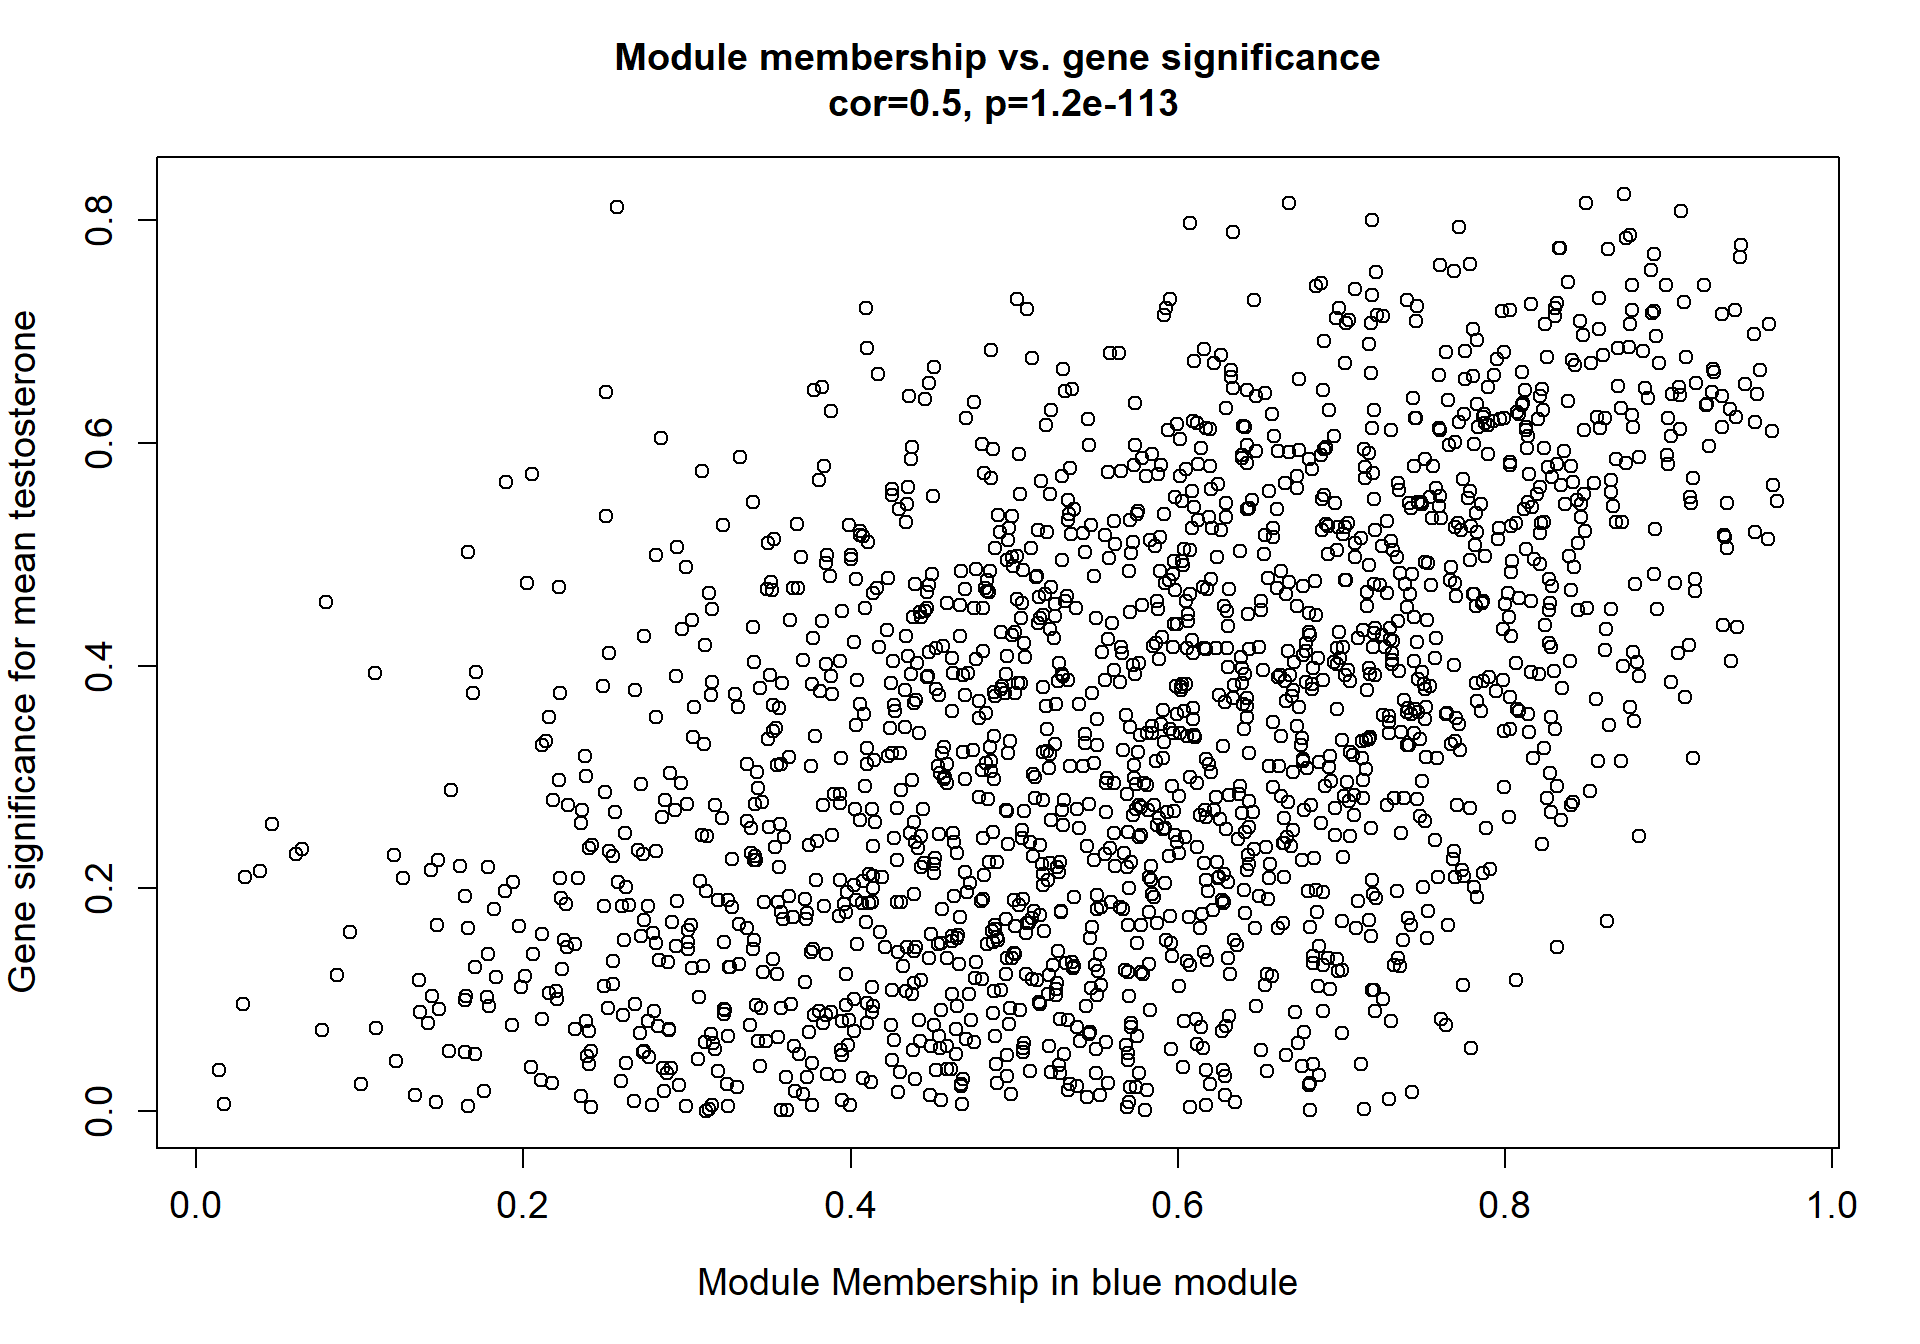
1.8.1 Pink module - mean testosterone
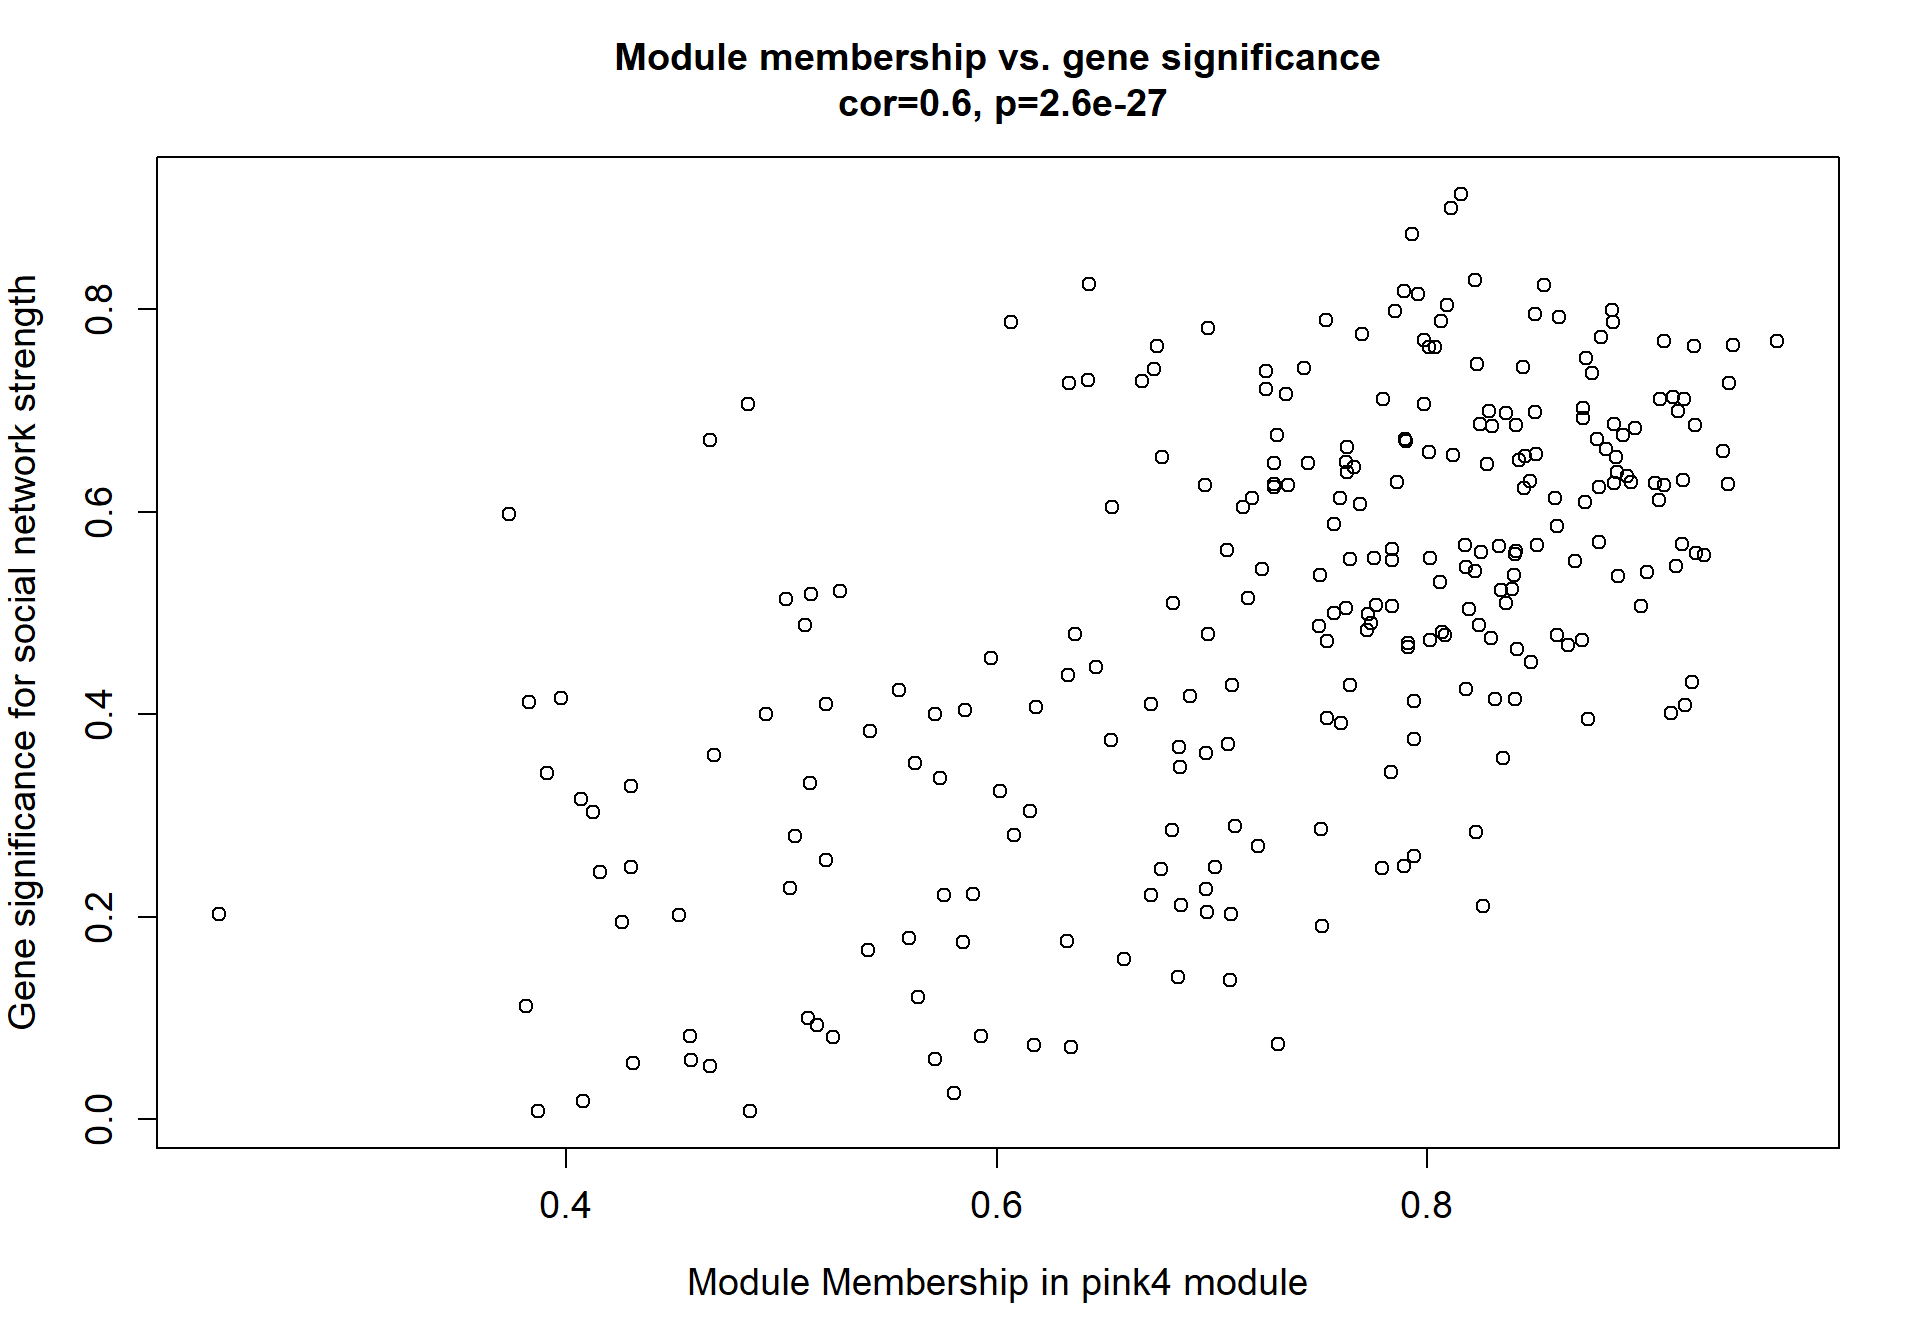
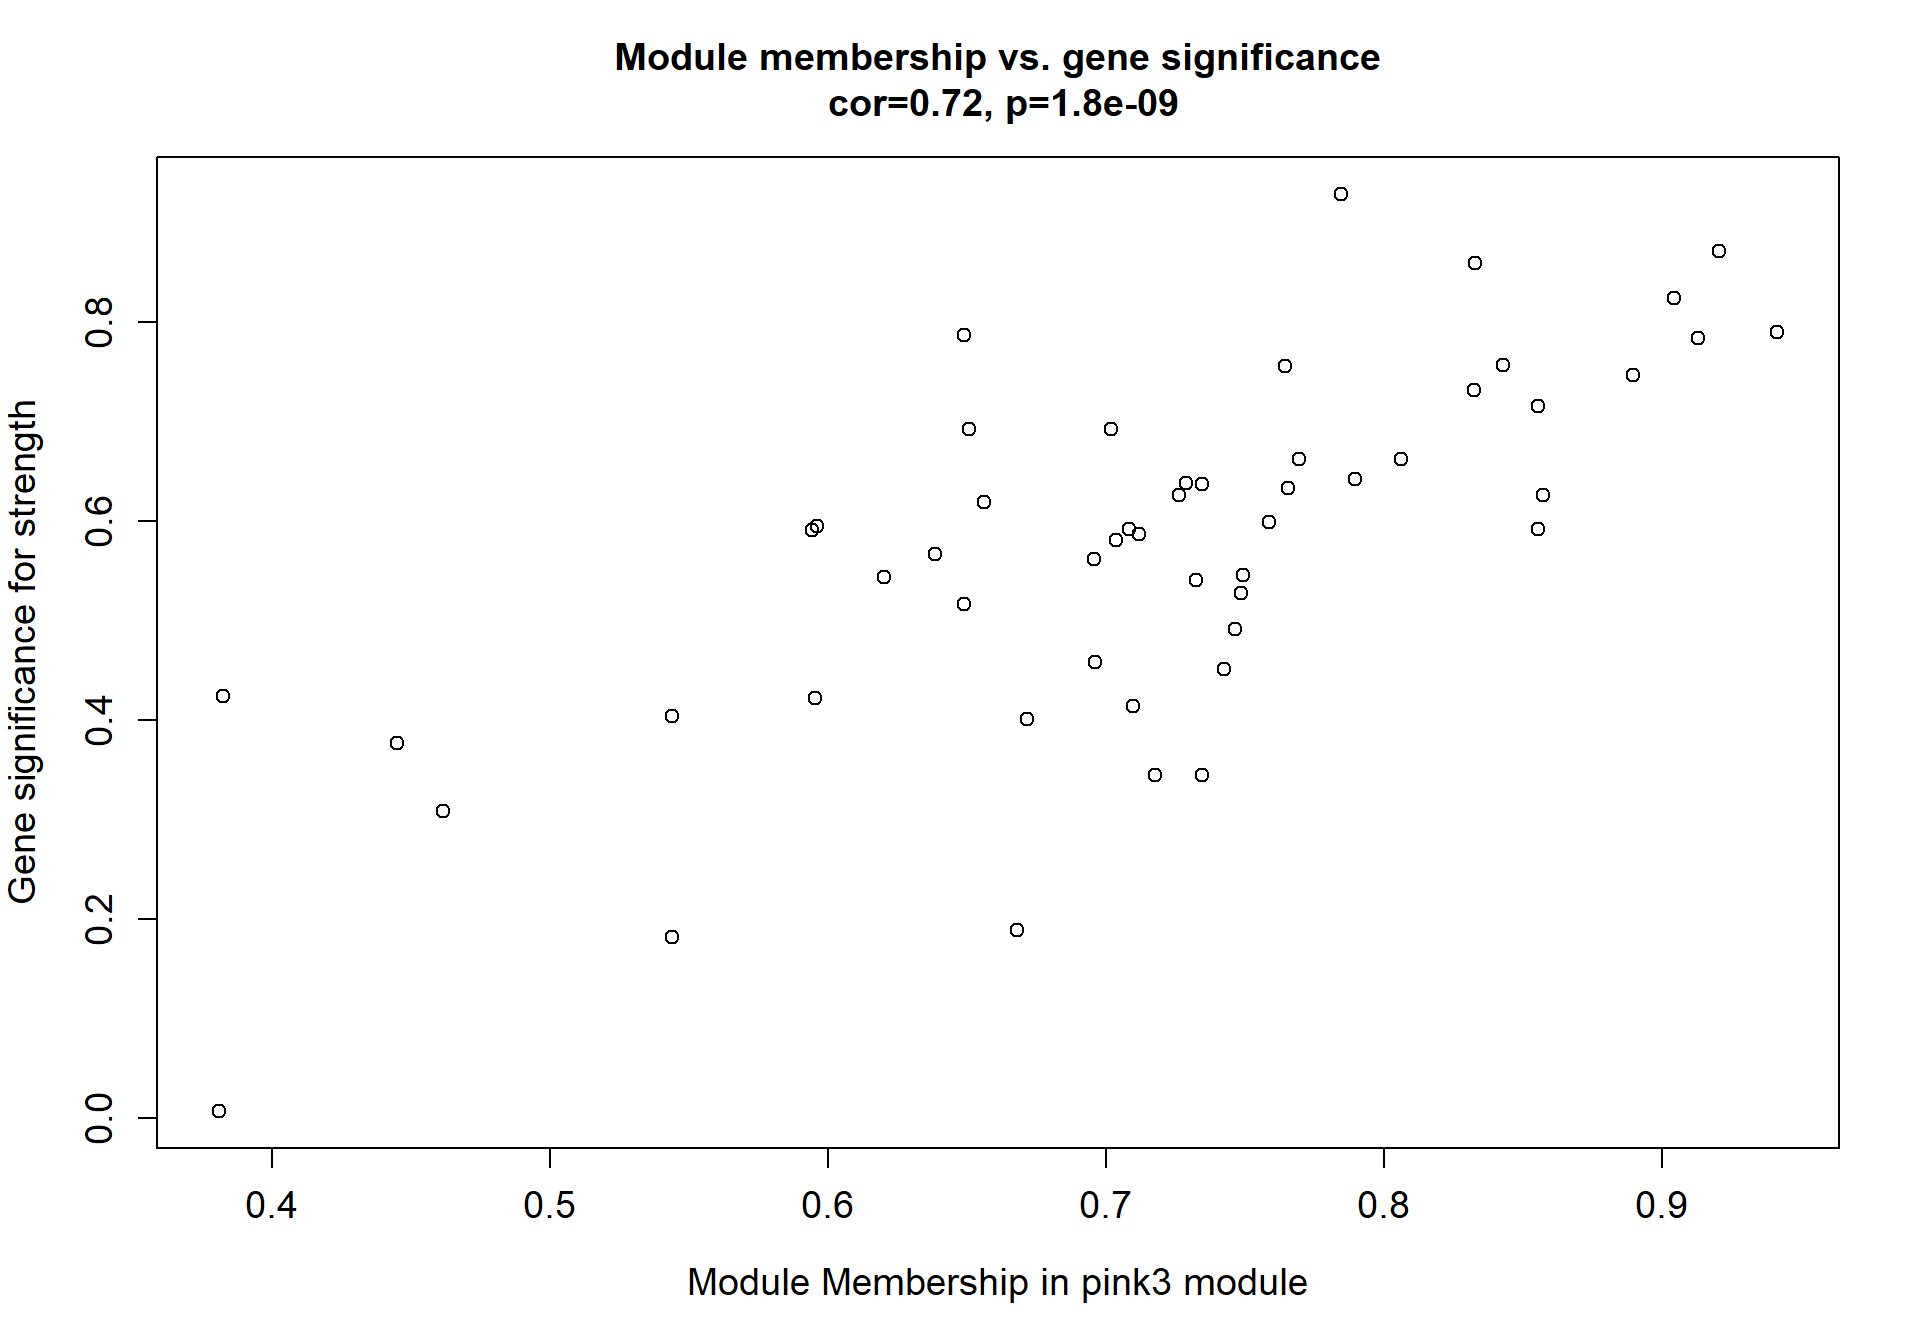
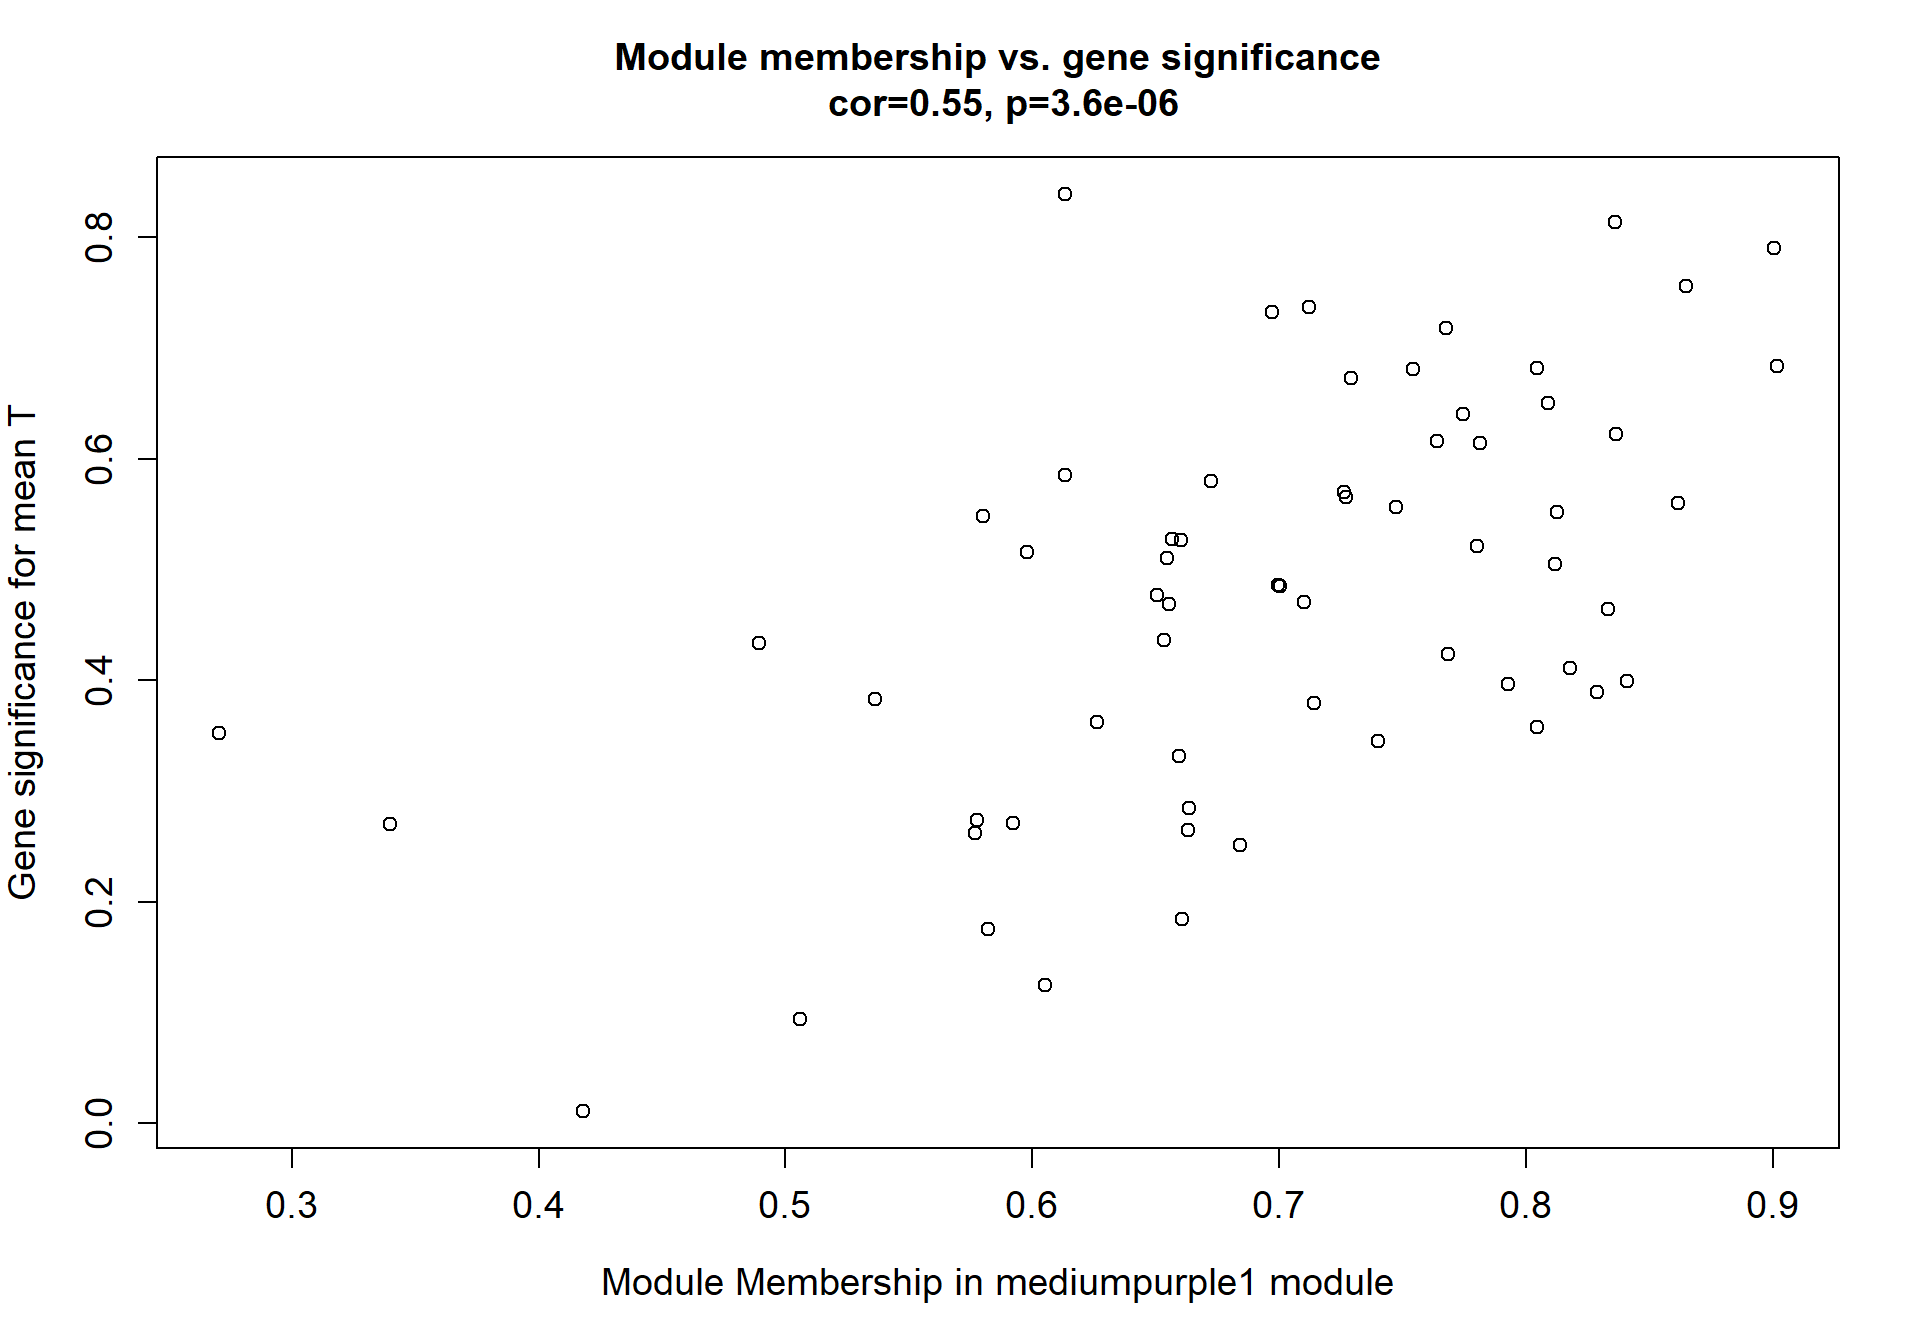
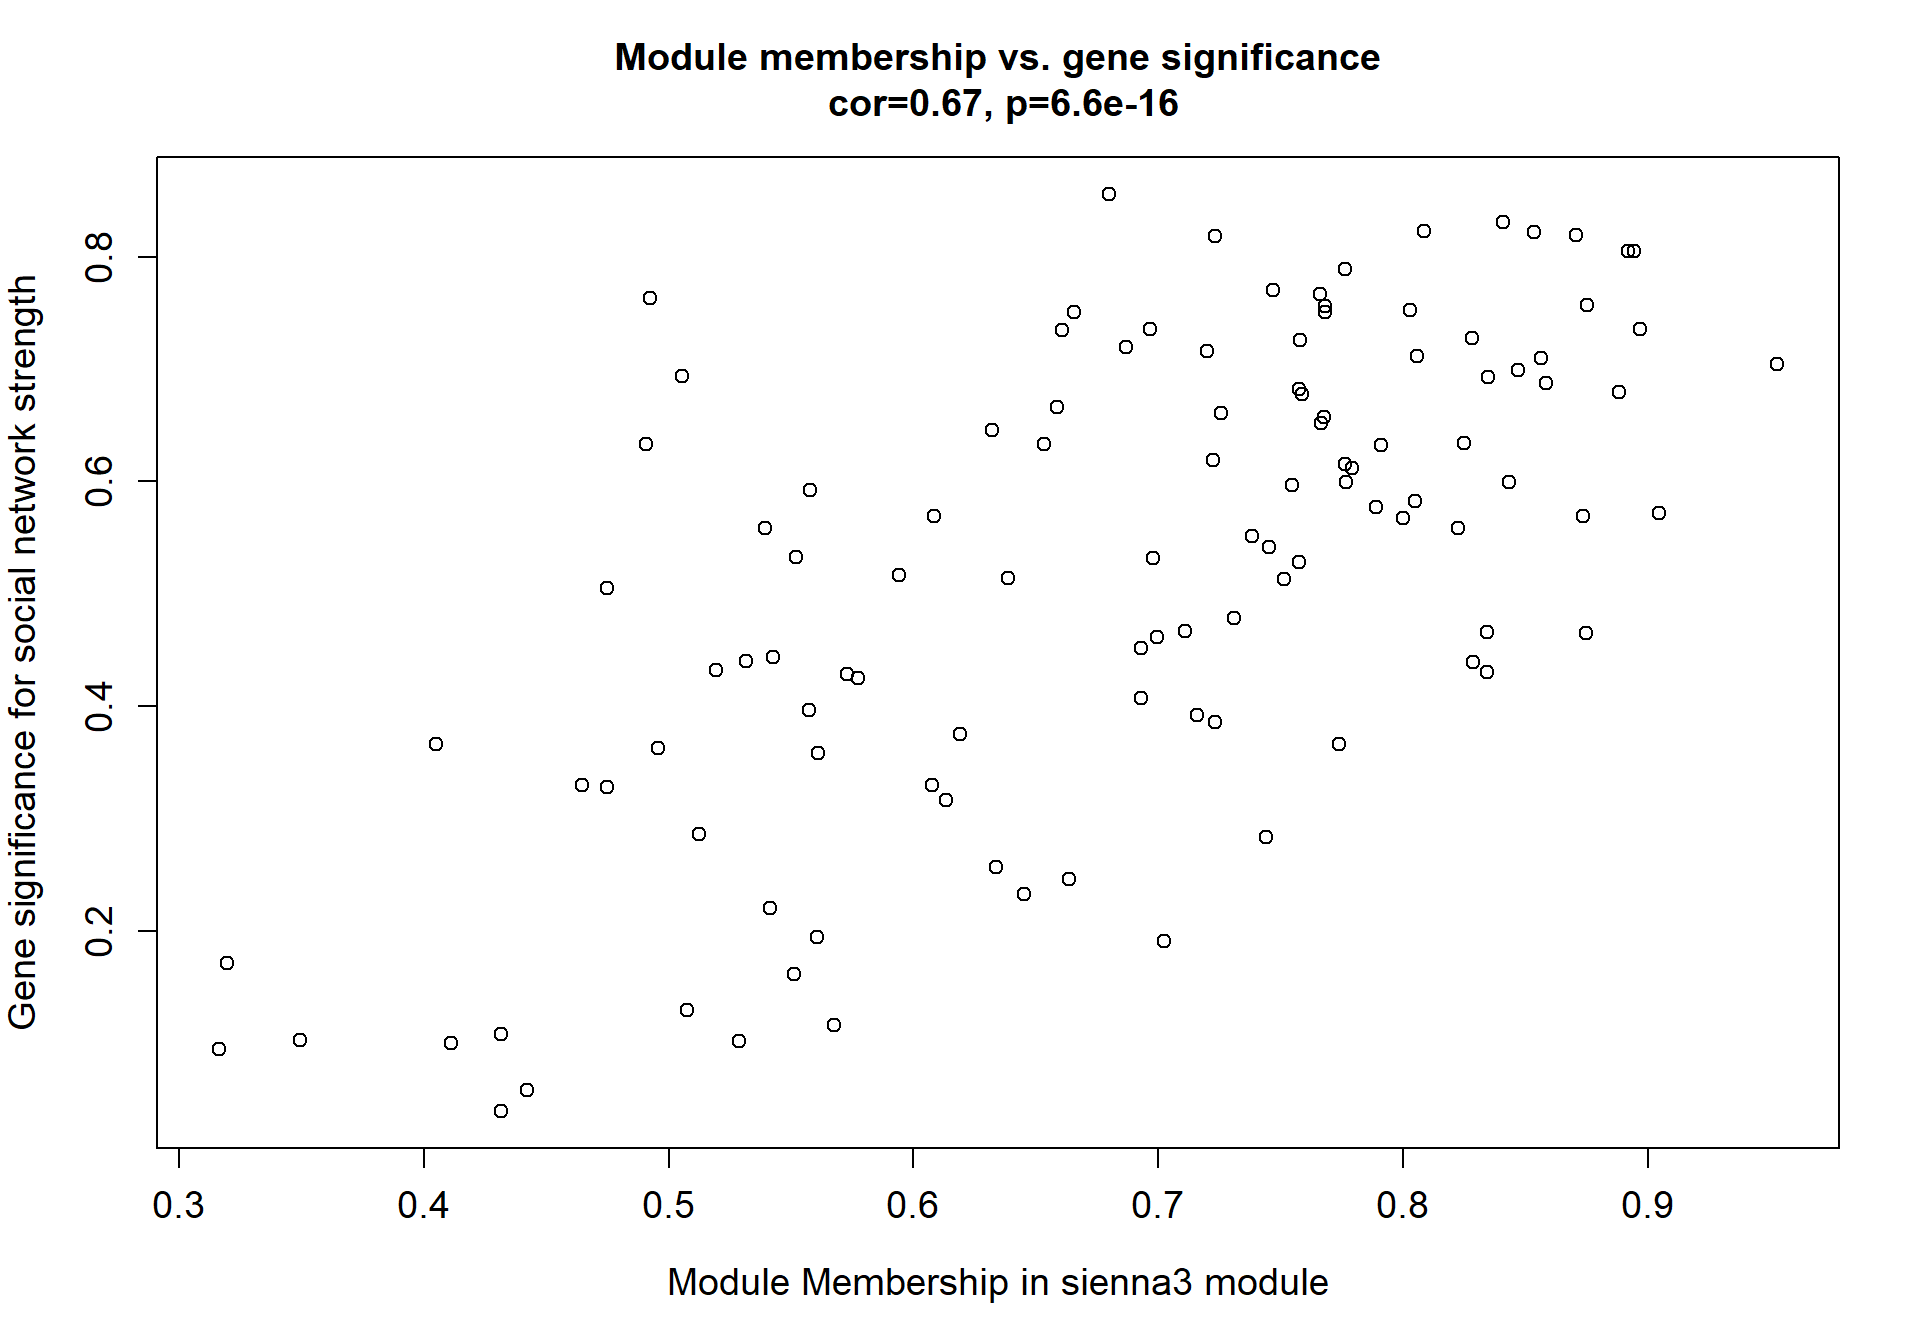
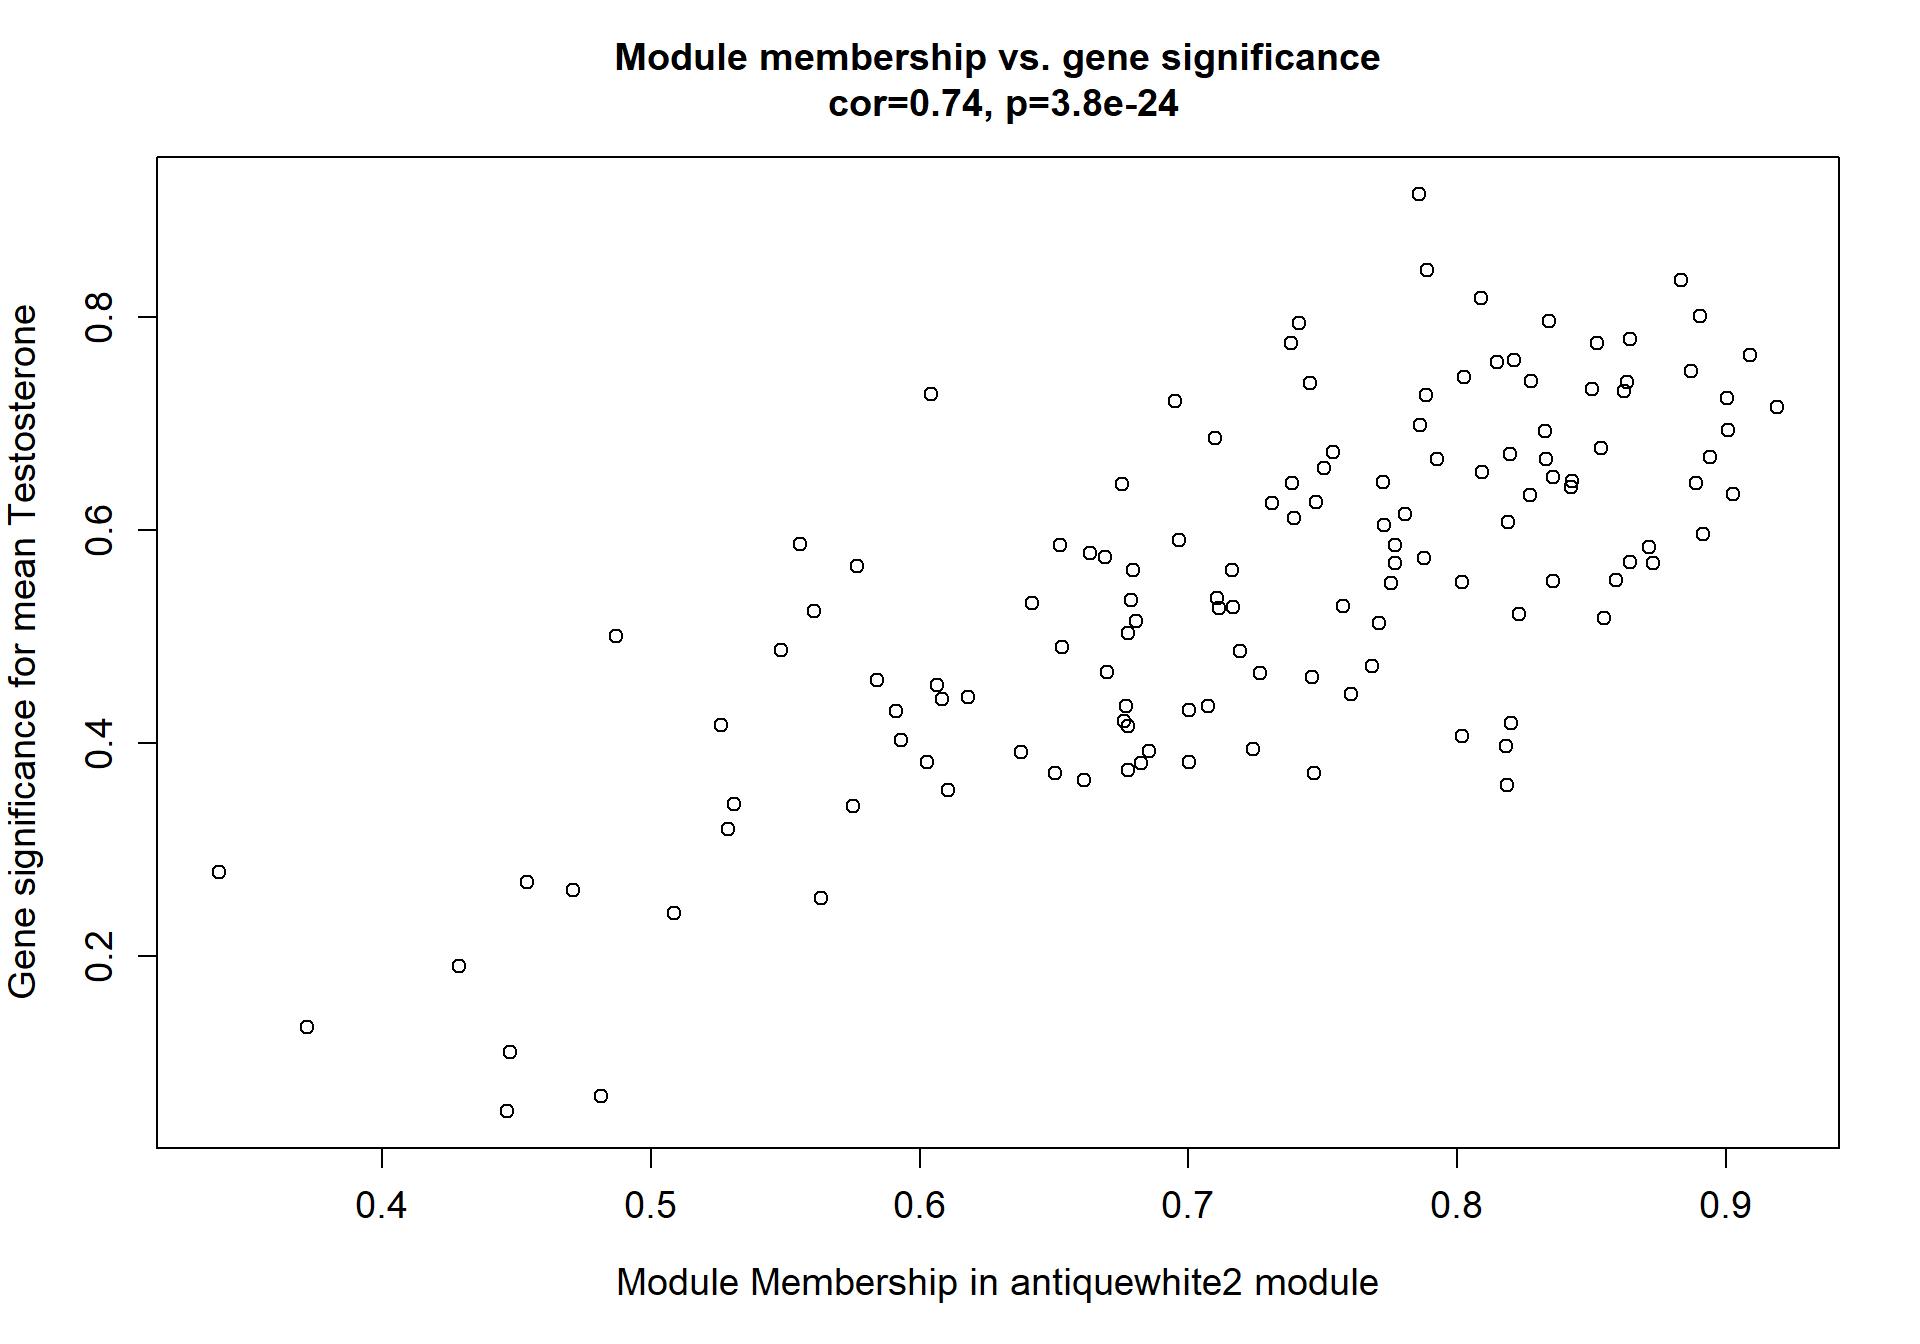
Here I extract the genes associated with a given module and explore them further. This module is potentially associated with mean testosterone. The WGCNA manual says that a good association will show a relationship between the module membership scores of each gene and the gene-significance for that gene.
whichModule="pink"

modcol=paste("MM.",whichModule,sep="")
module_genes<- color[color$moduleColor==whichModule,]


verboseScatterplot(abs(module_genes[, modcol]),
abs(GS[GS$moduleColor==whichModule, "GS.mean_T"]),
xlab = paste("Module Membership in", whichModule, "module"),
ylab = "Gene significance for mean Testosterone",
main = paste("Module membership vs. gene significance\n"),
cex.main = 1.2, cex.lab = 1.2, cex.axis = 1.2, col = whichModule)
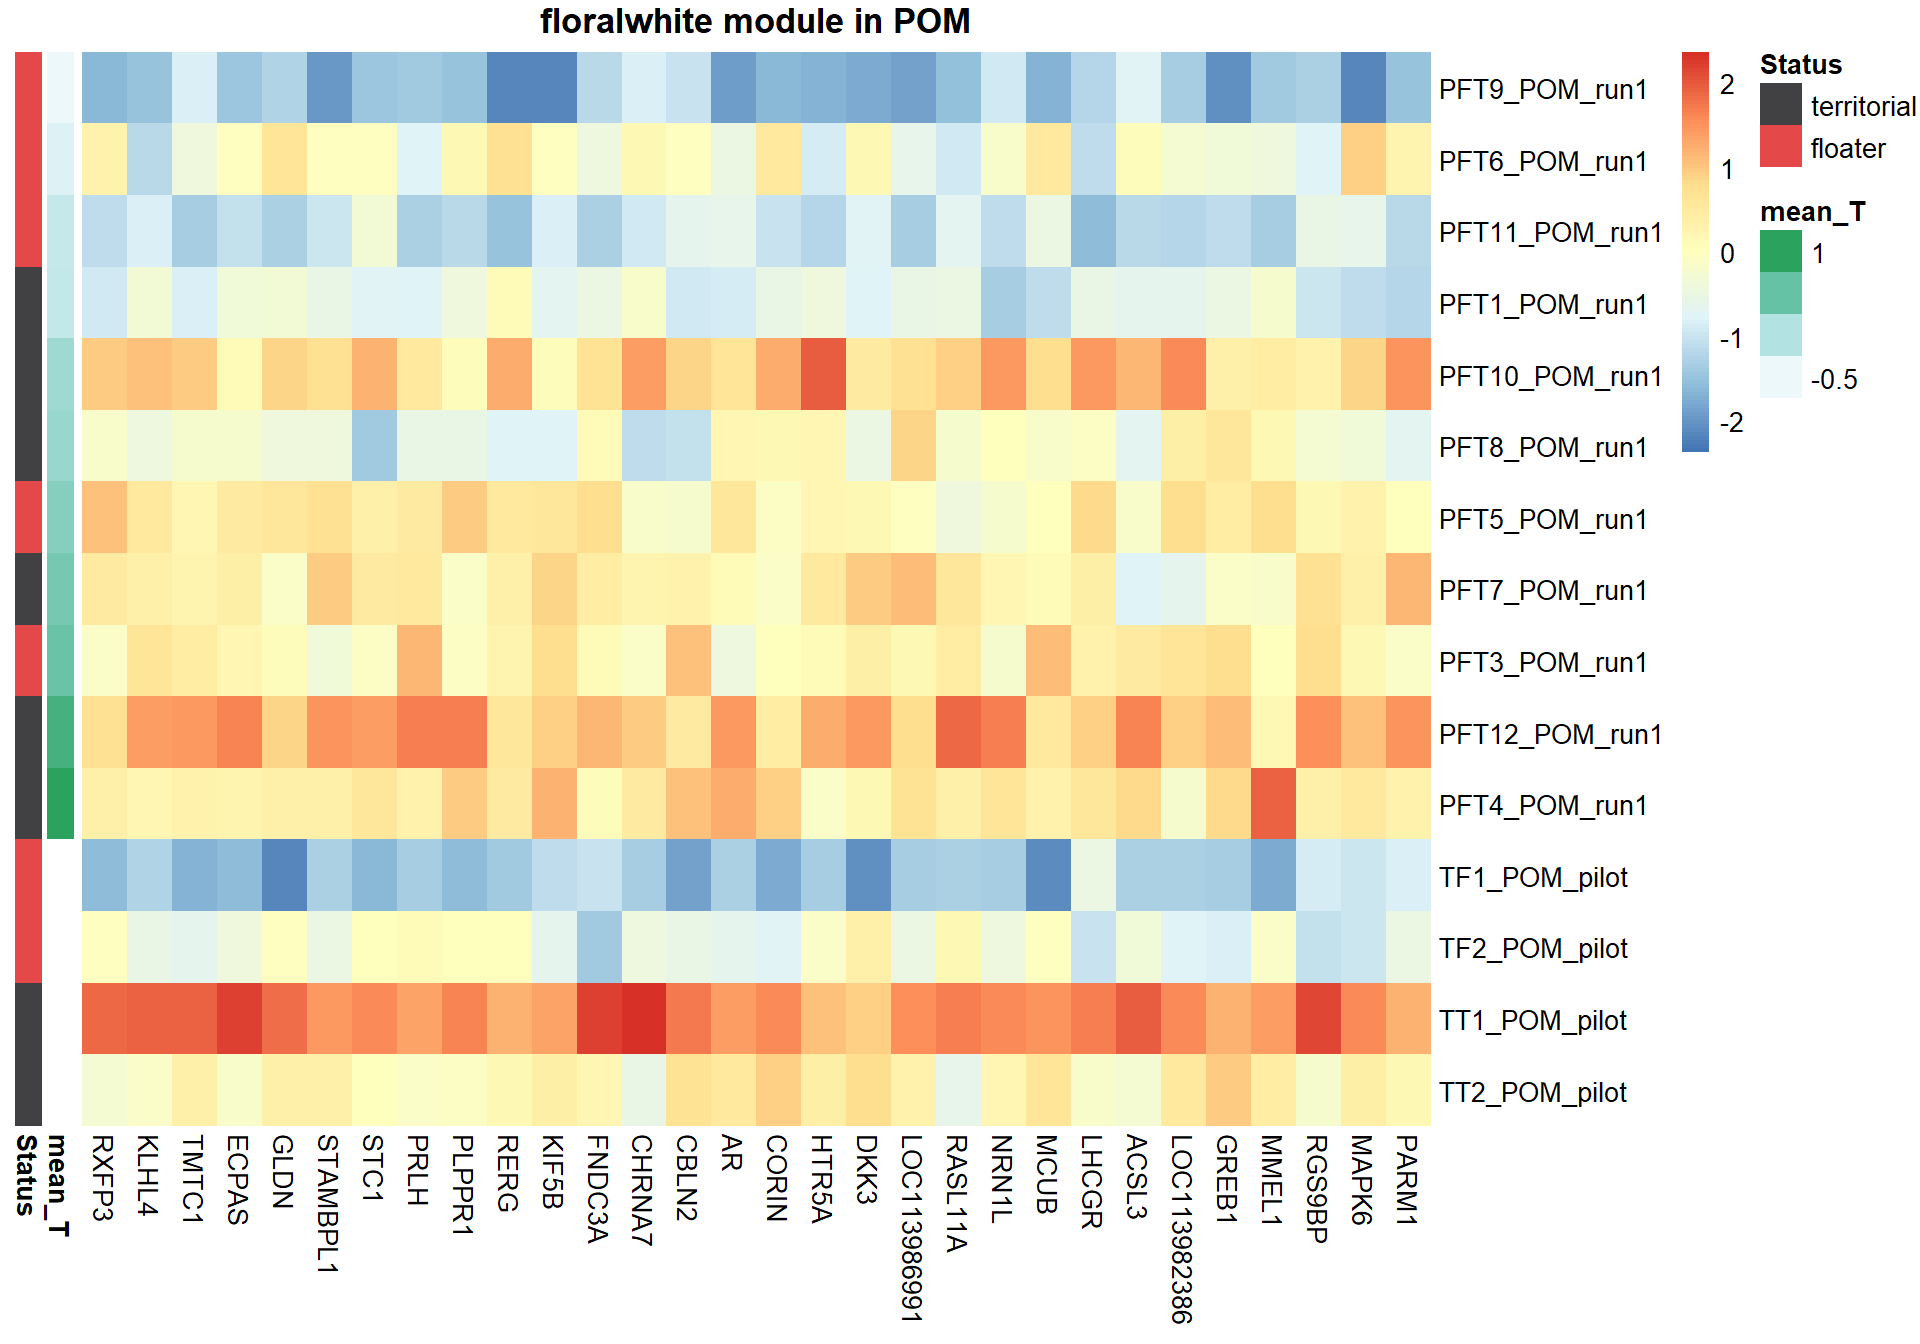
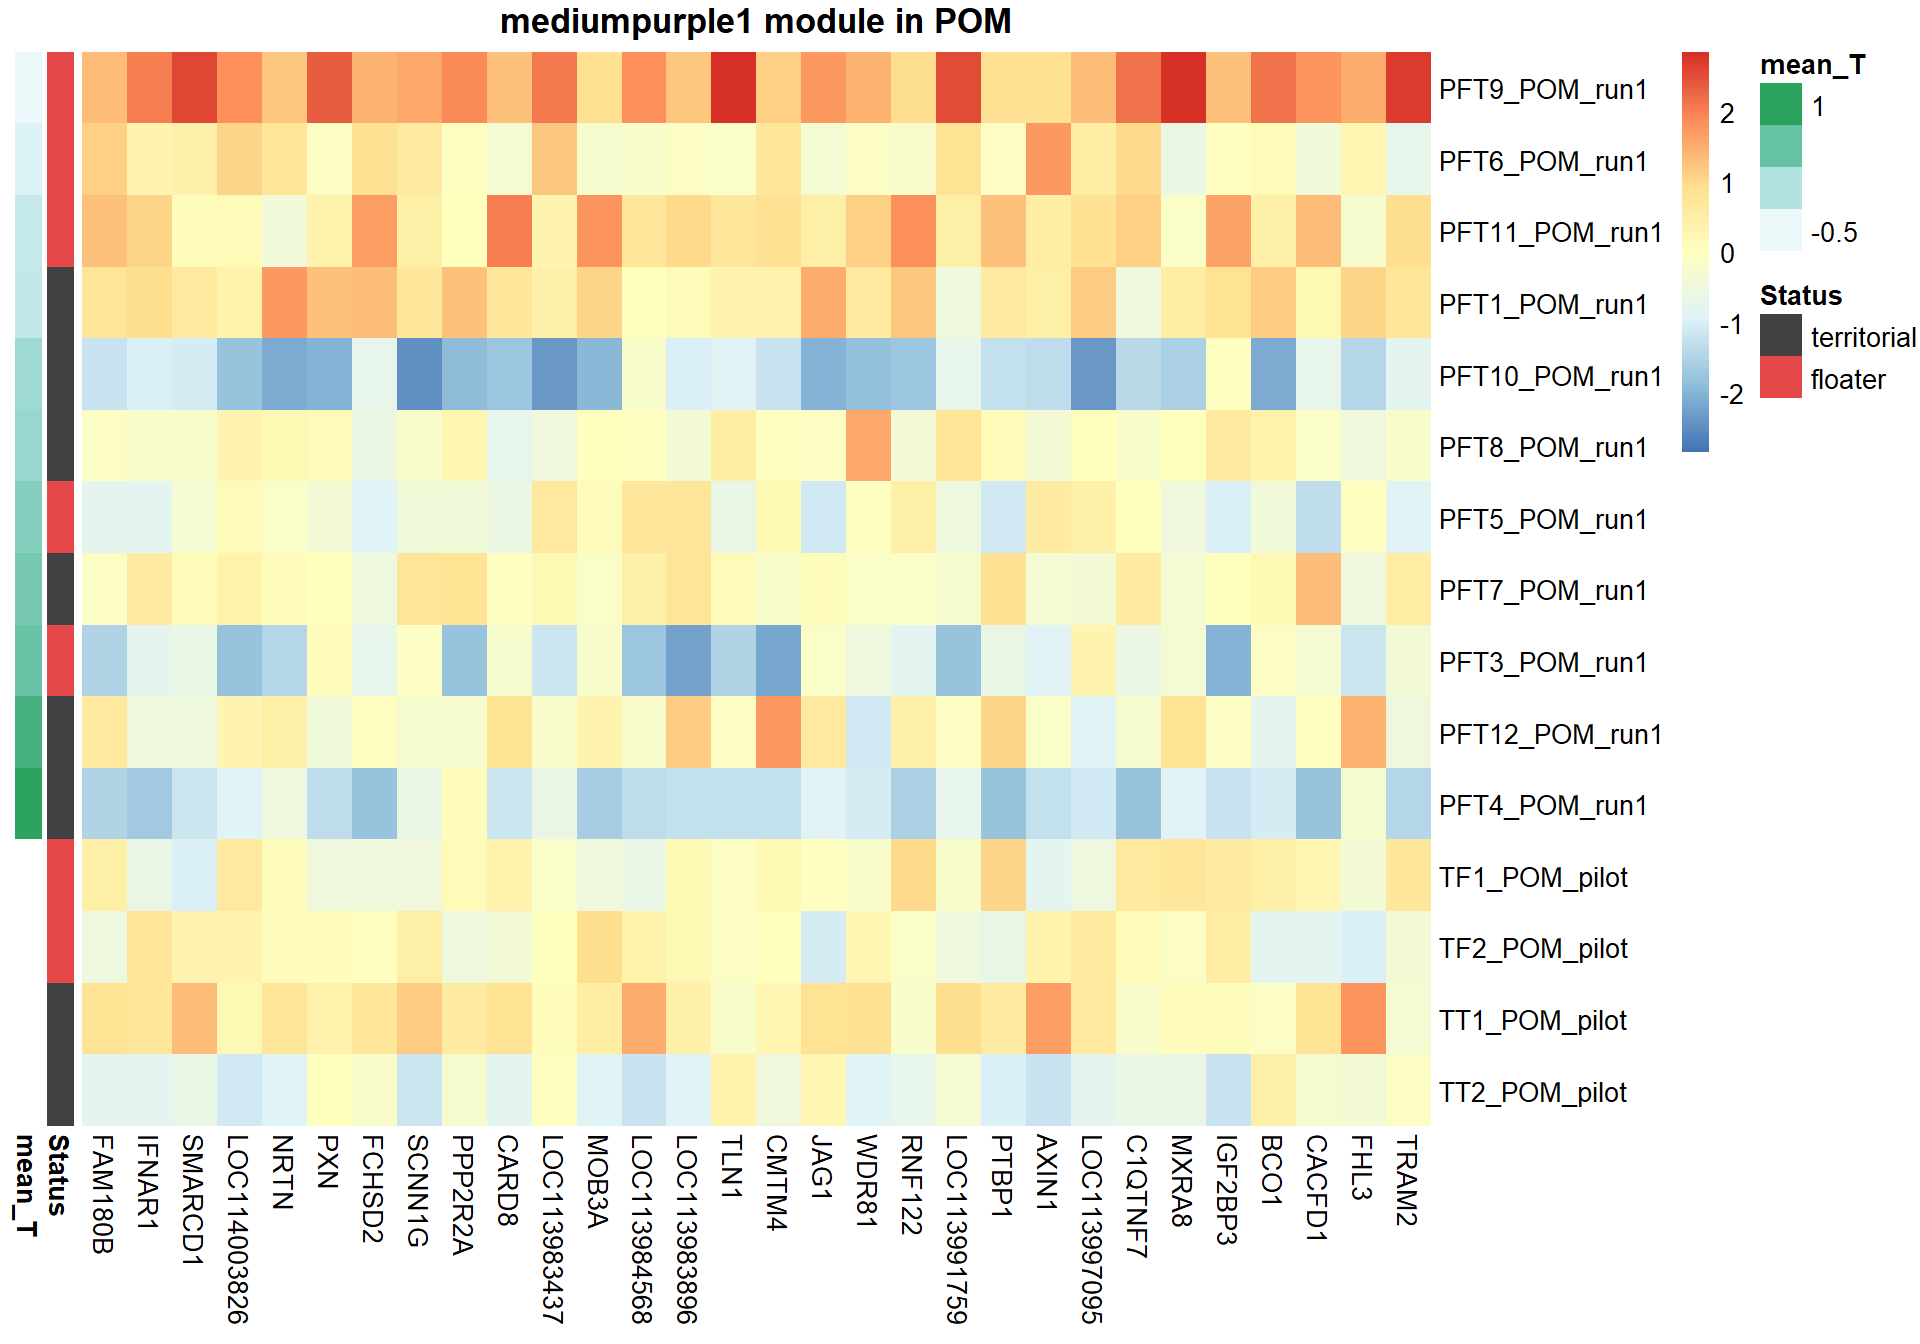
1.8.1.1 Top 30 hub genes
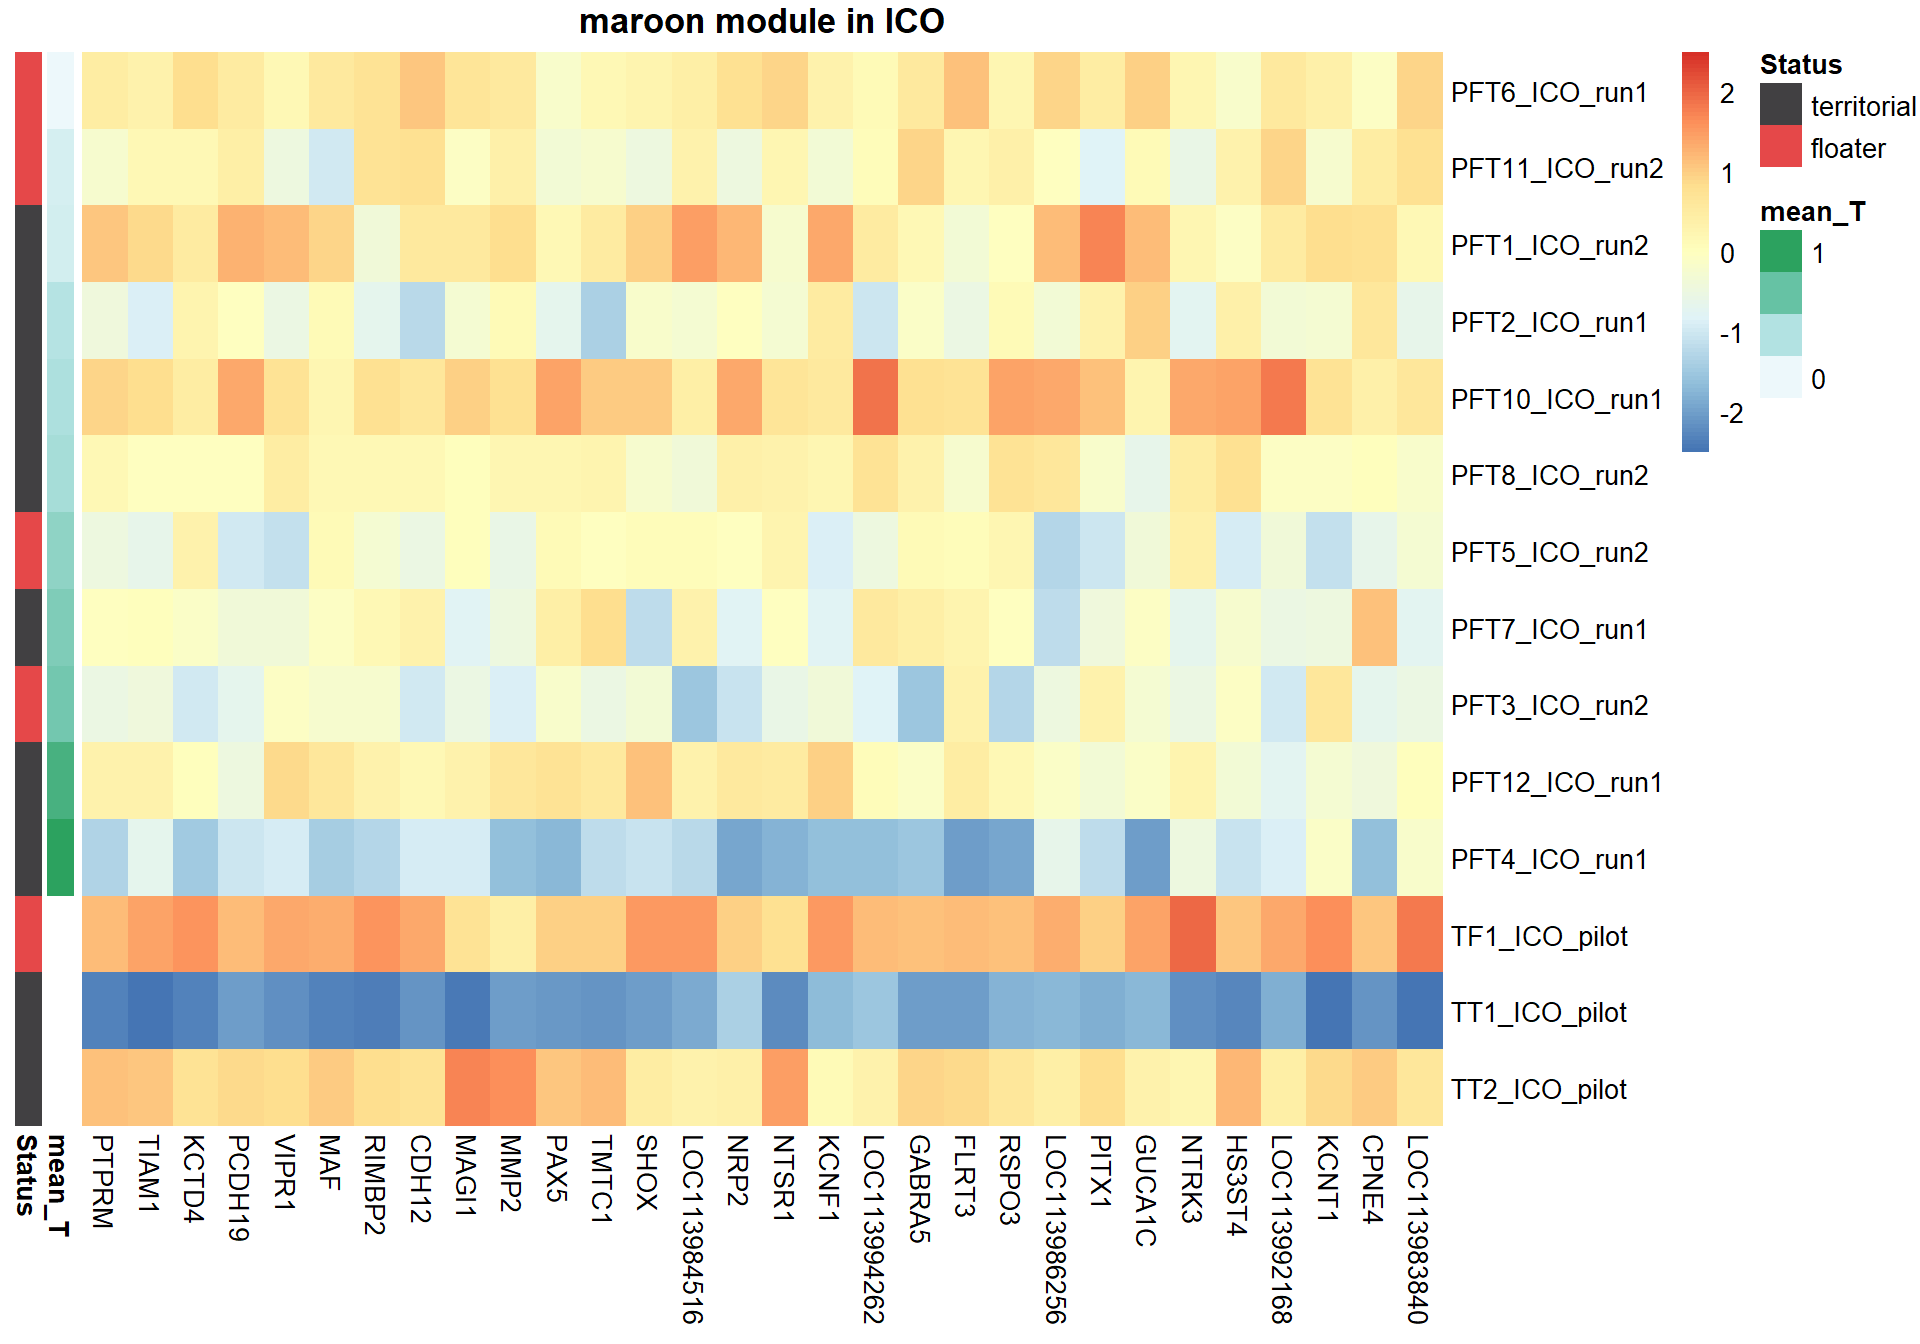
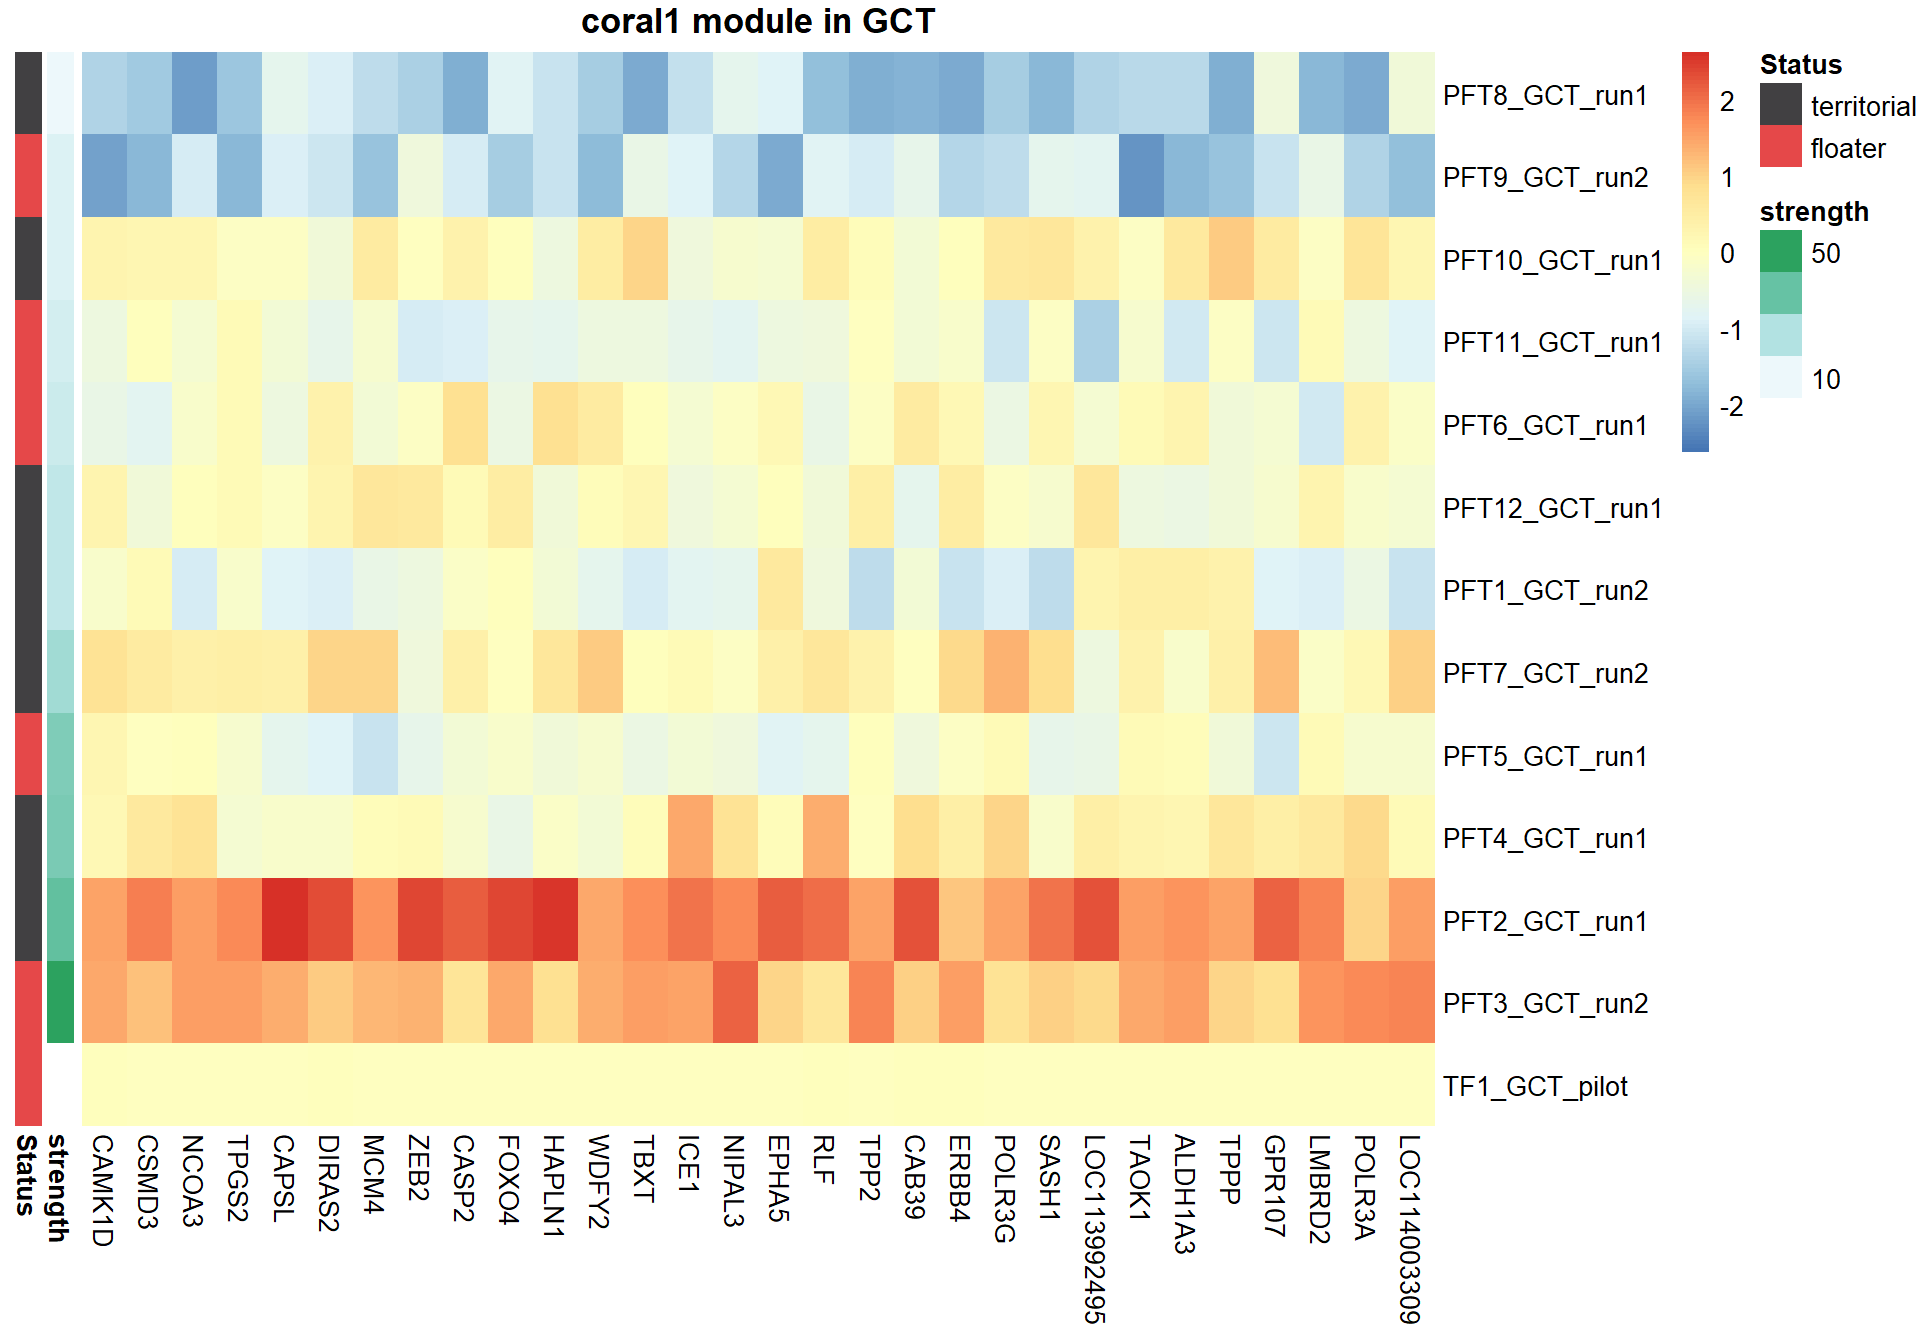
Next, I am going to explore the top 30 hub genes based on highest module membership
nTop<-30
#extract the expression of the top 30 genes and sort them based on module membership.
sorted=color$gene[order(color[,modcol],decreasing=T)]
hubs=sorted[1:nTop]
hubs=datExpr0[,match(hubs, colnames(datExpr0))]
### Sort individual data based on the trait value
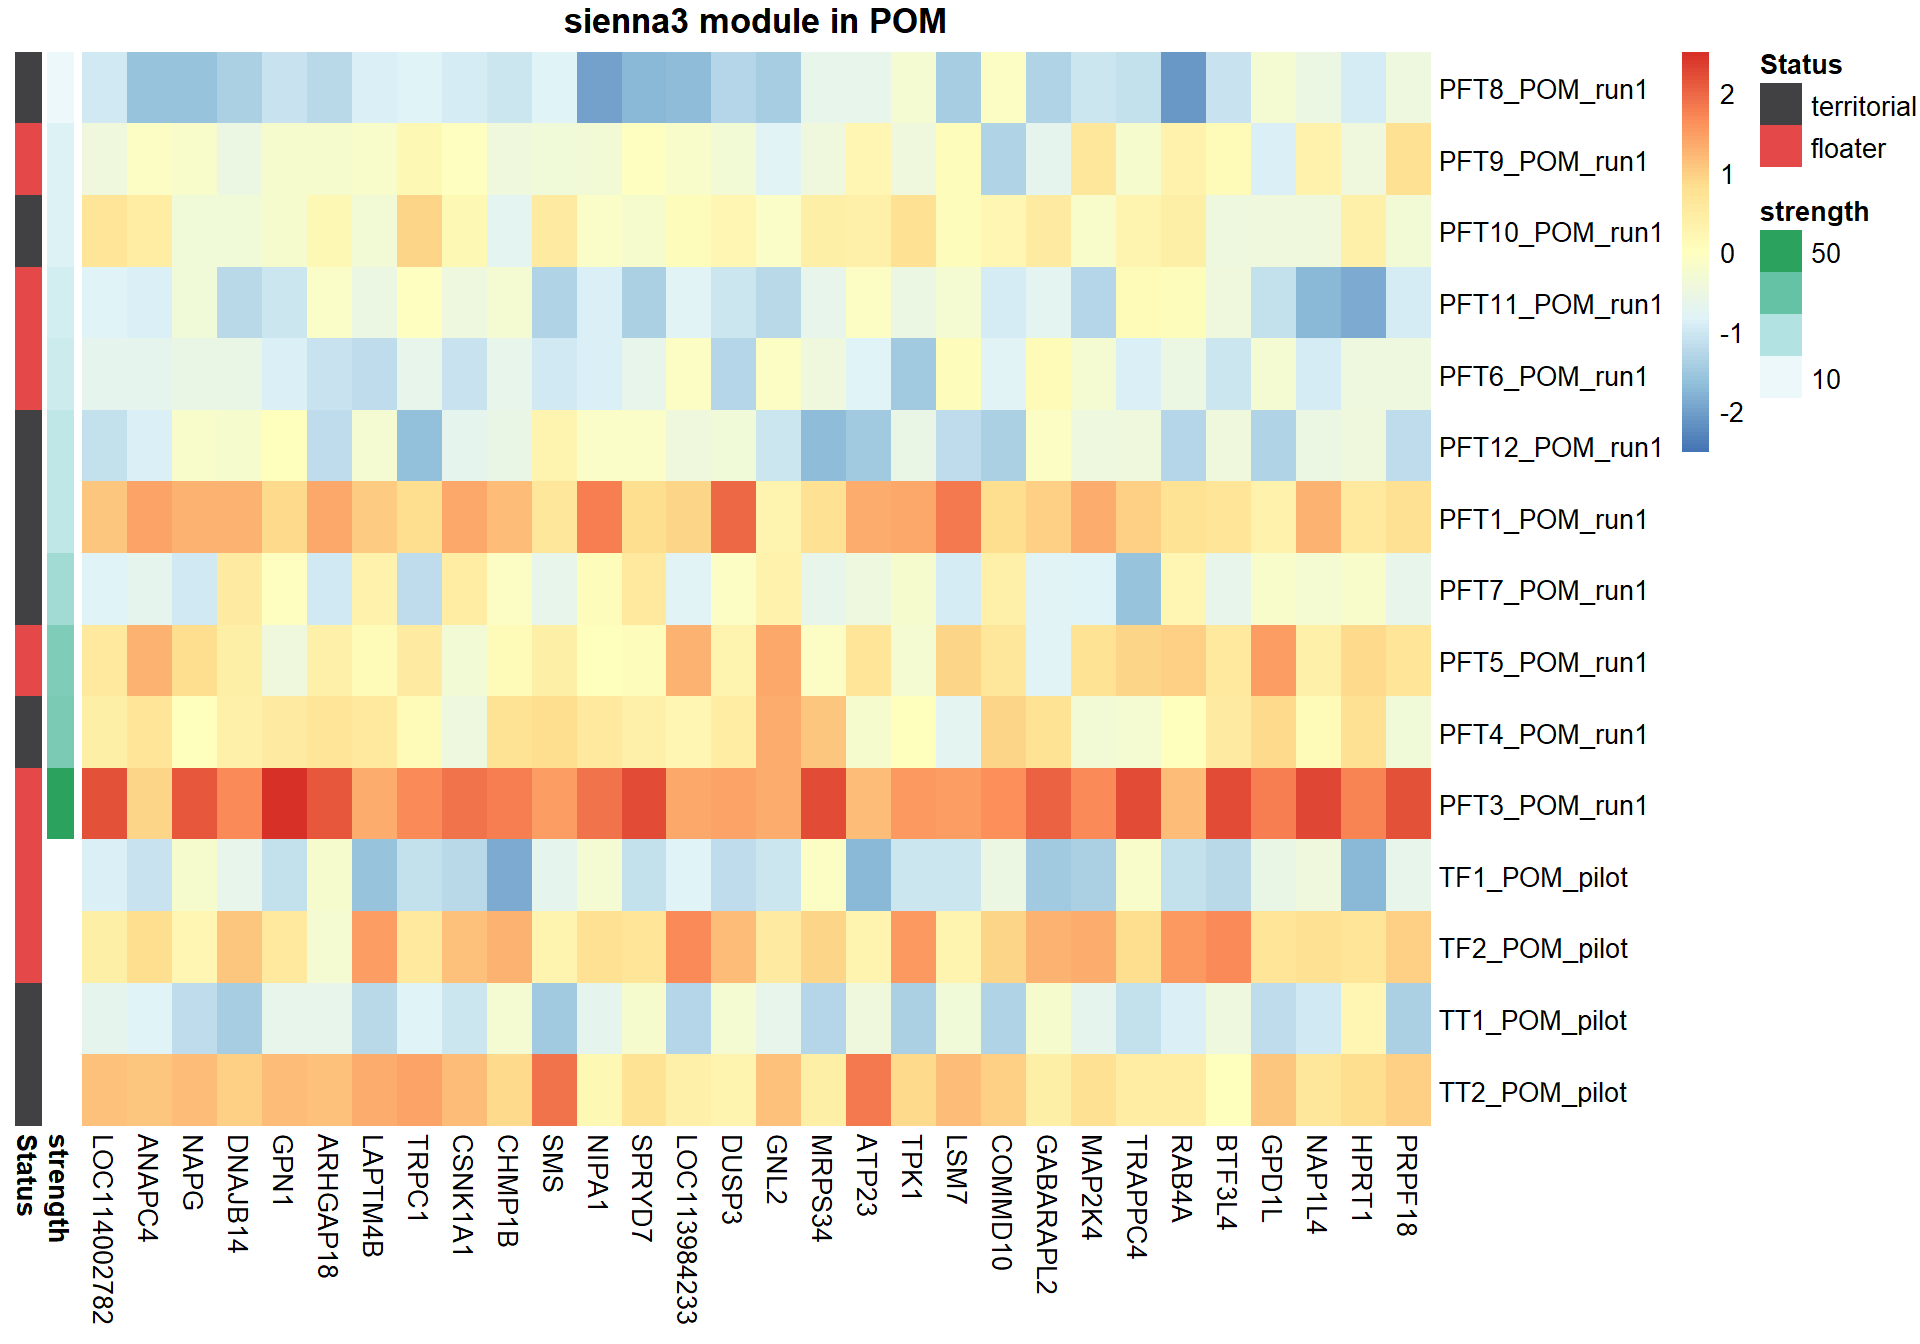
expDesign<- data.frame(row.names=rownames(gon_key), mean_T=gon_key[,"mean_T"], Status=gon_key[,"Status"])
expDesign<- expDesign[order(expDesign$mean_T),]
ann_cols<- list(Status=c(territorial="#414042",floater="#E54849"))
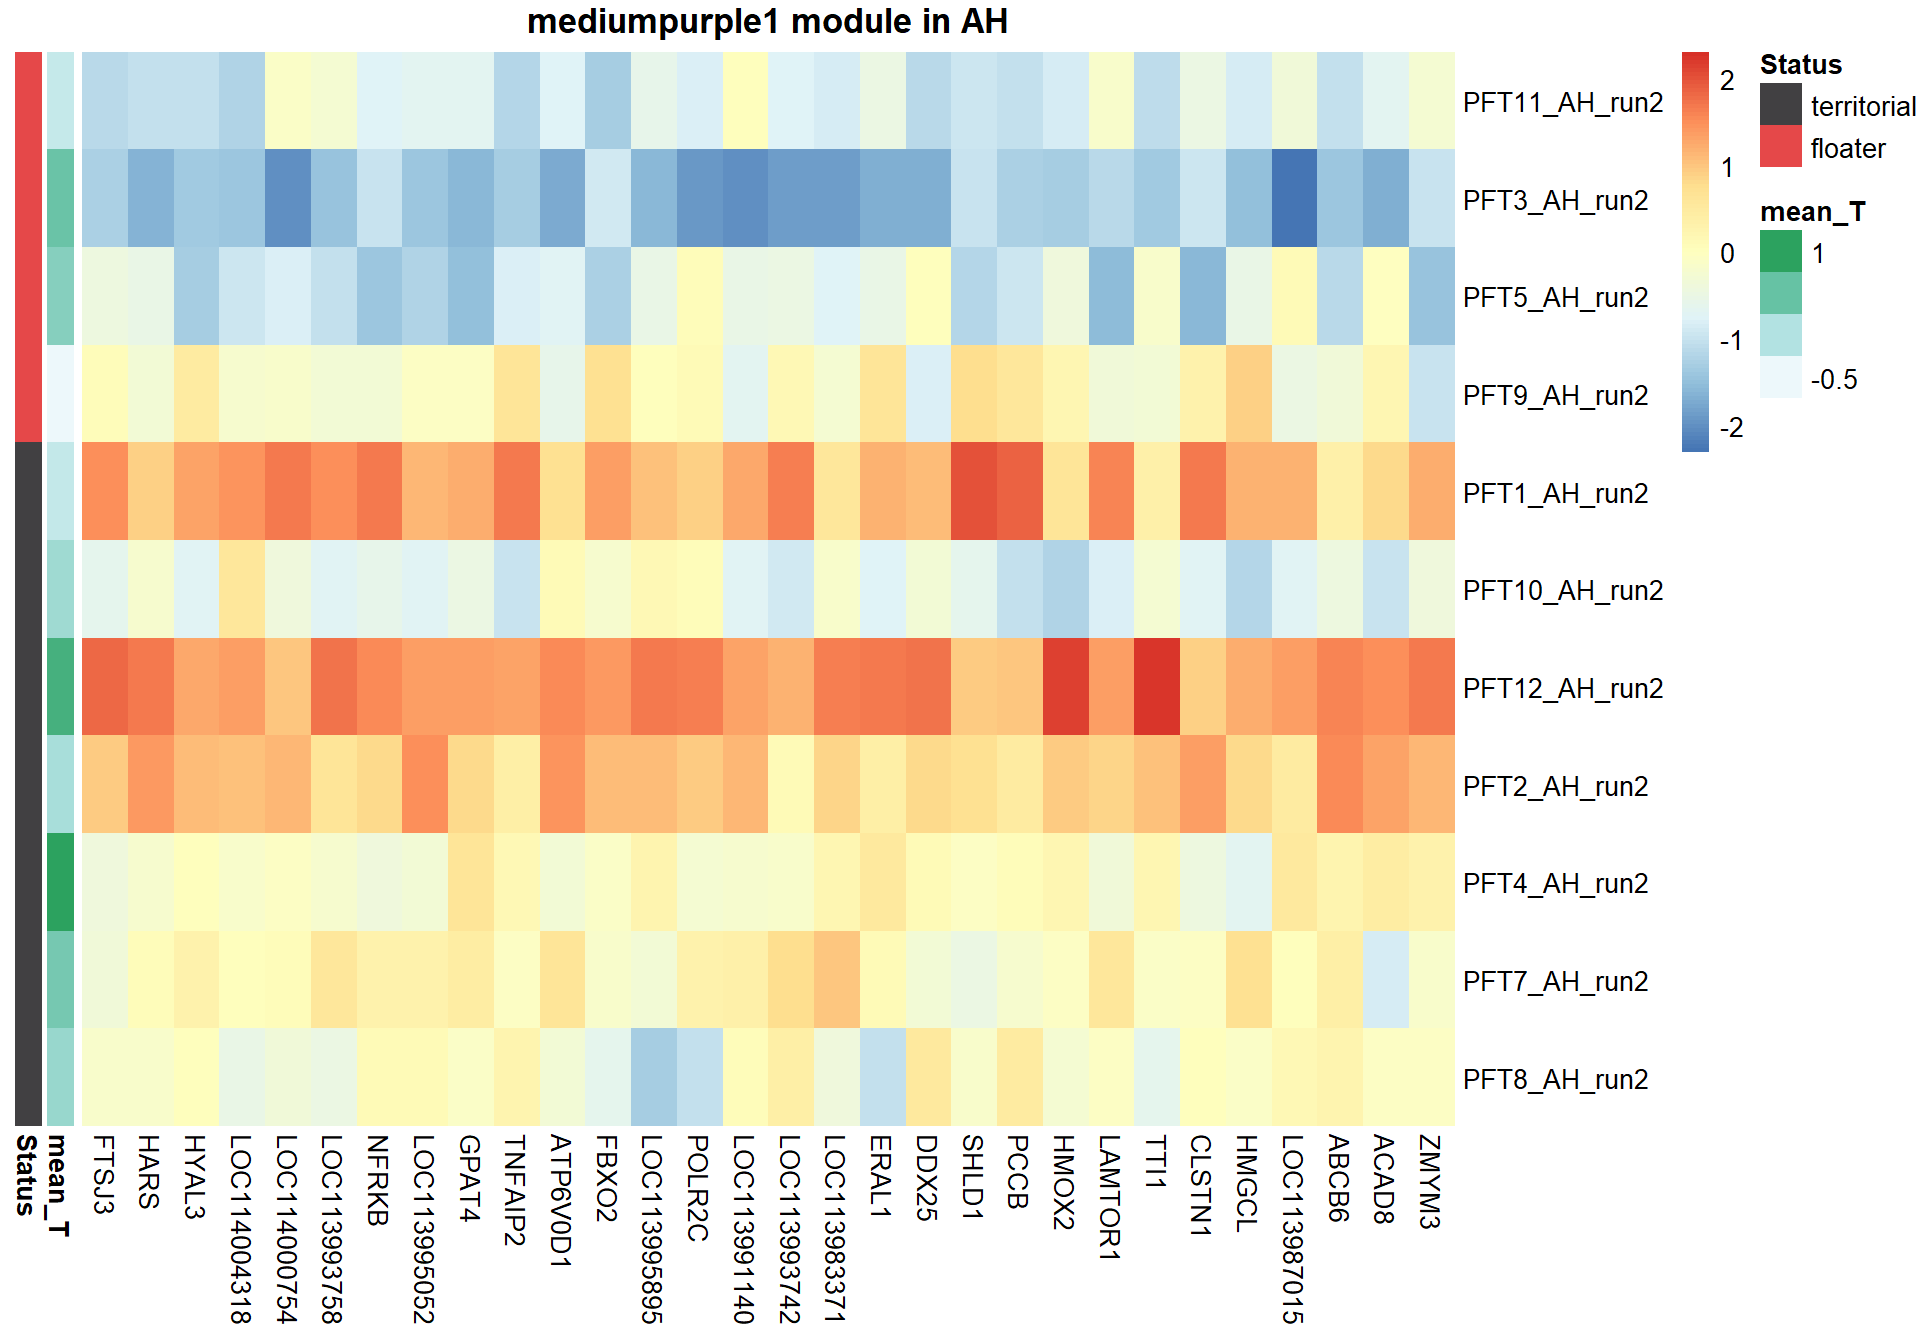
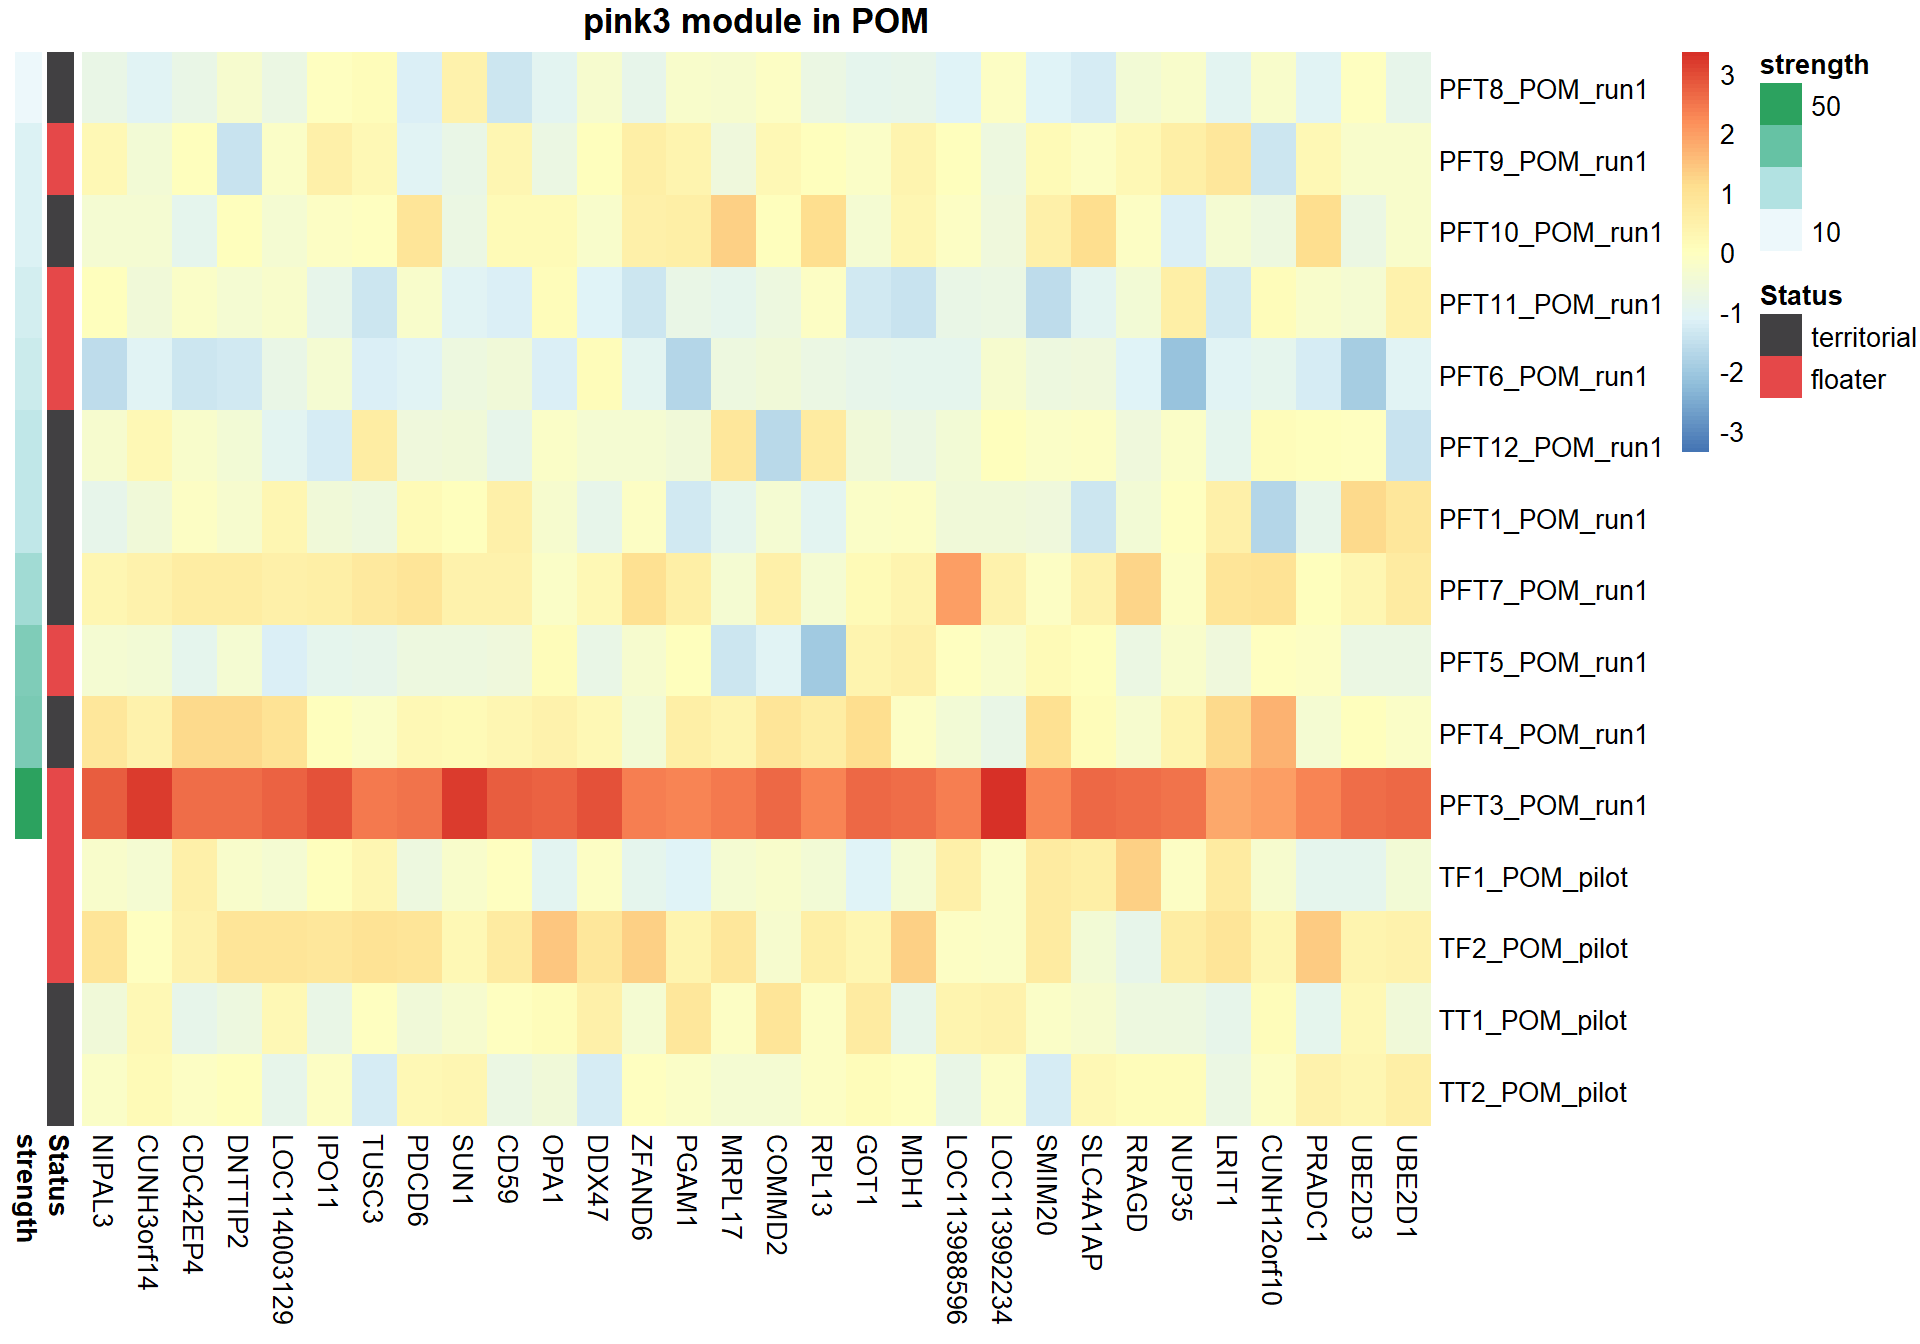
hubs<- hubs[match(rownames(expDesign), rownames(hubs)), ]
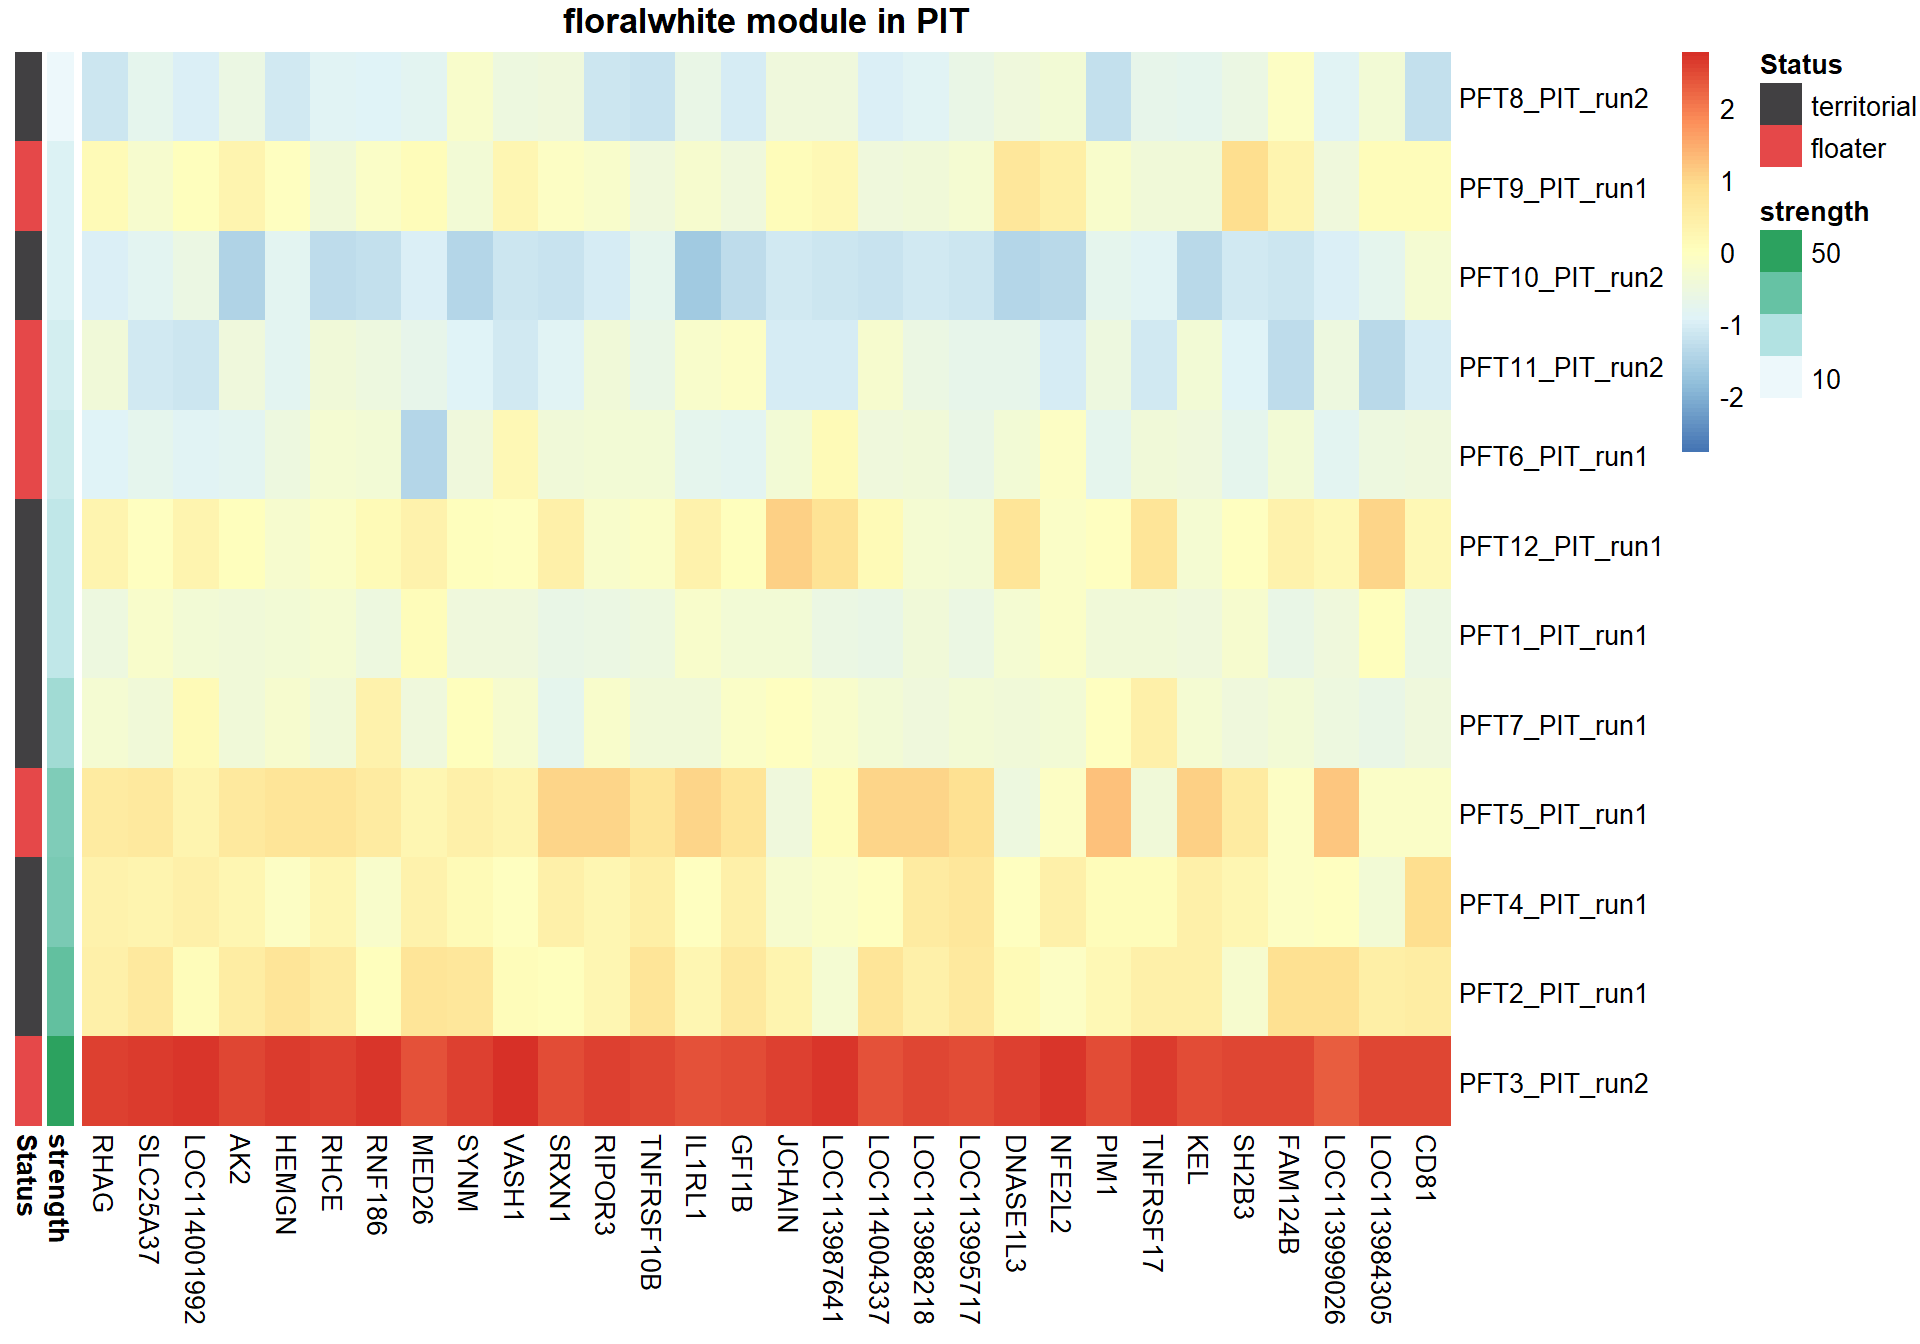
#plot heatmap
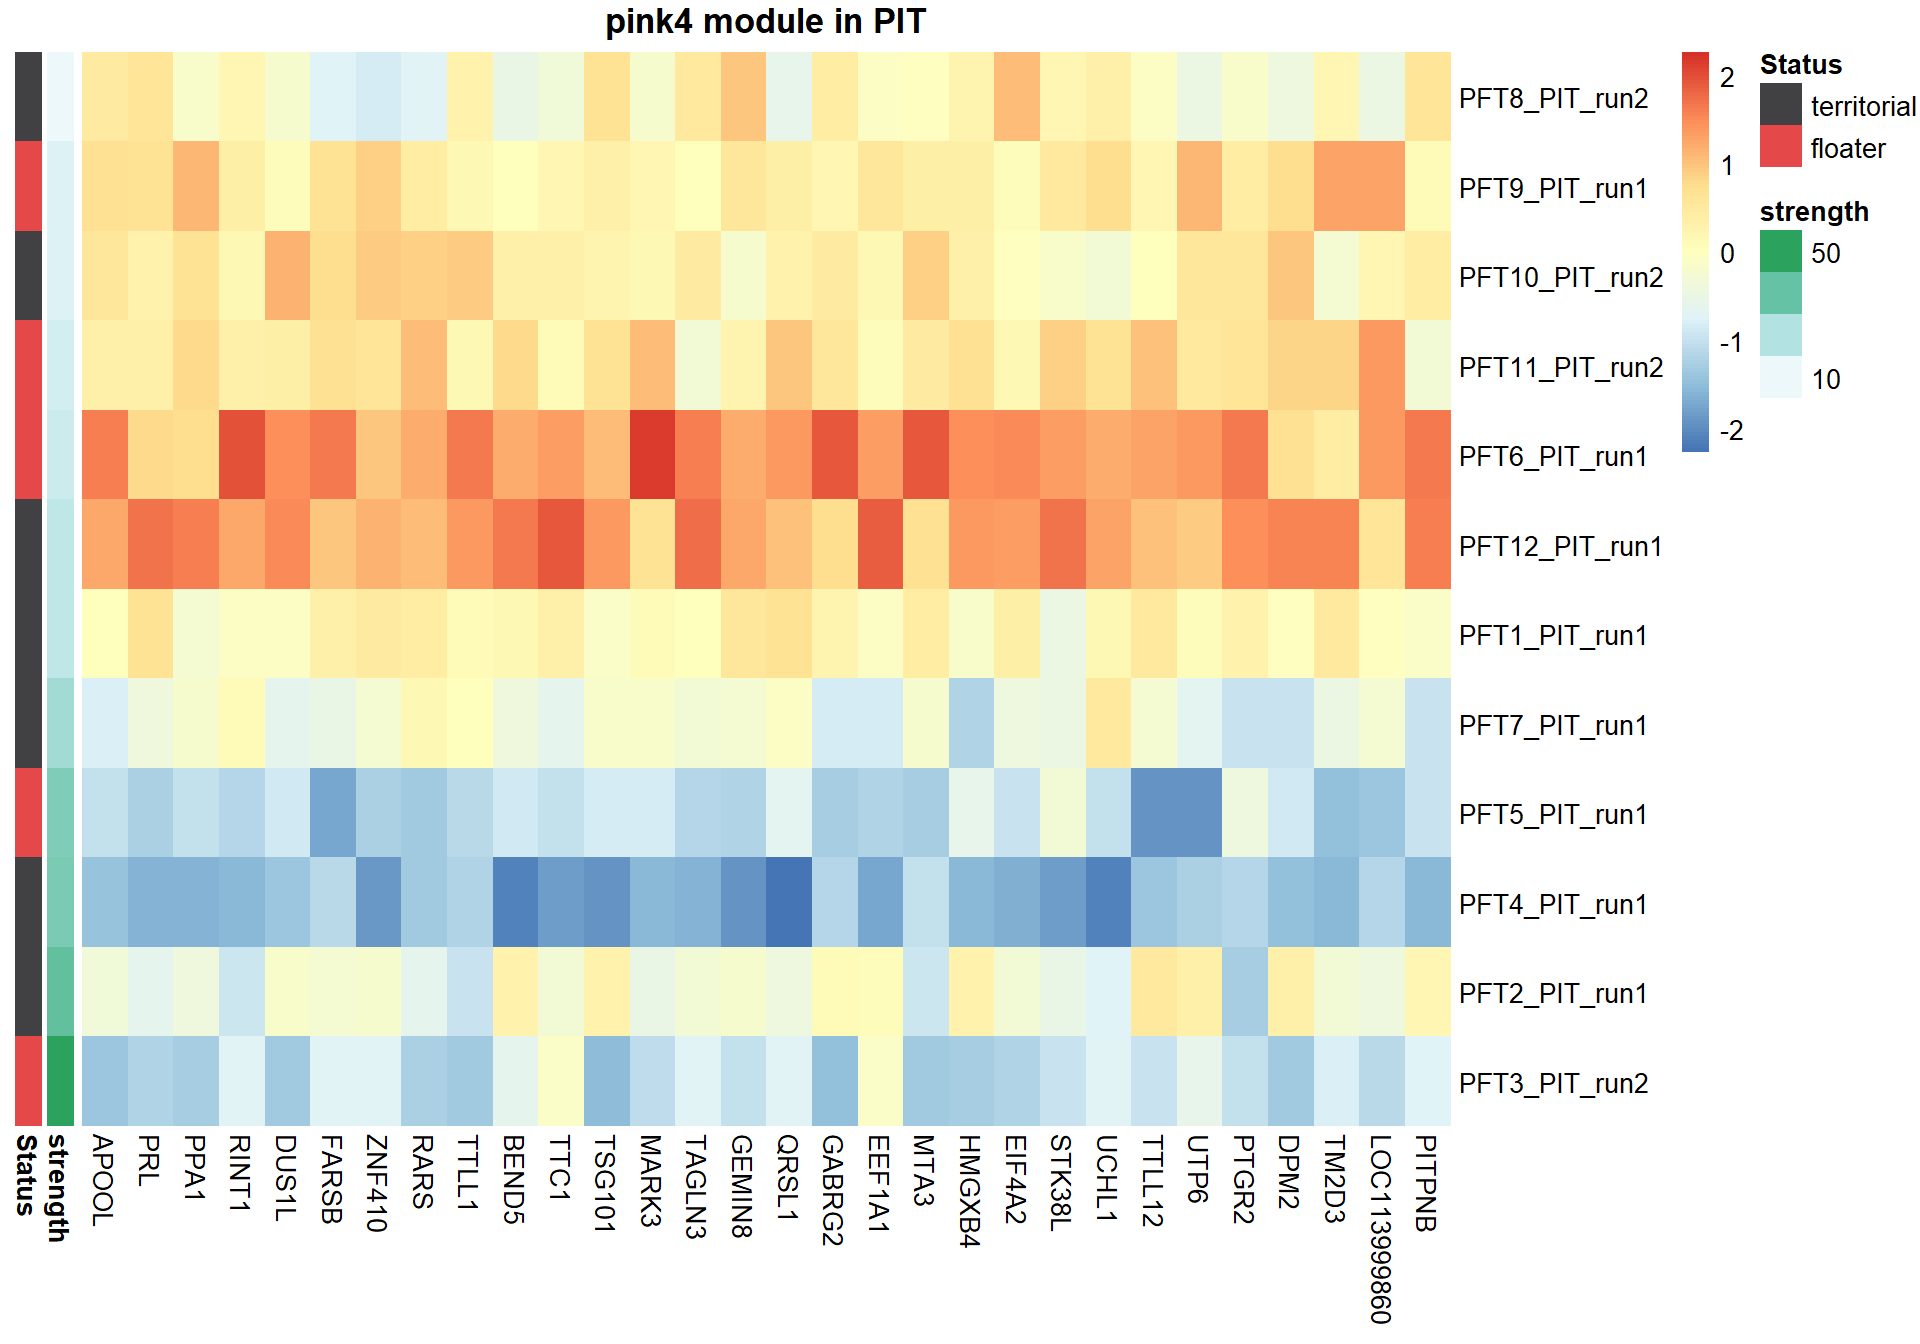
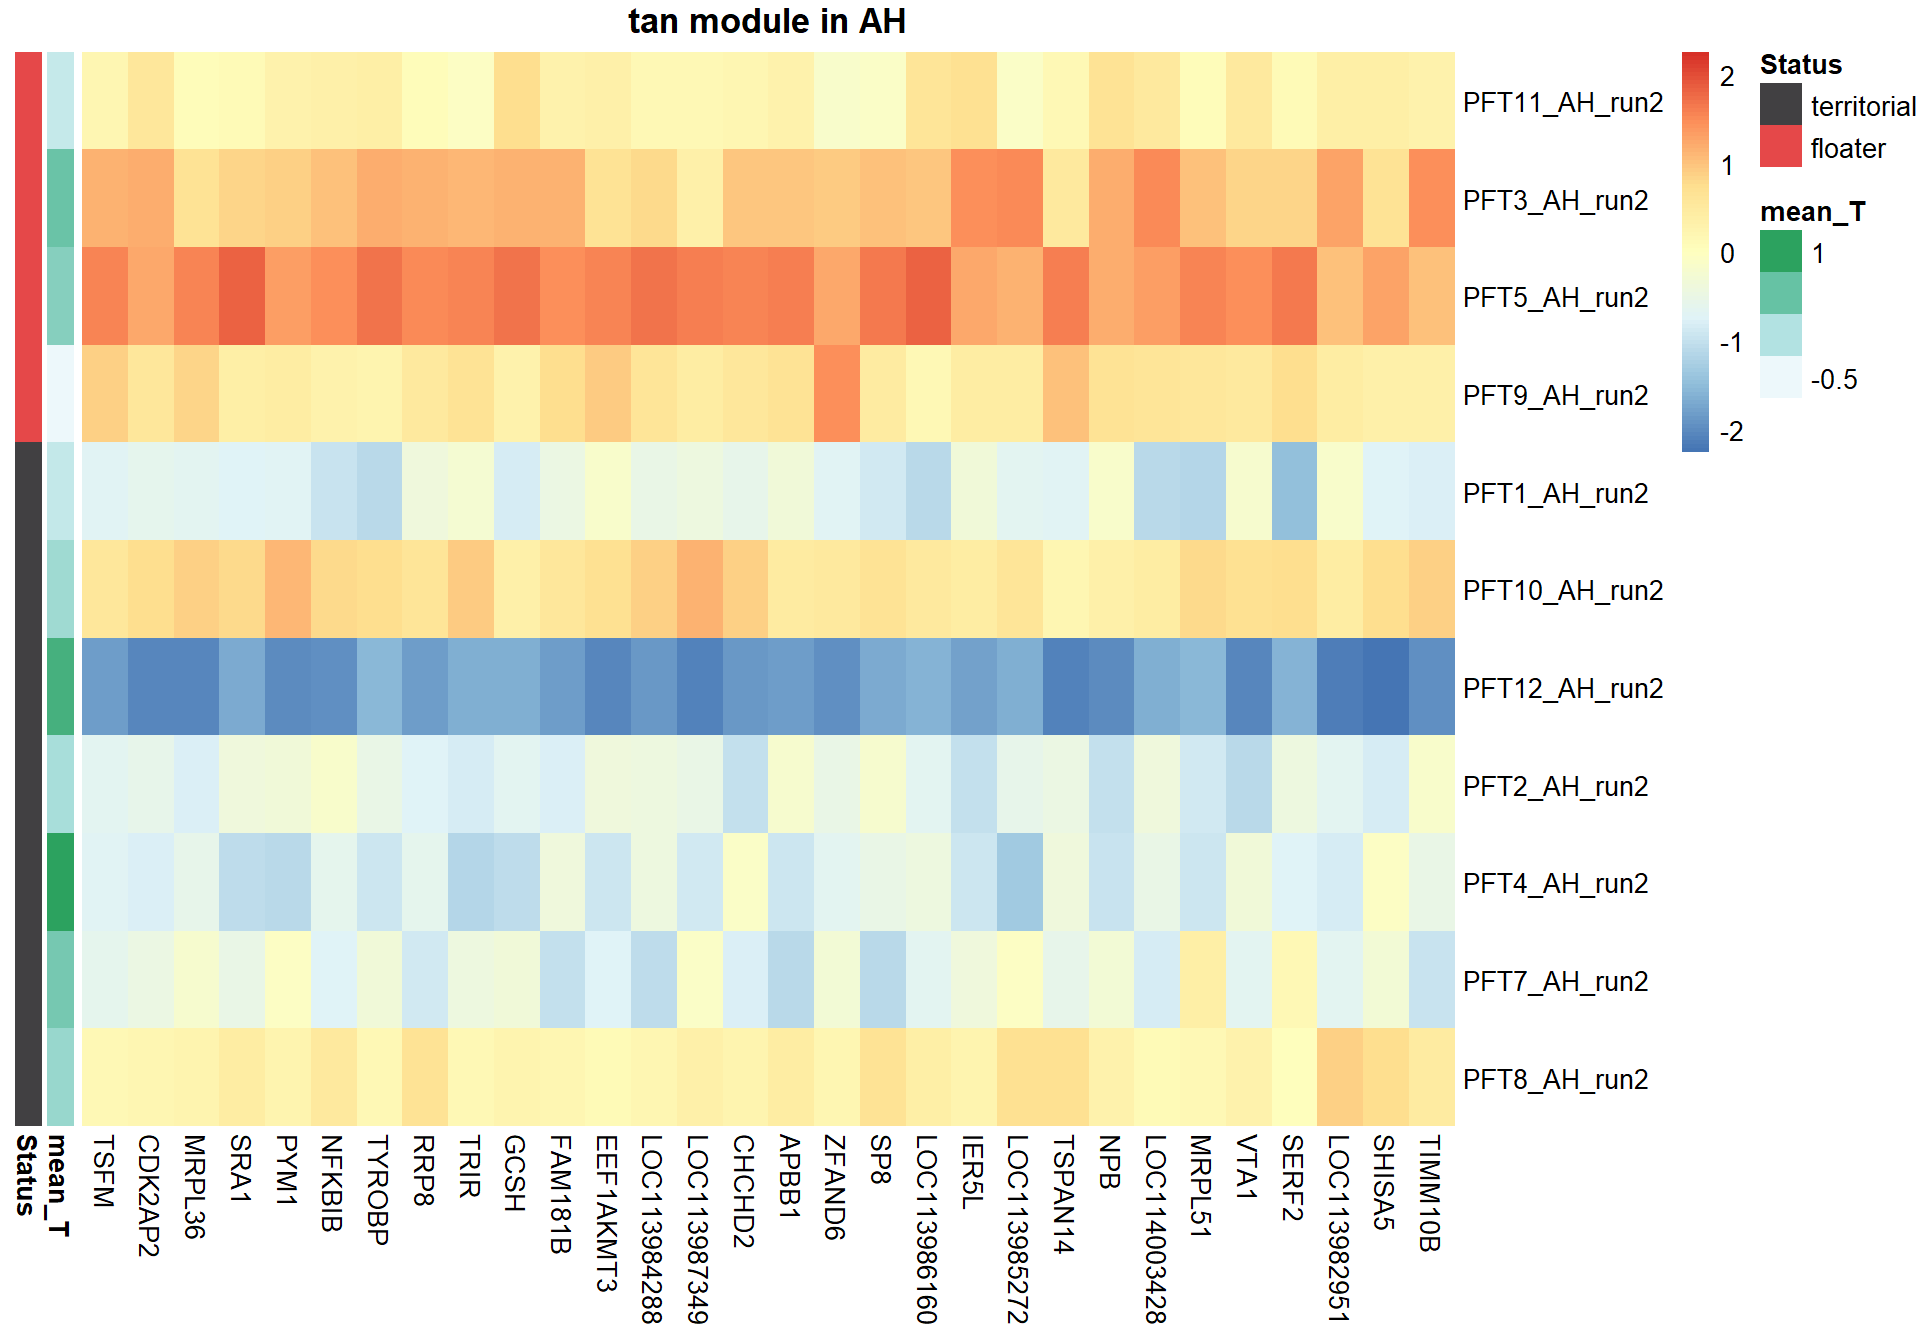
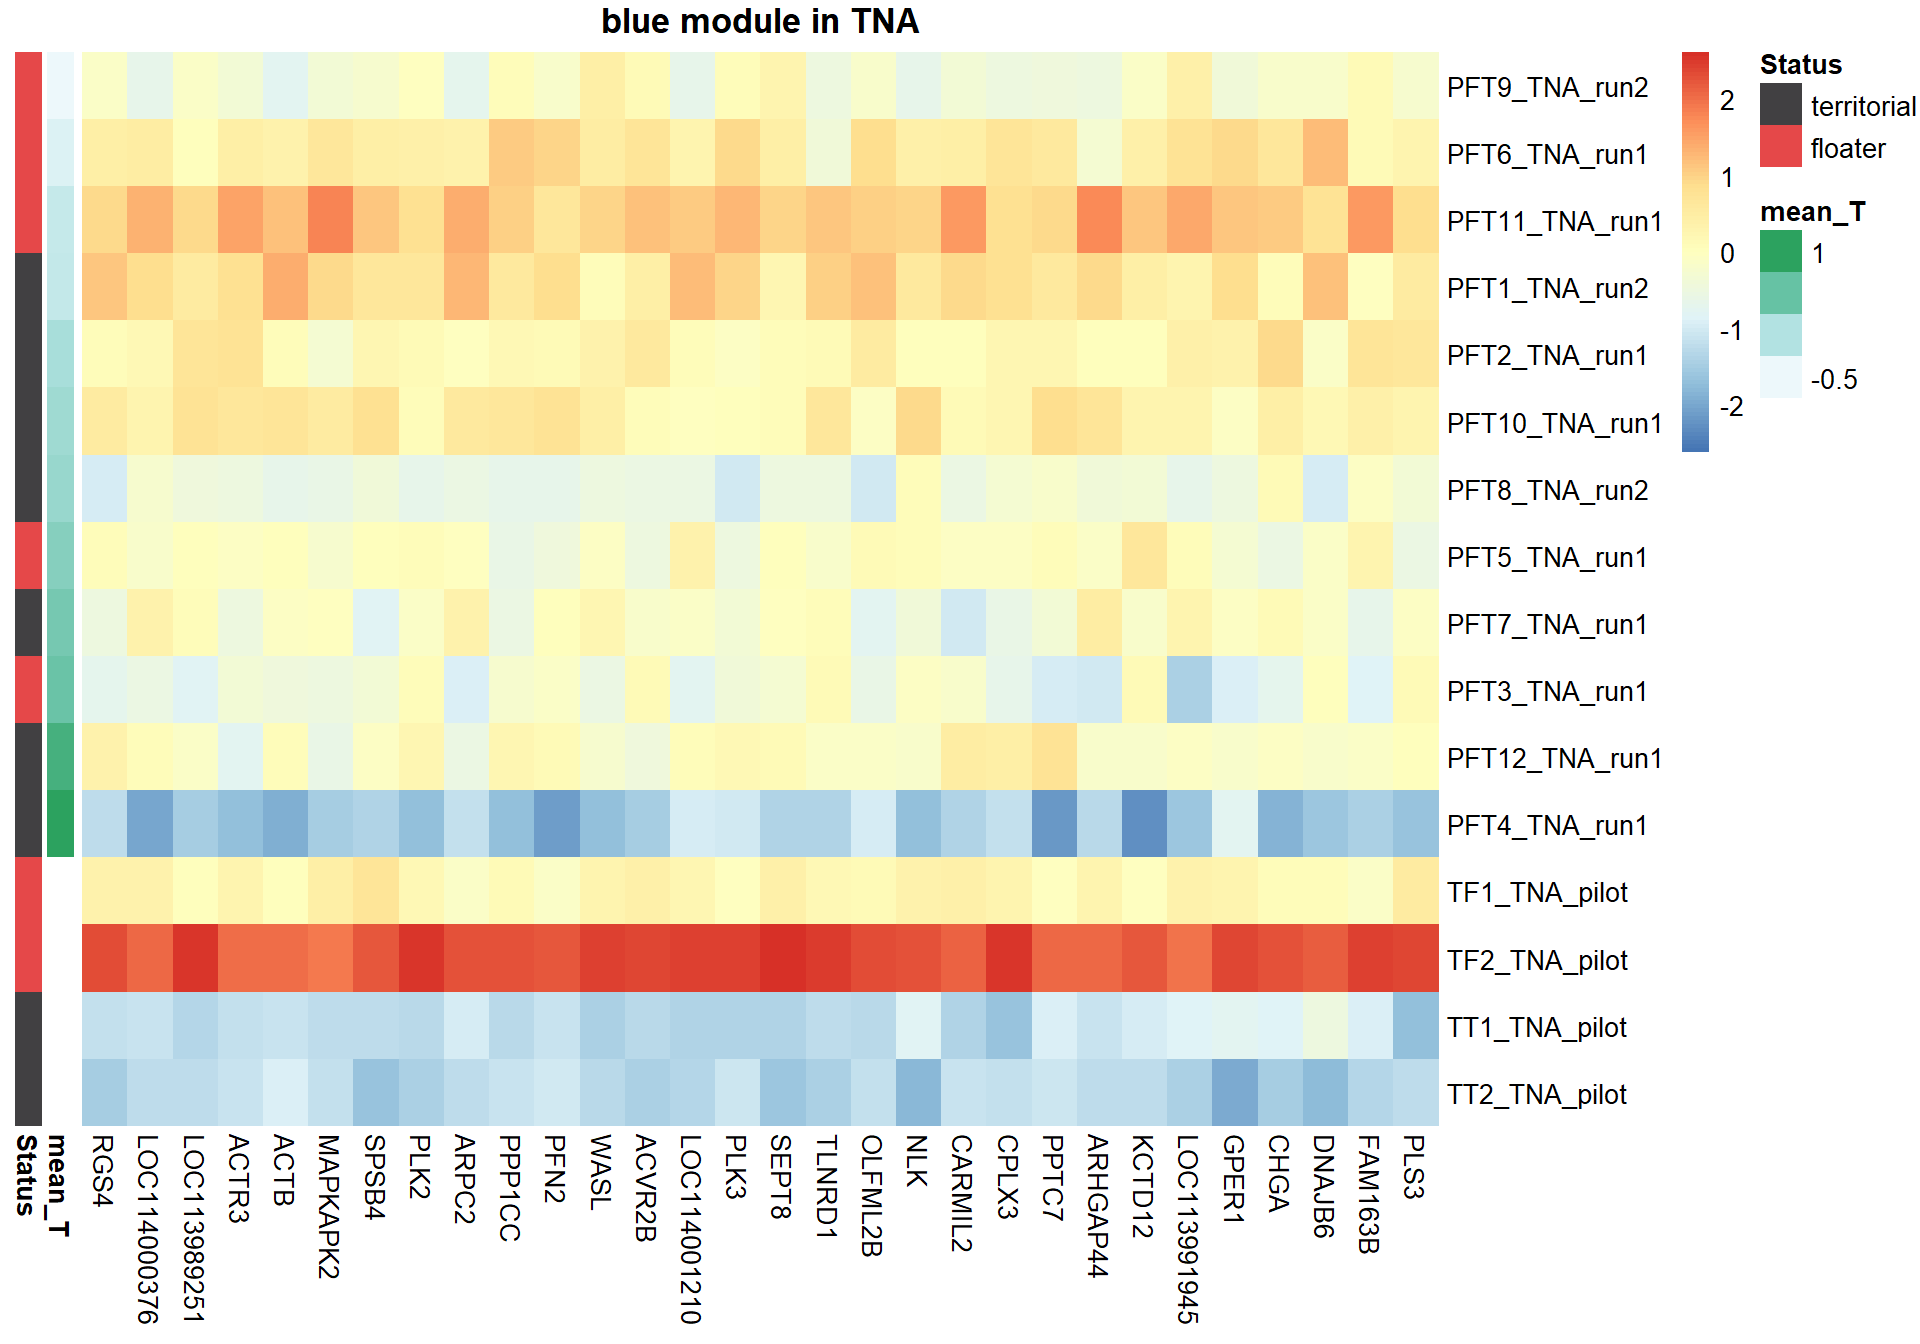
pheatmap(hubs,scale="column", cluster_rows = FALSE,cluster_cols = FALSE,show_rownames = TRUE, show_colnames = TRUE,border_color=NA, main=paste(whichModule,"module in",tissue), annotation_row=expDesign, annotation_colors=ann_cols)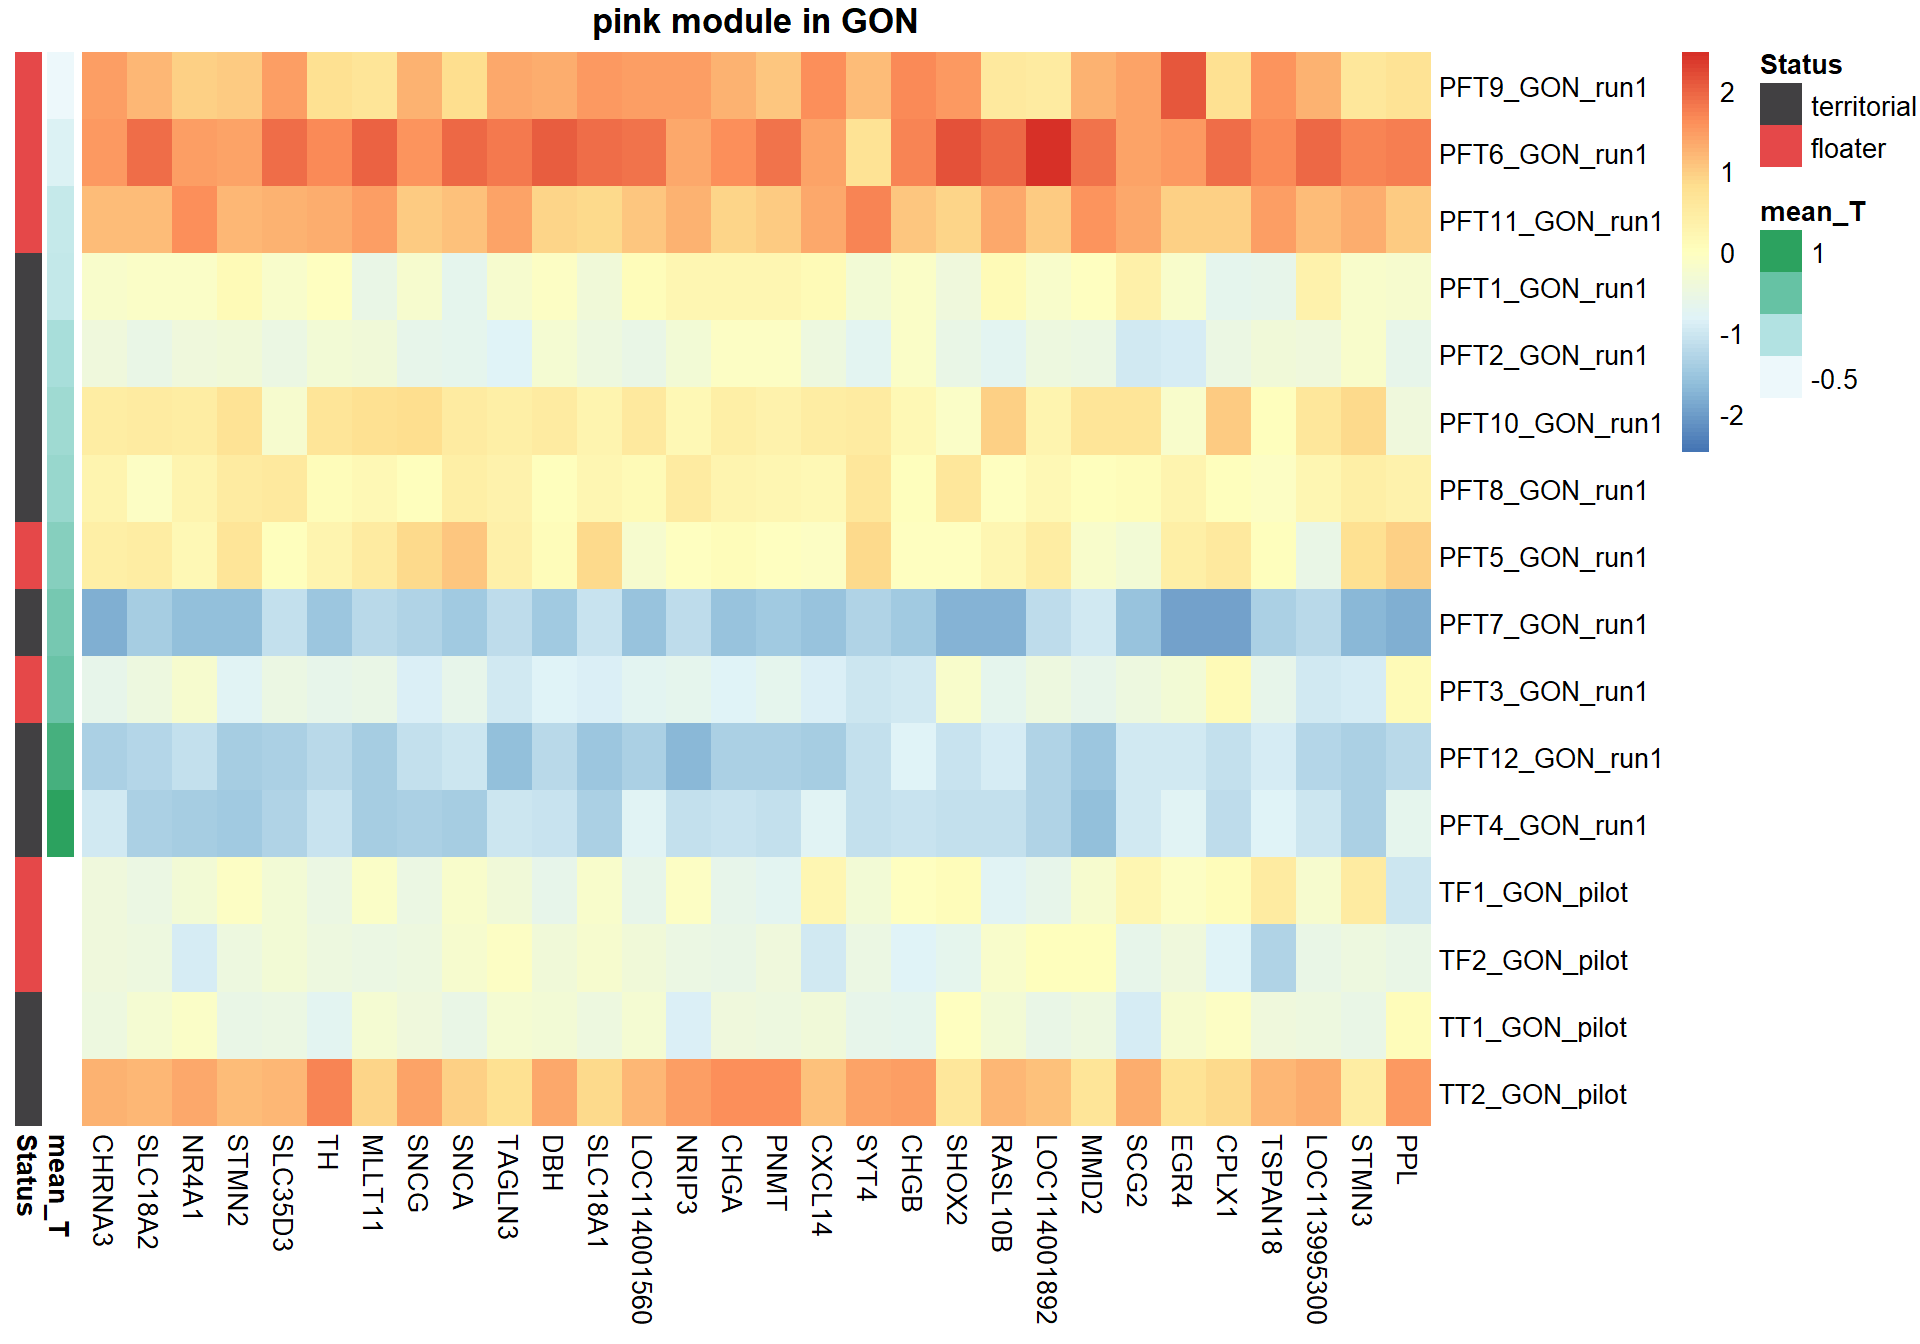
Now, let’s plot the top gene in this module to see its relationship with mean testosterone
gone<- plotCounts(dd, gene="CHRNA3", intgroup=c("mean_T", "Class"), returnData=TRUE)
ggplot(gone, aes(x=mean_T, y=count)) + geom_point(size=2) + labs(title="CHRNA3 in GON",x="mean T", y="Normalised Counts") + peri_theme
## Warning: Removed 4 rows containing missing values
## (`geom_point()`).
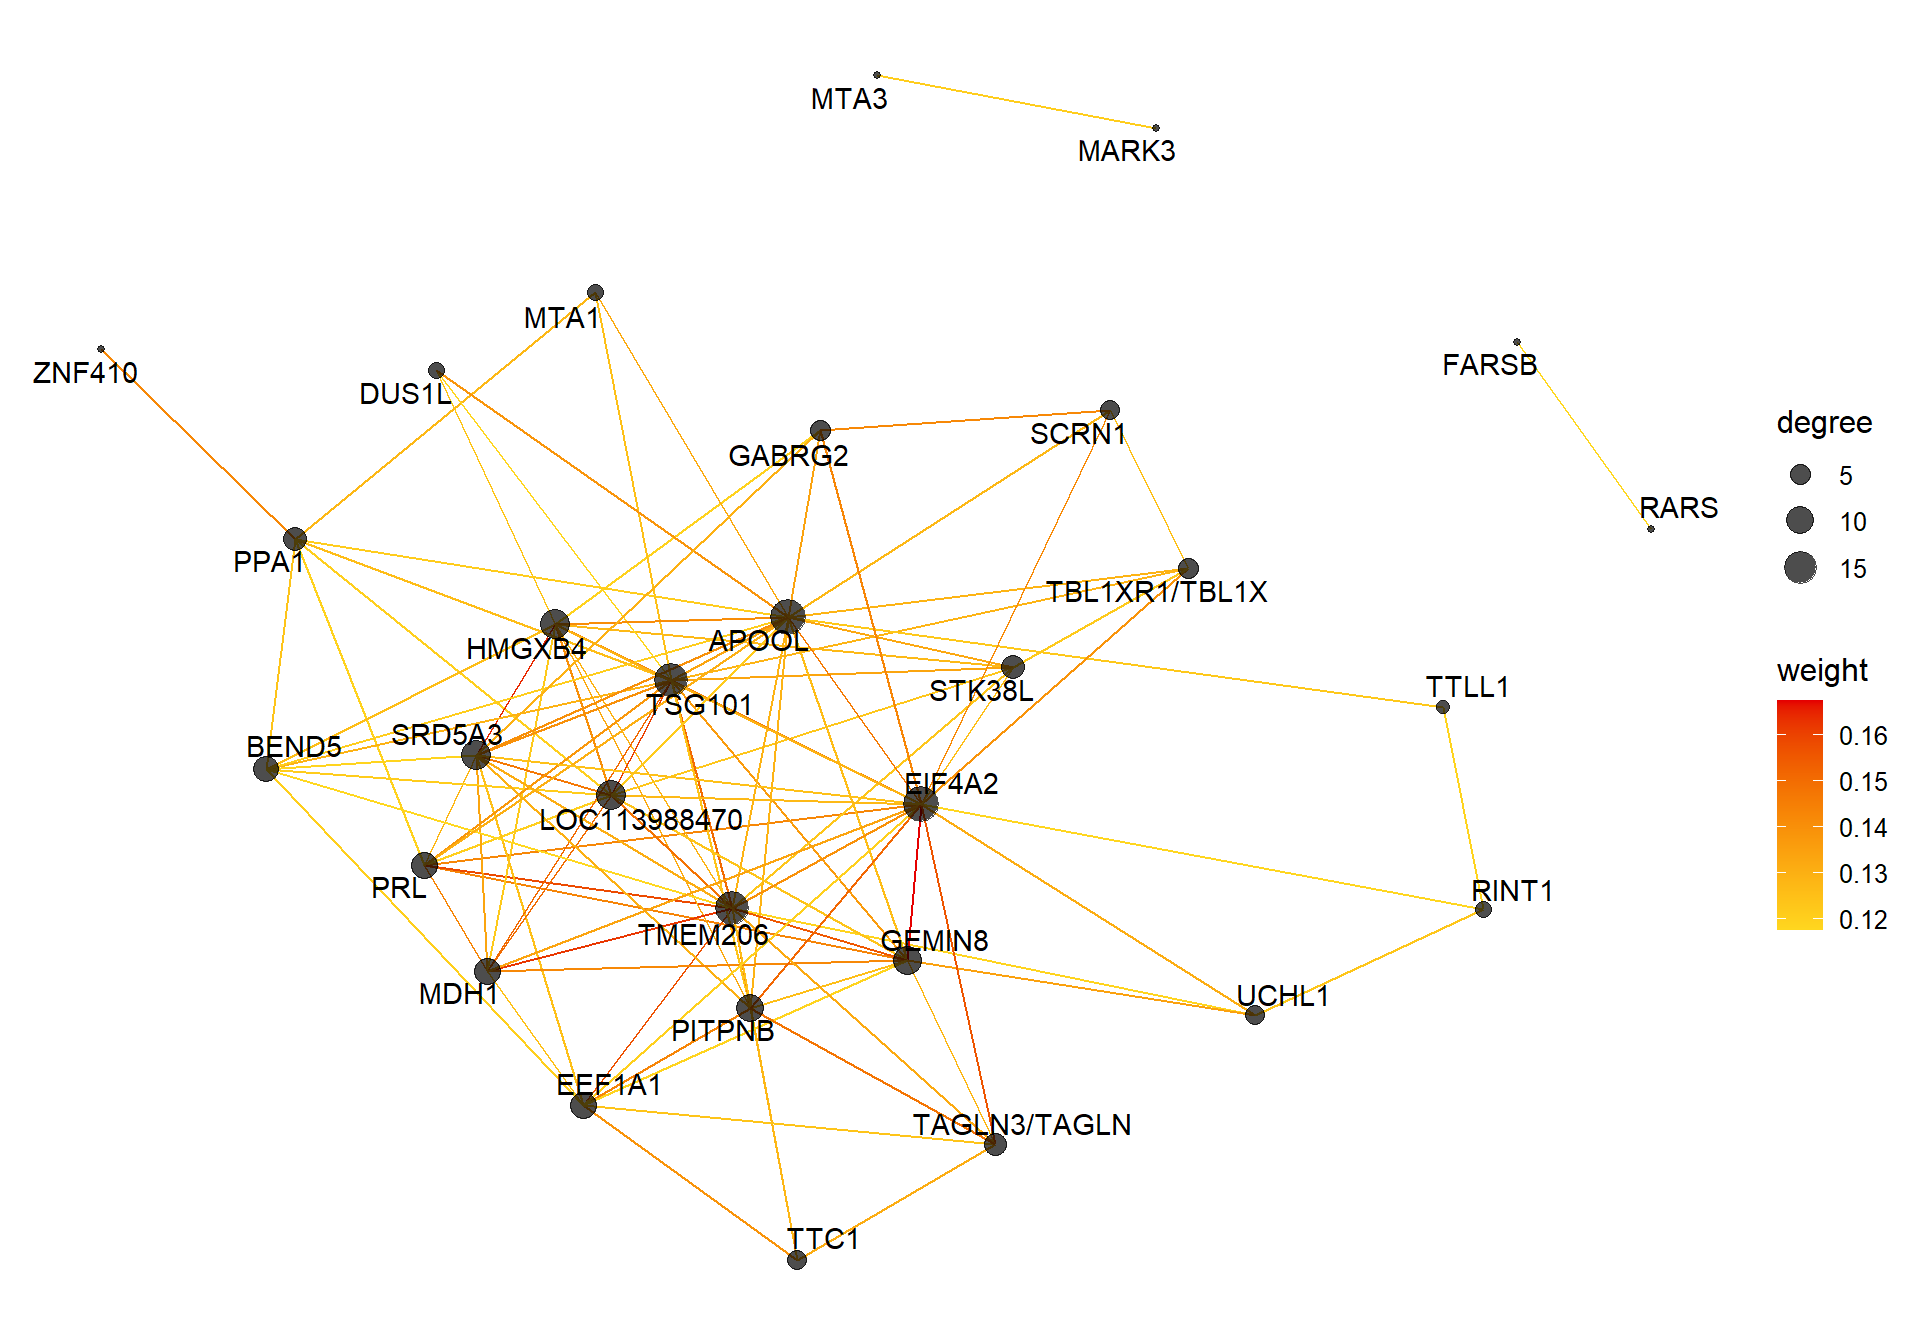
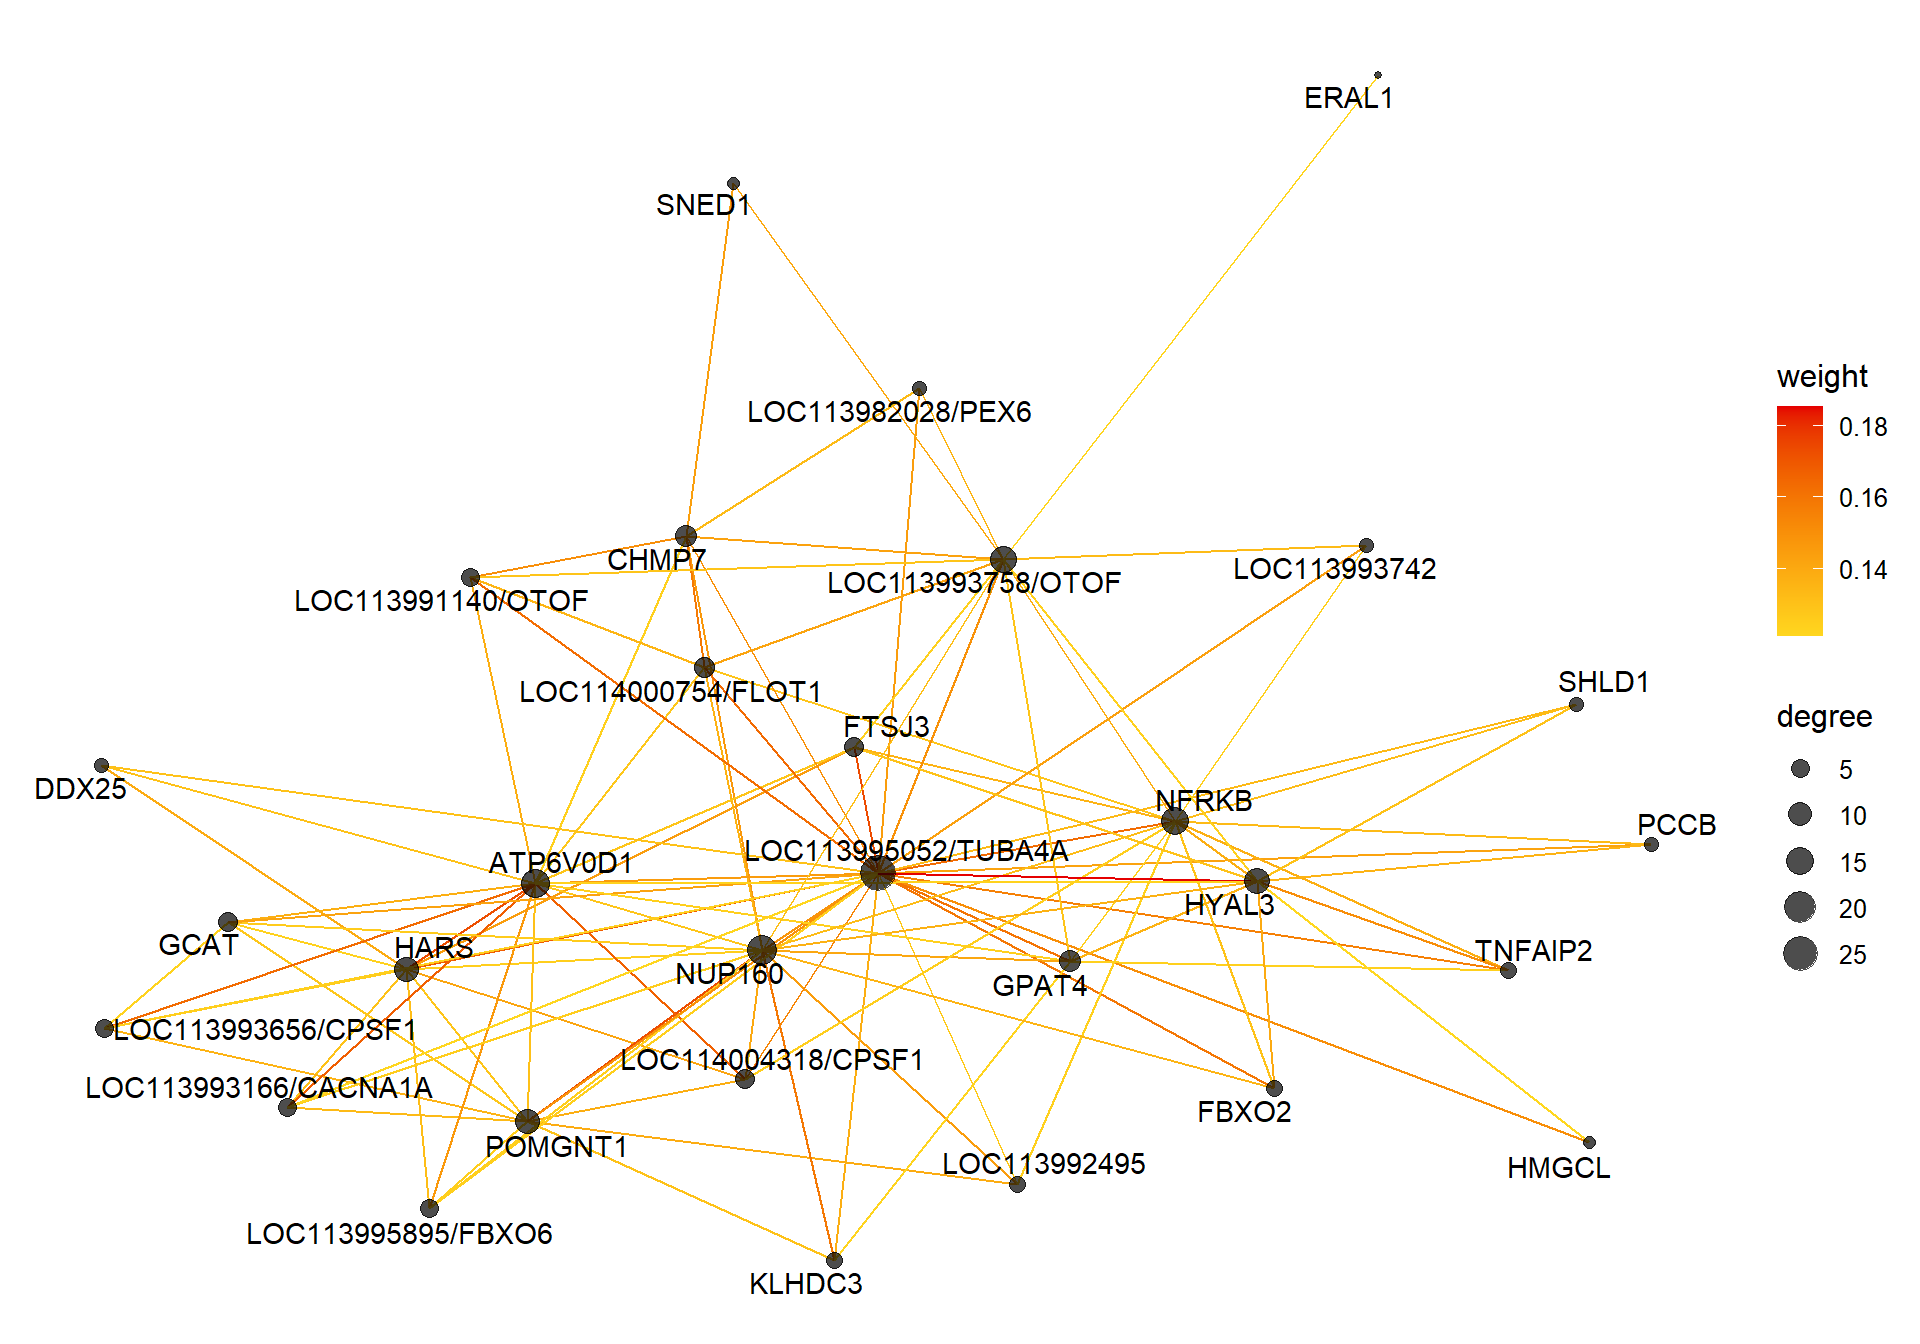
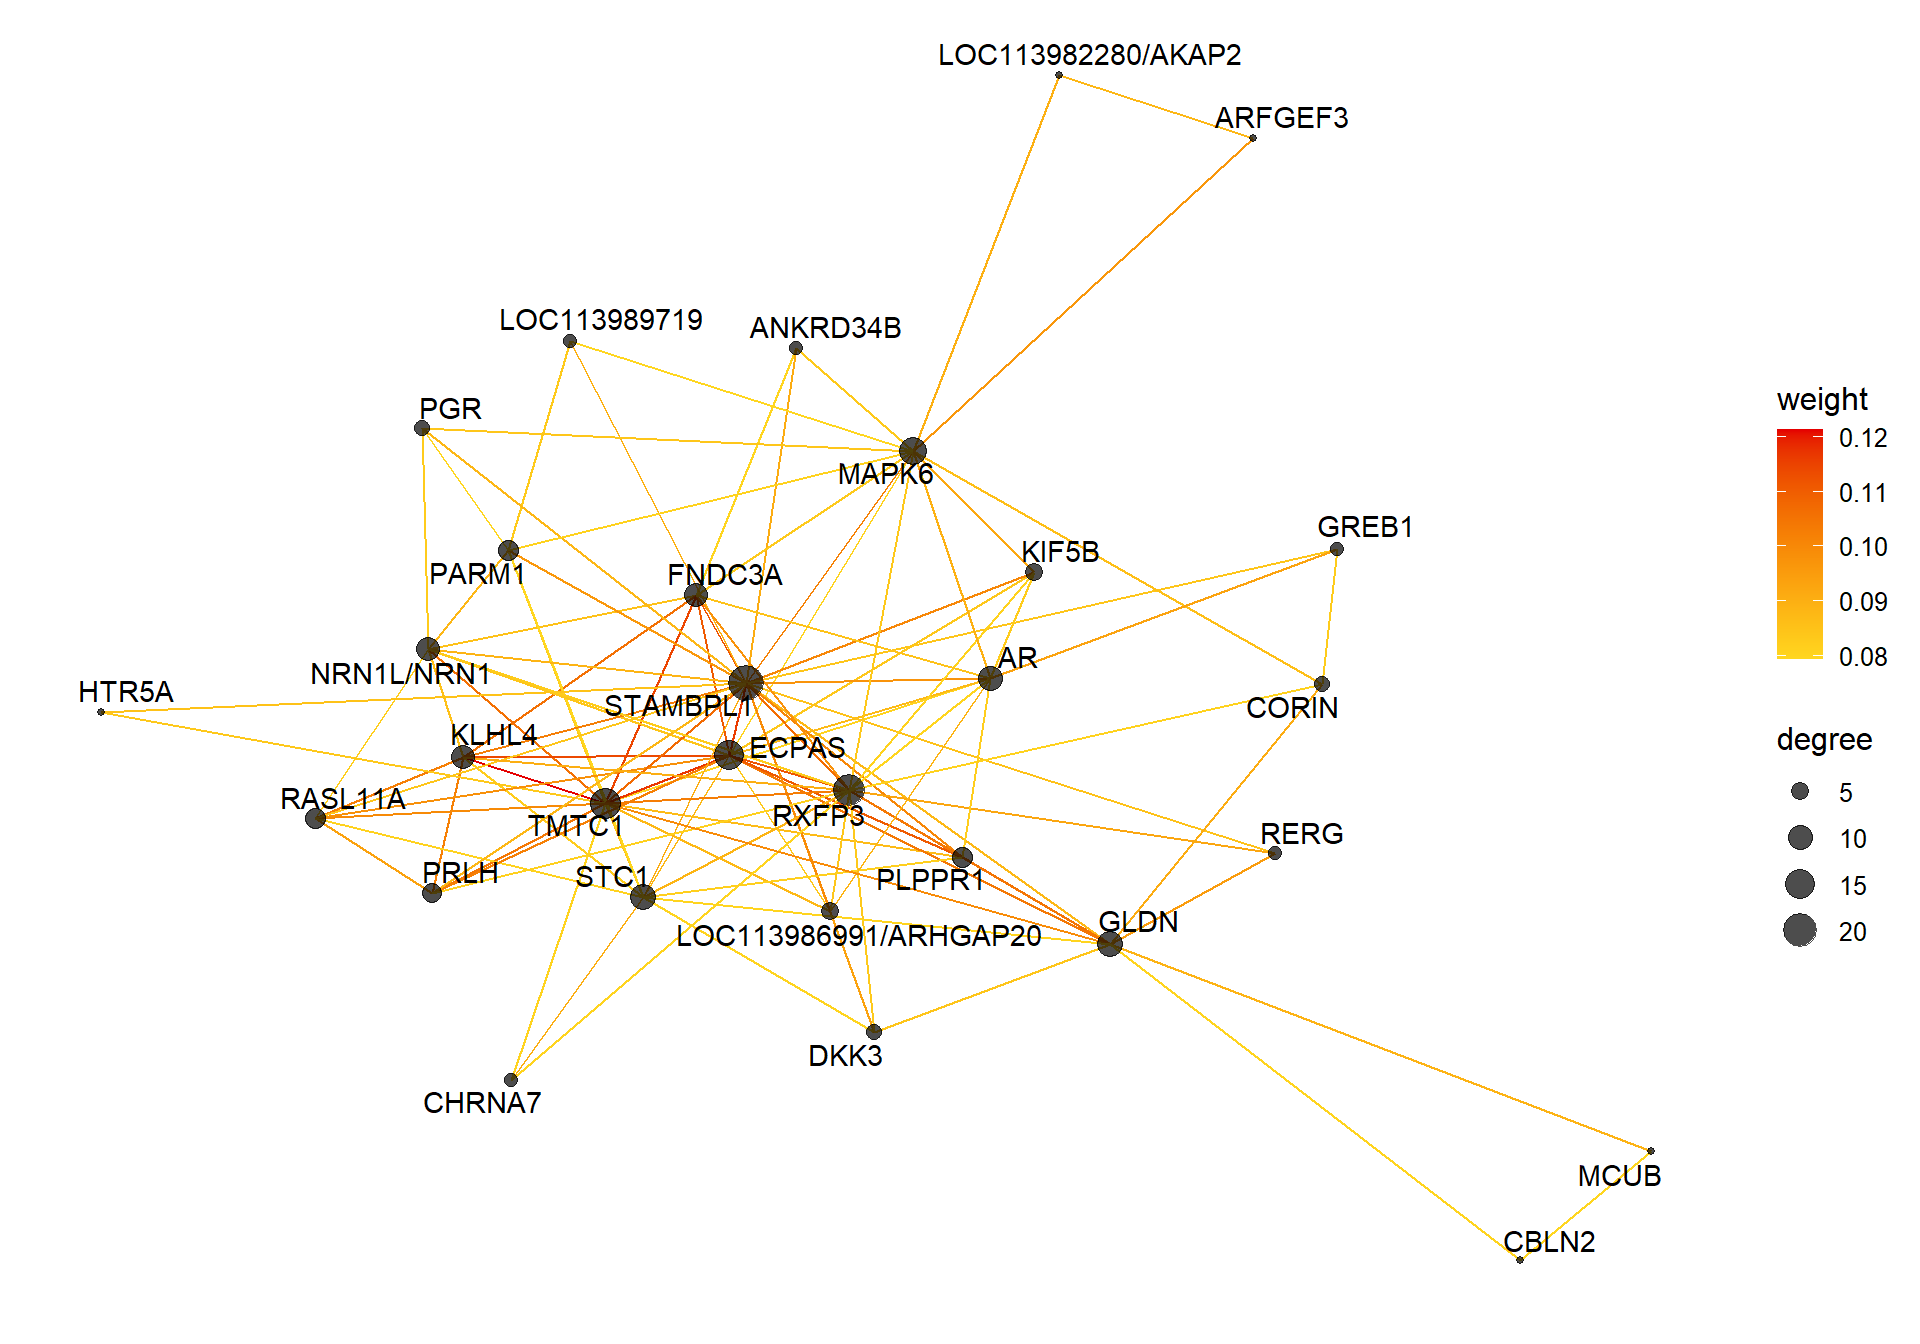
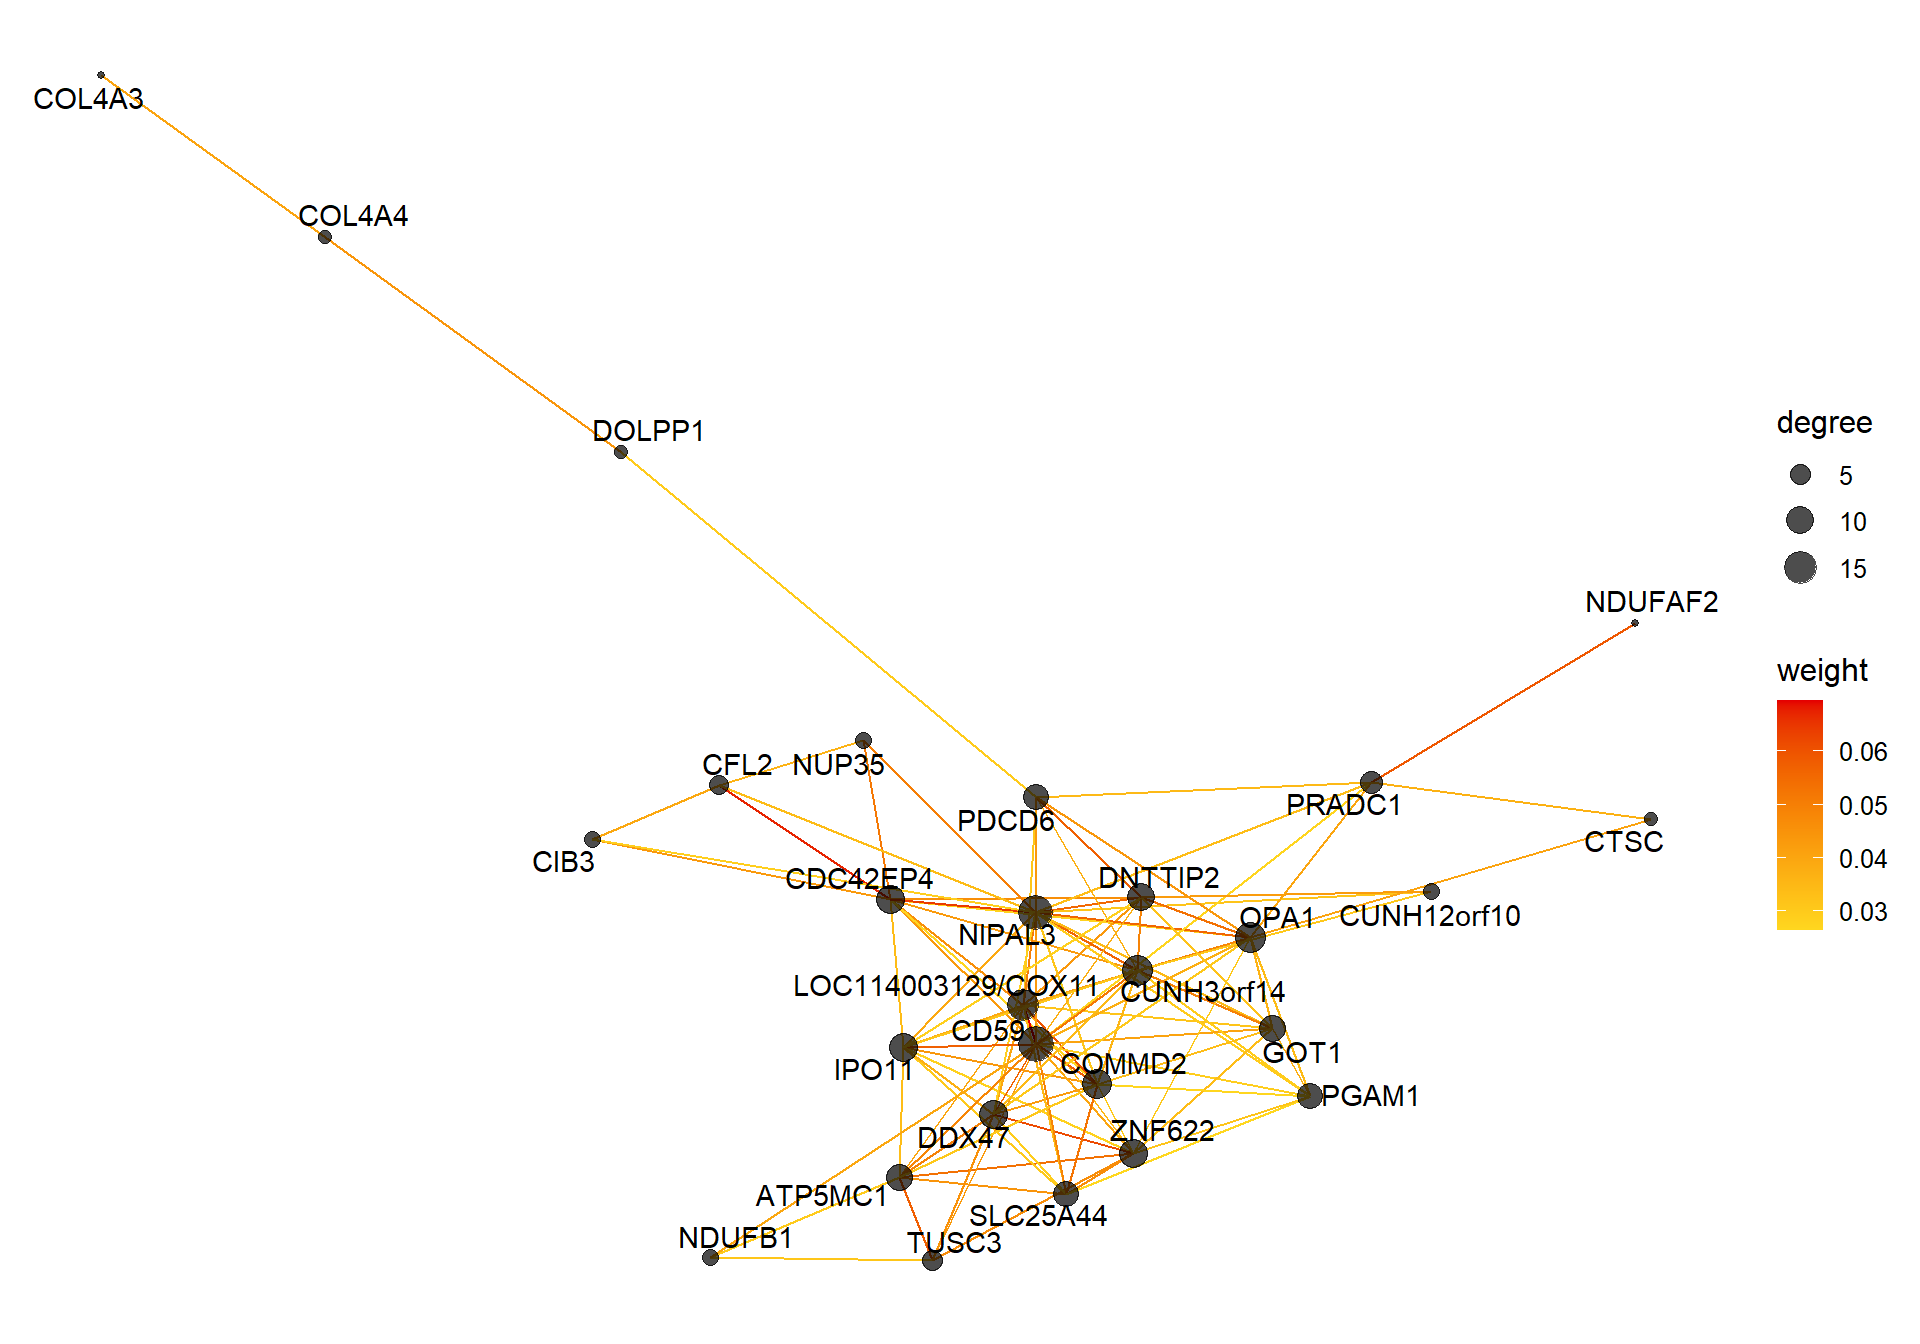
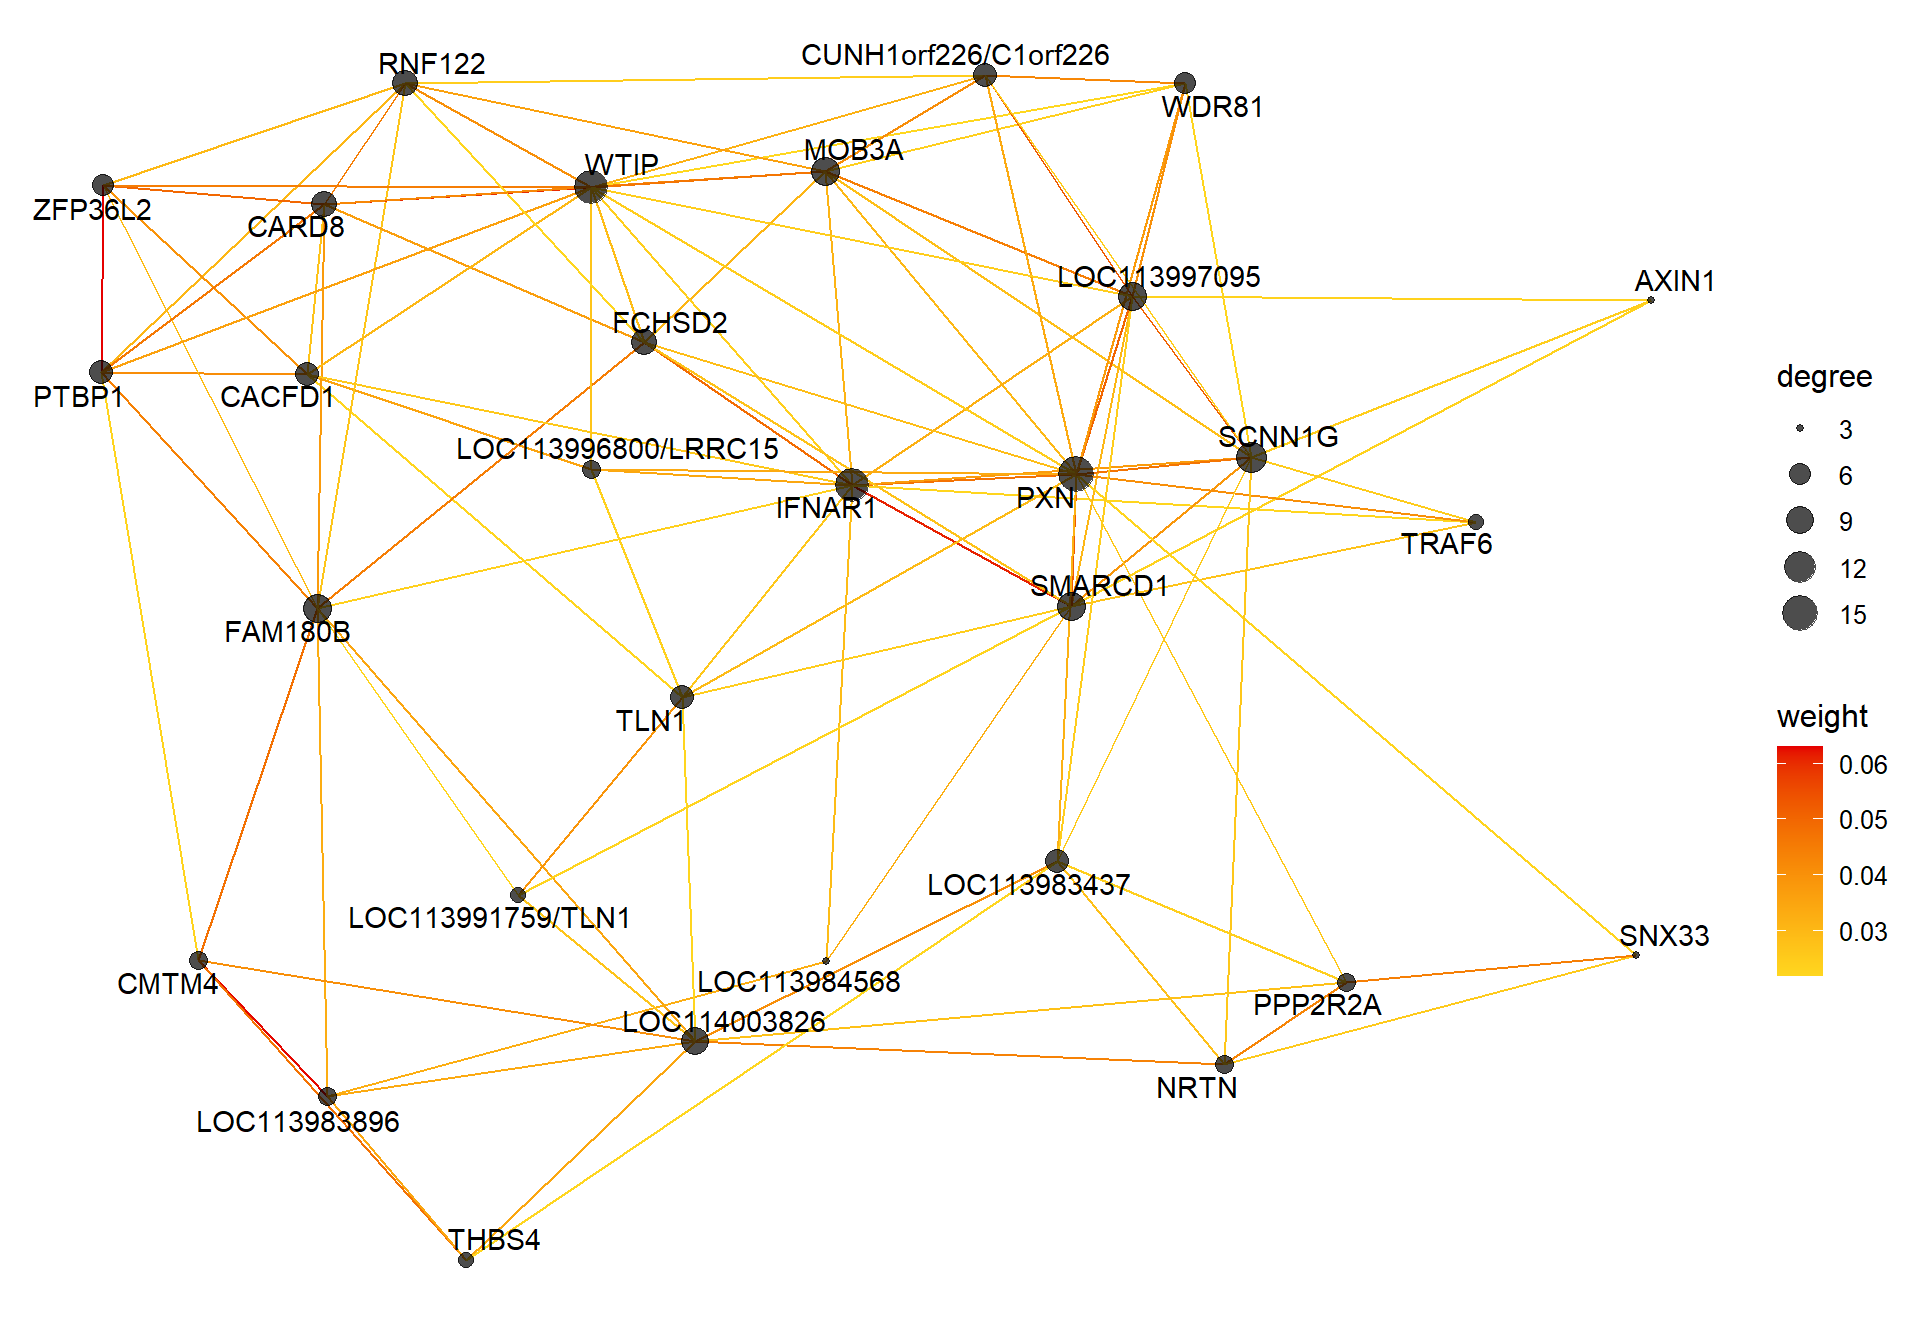
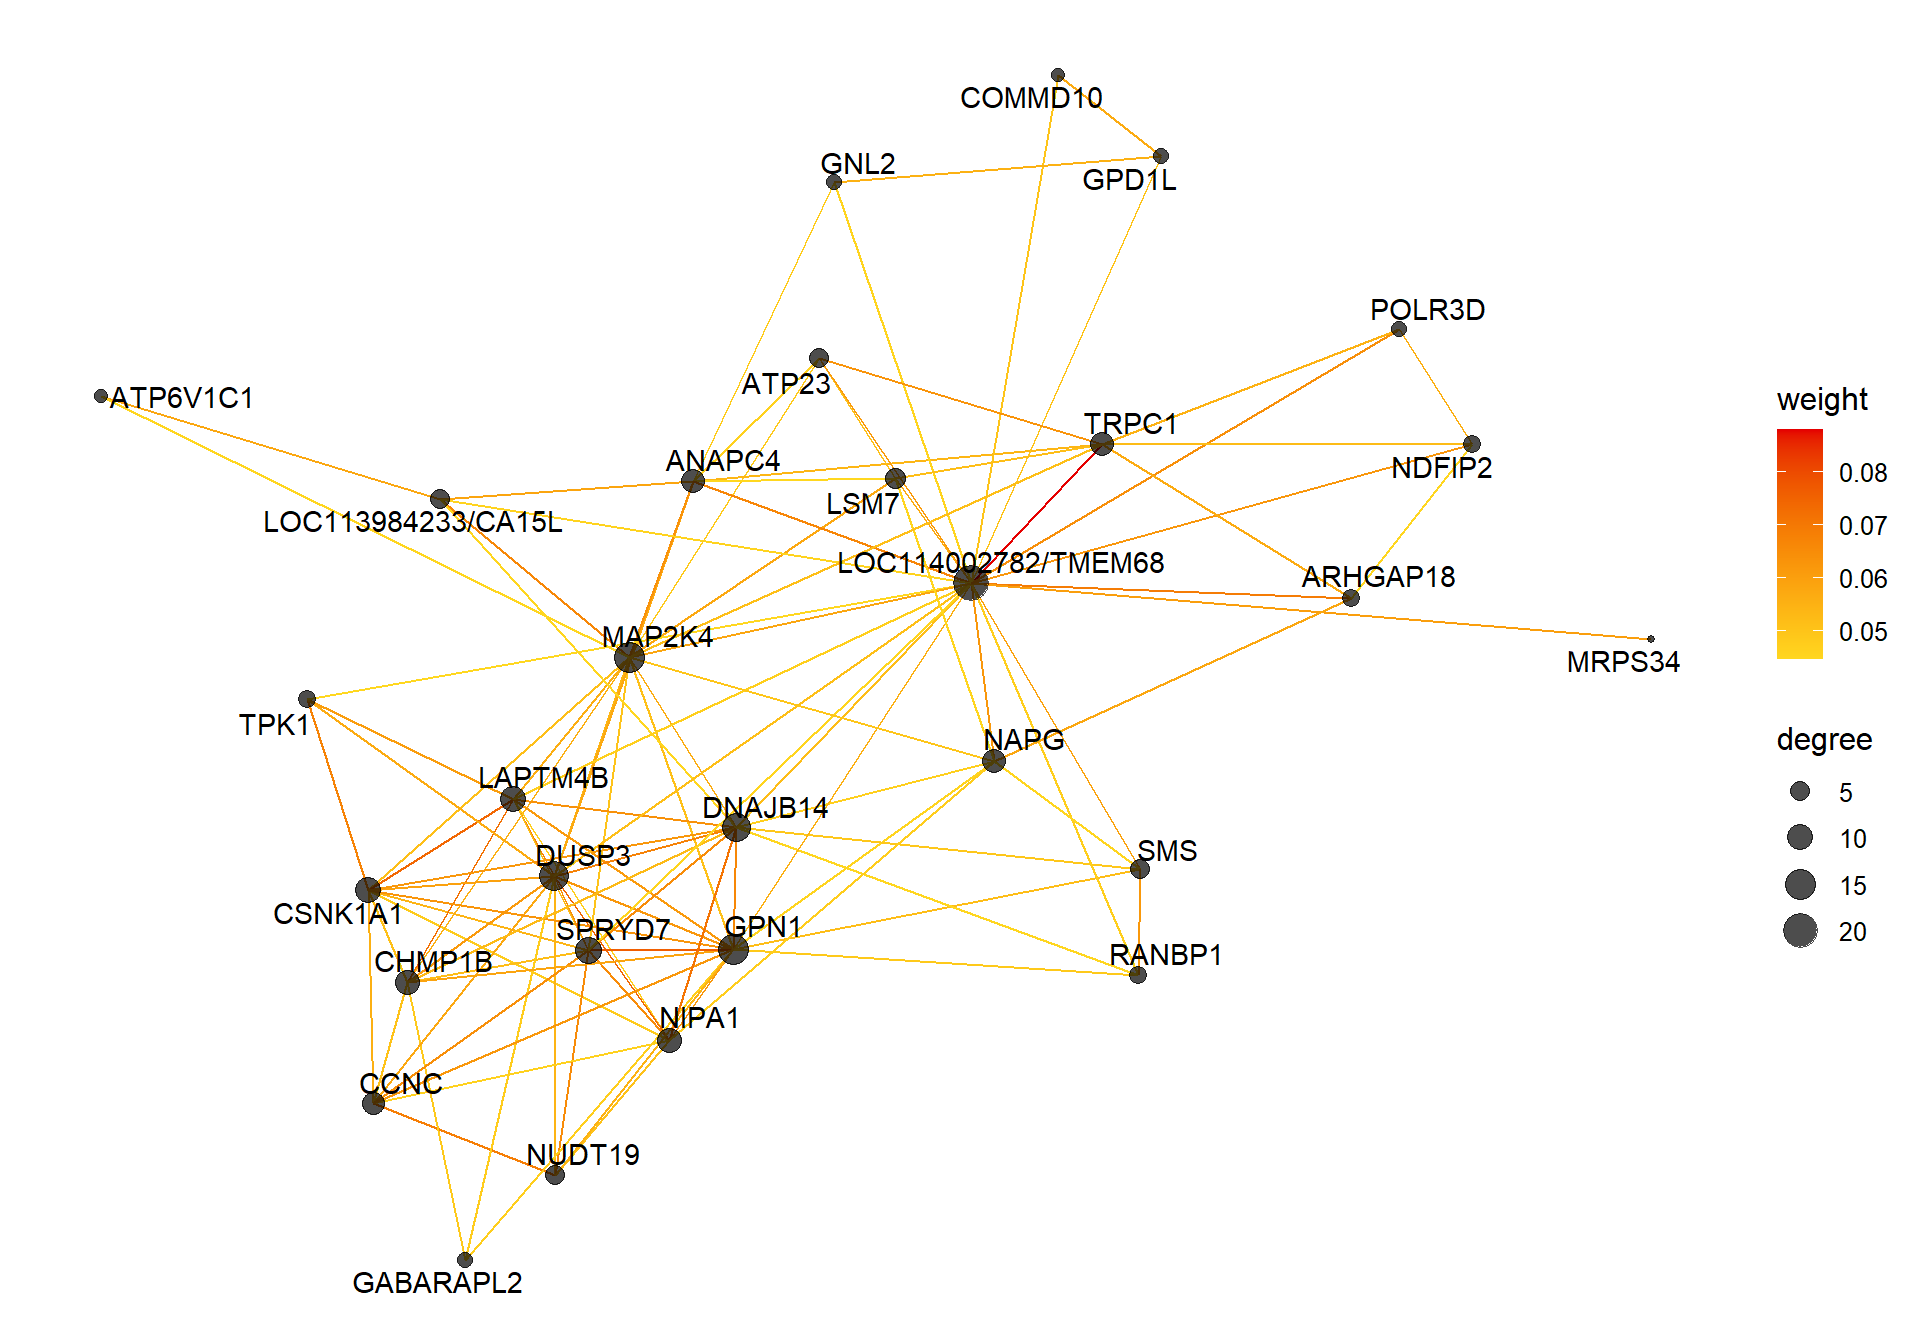
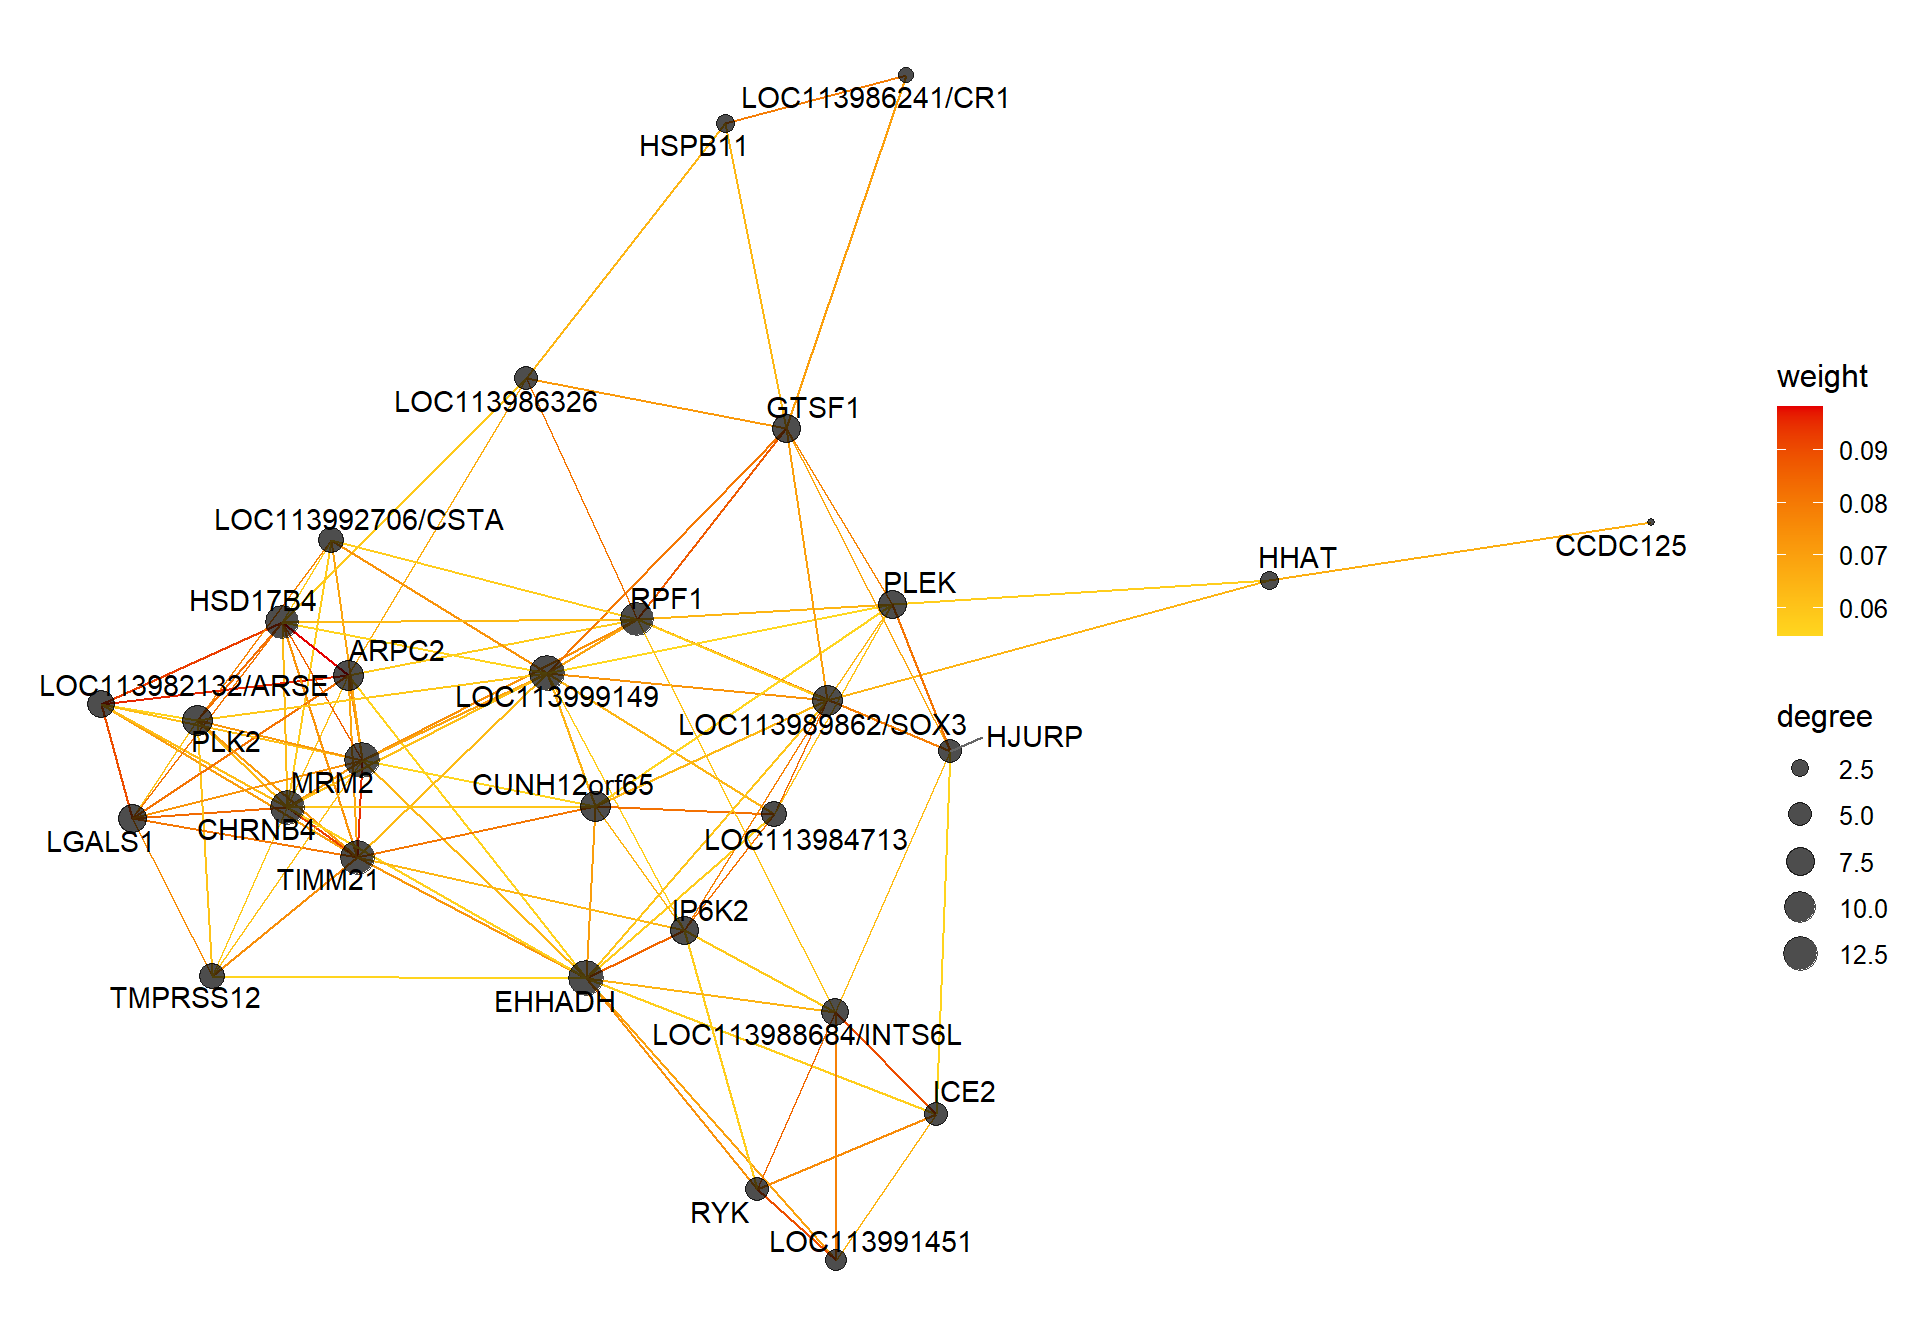
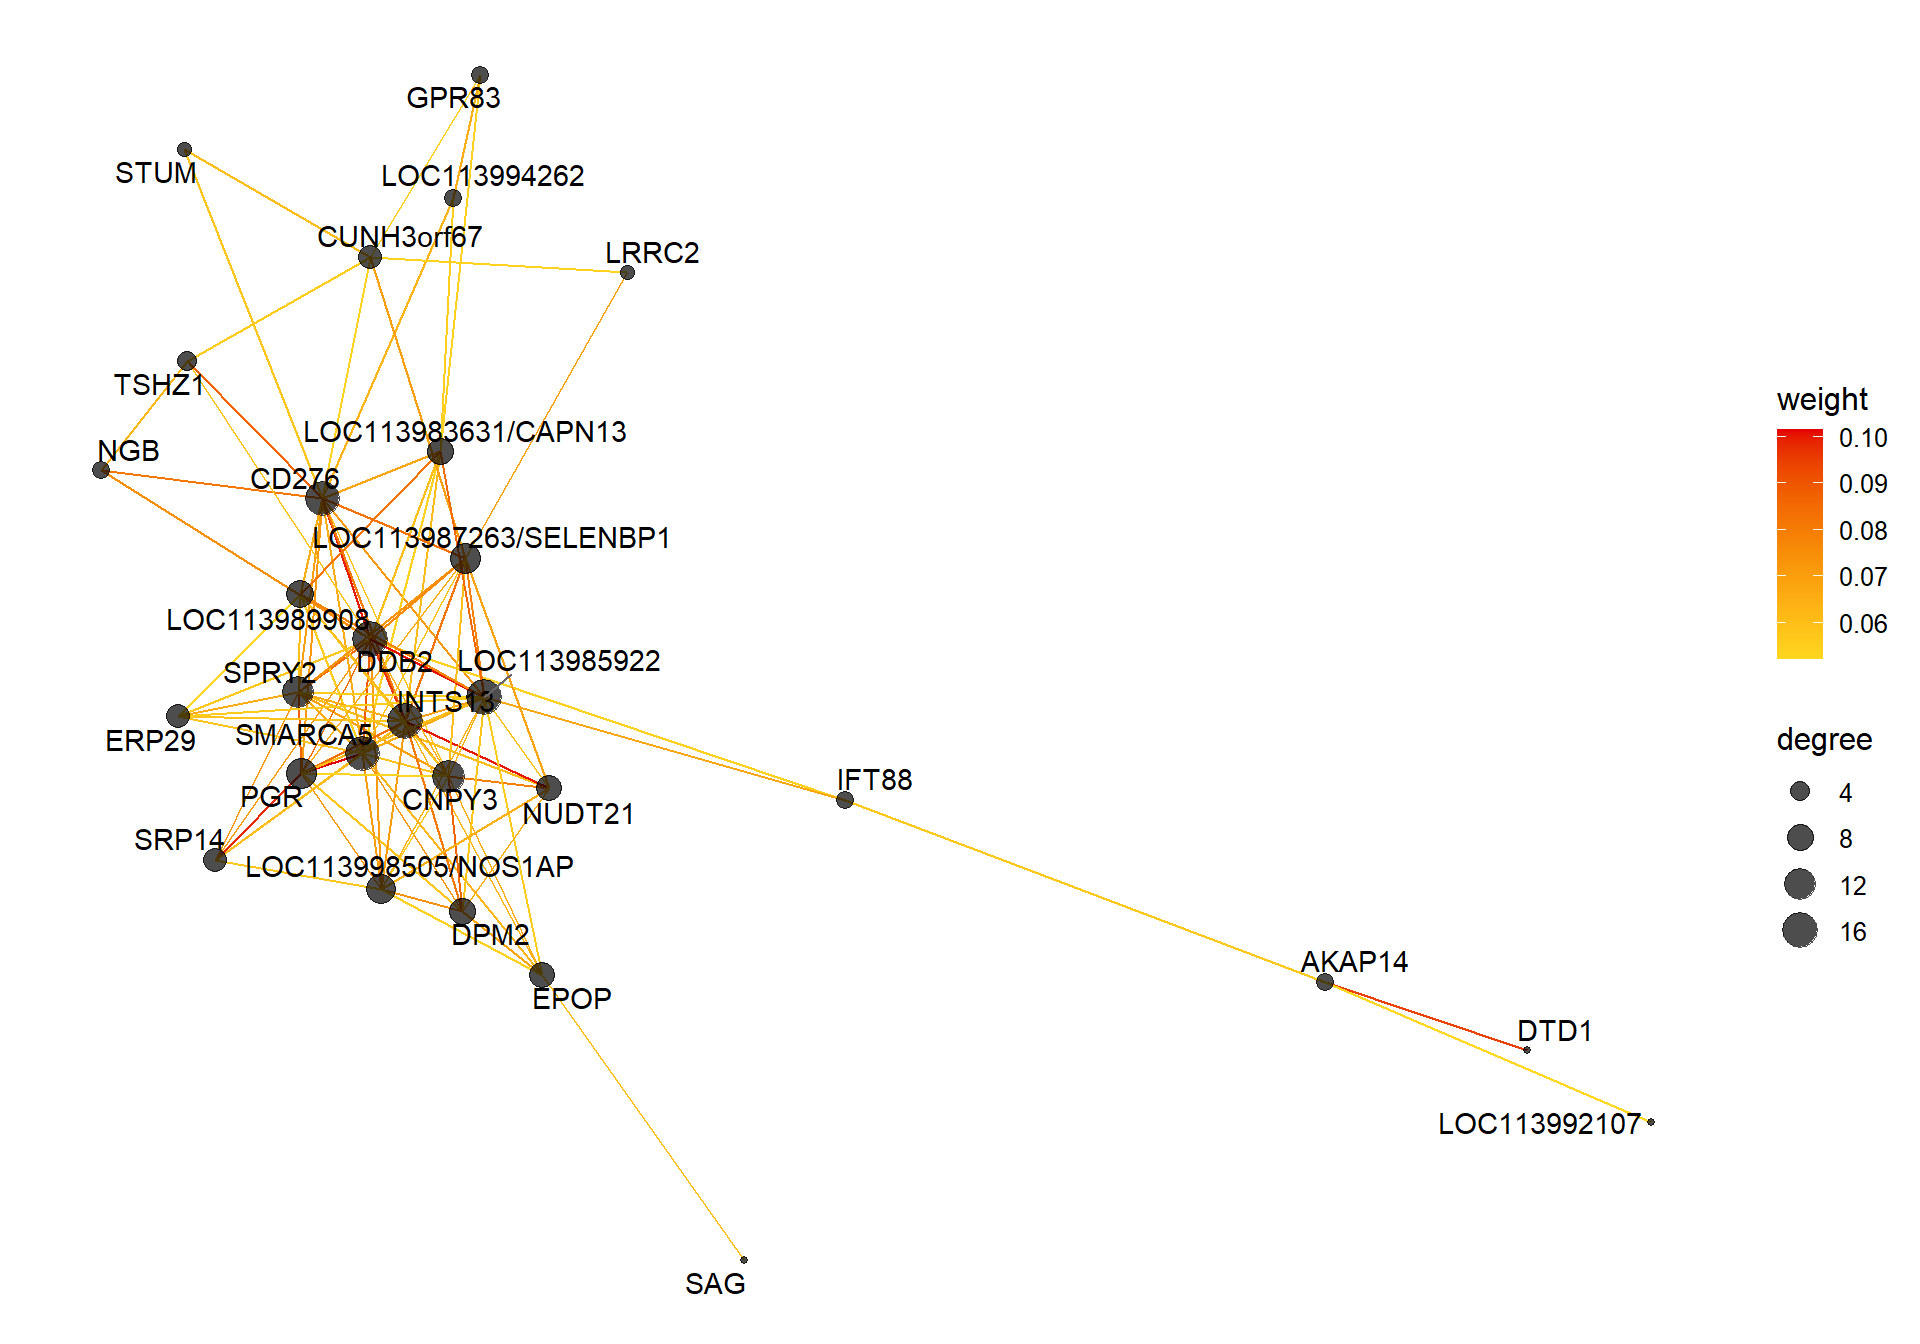
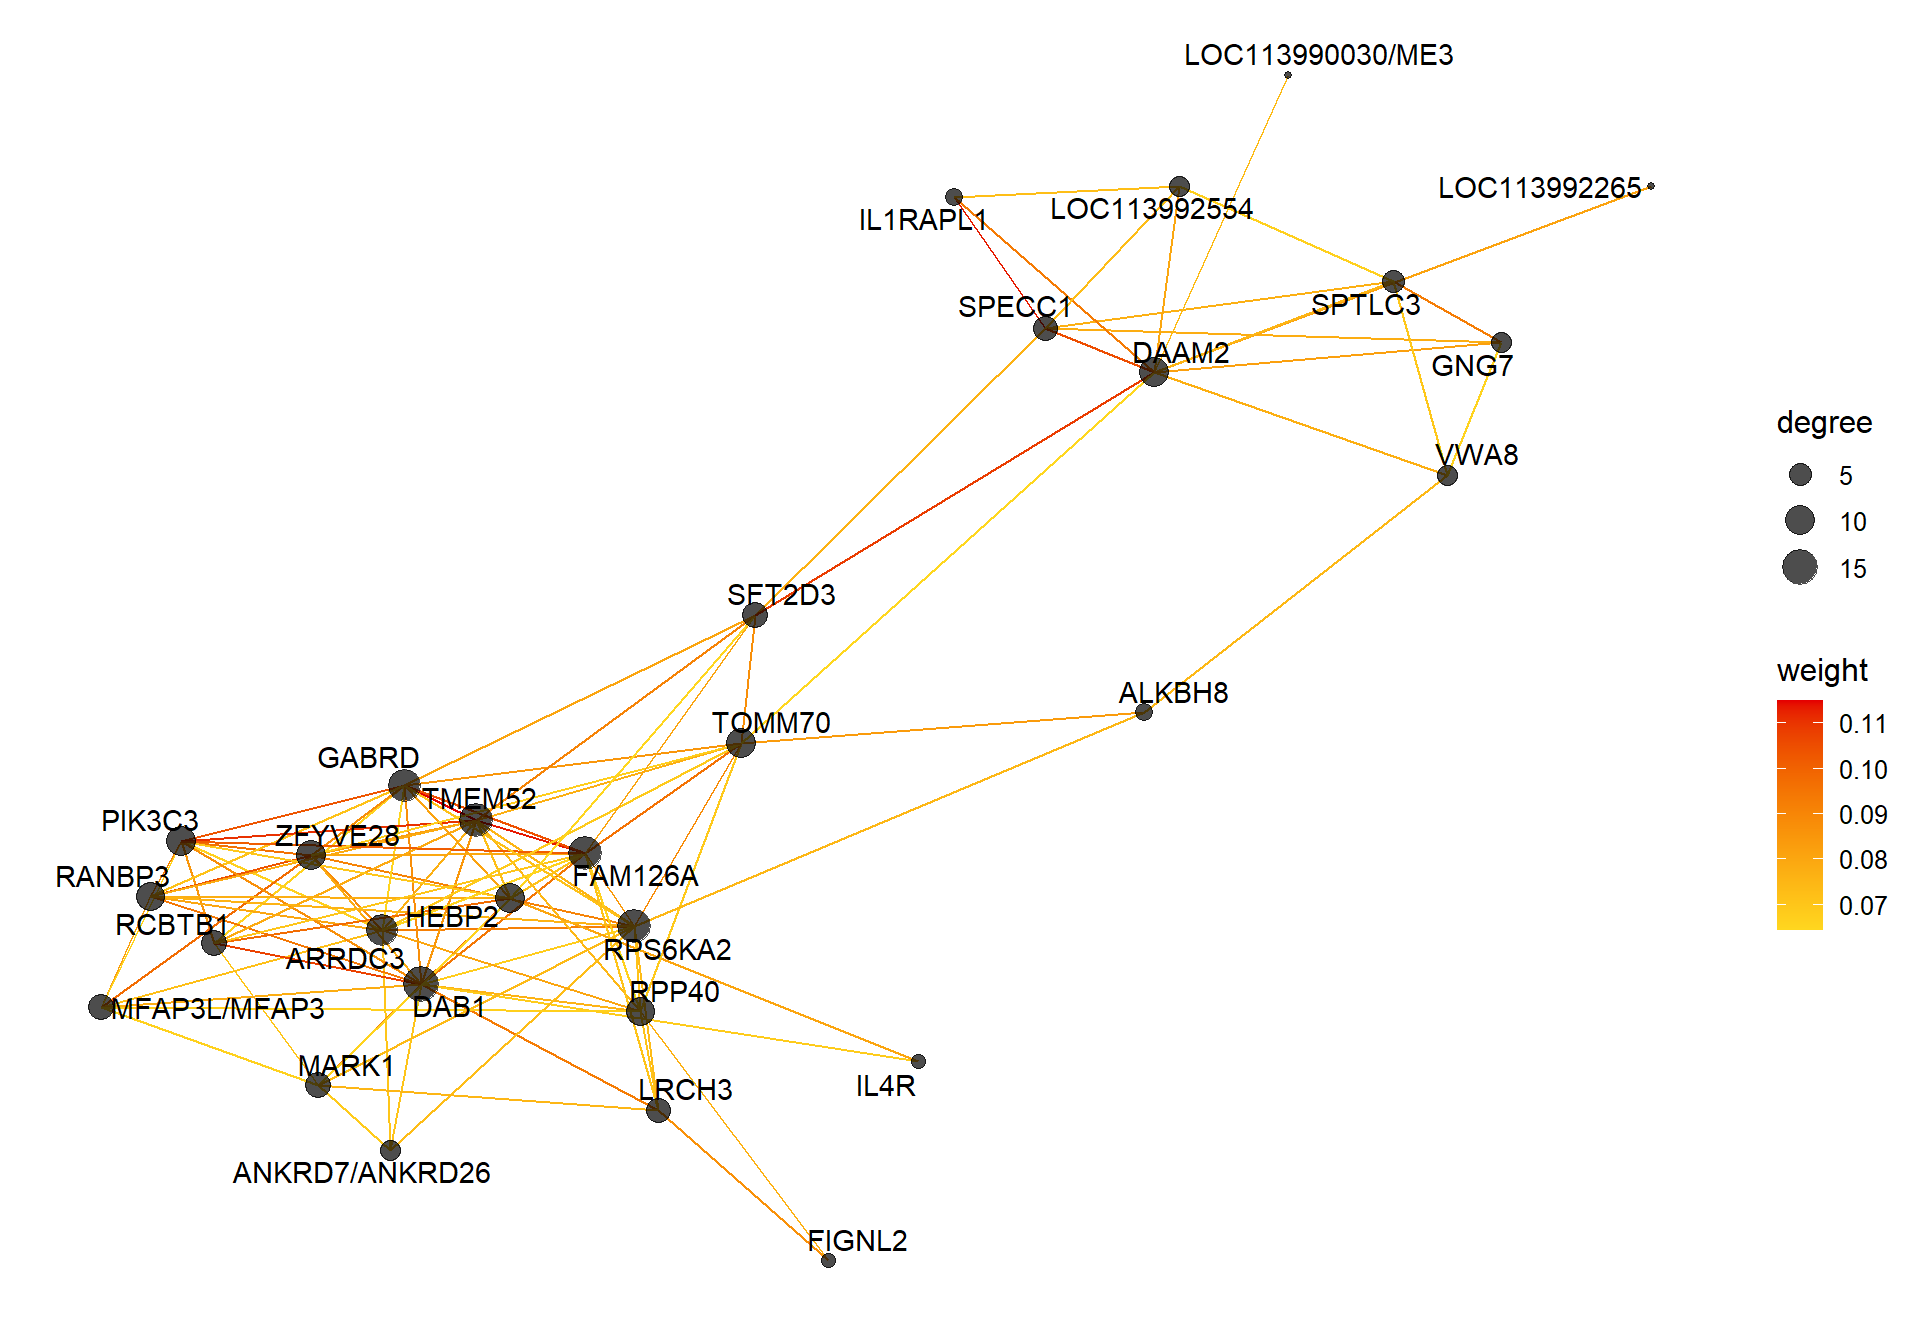
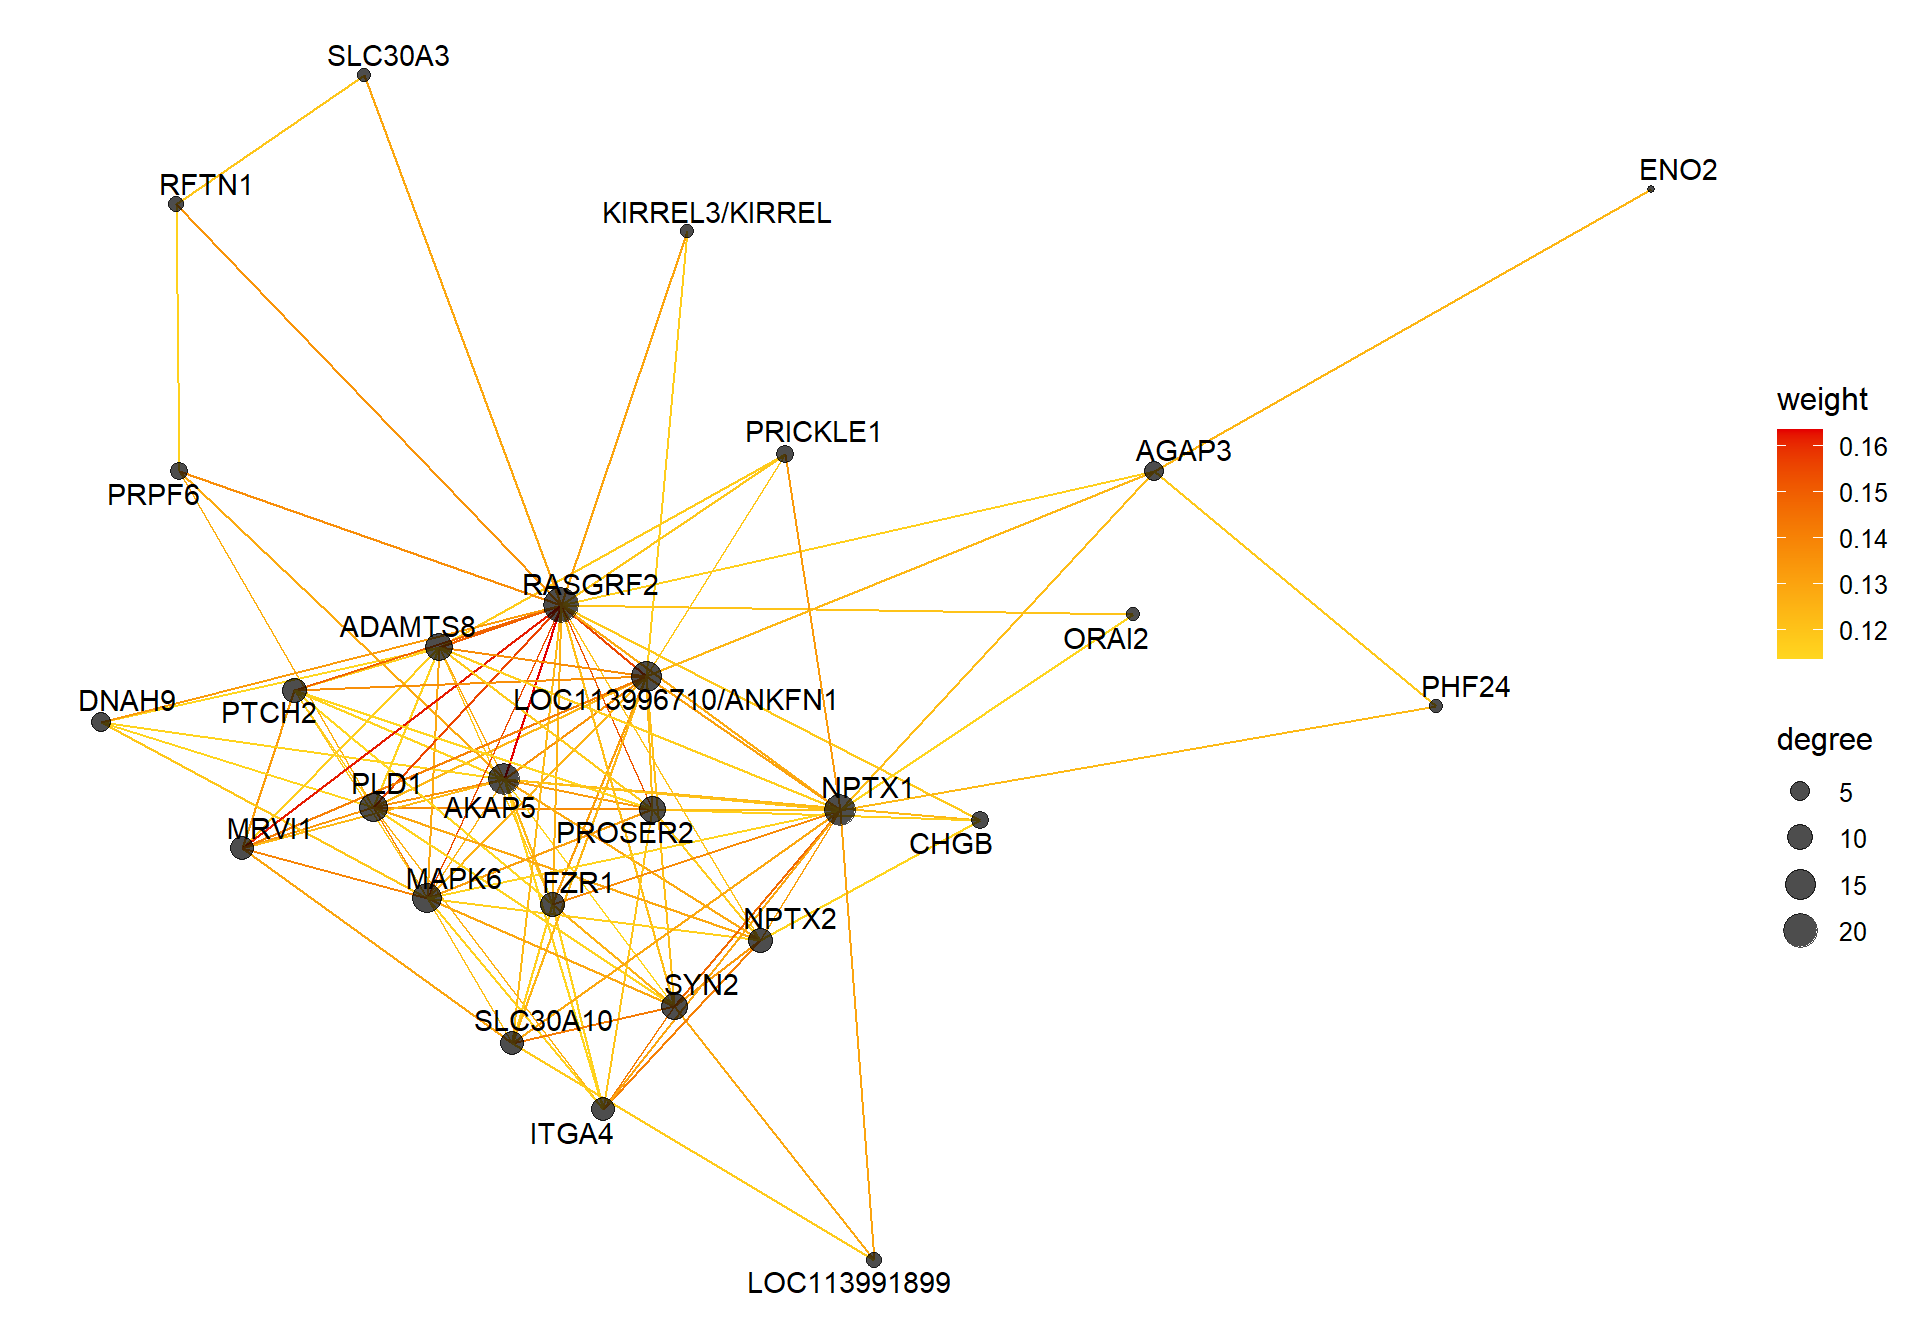
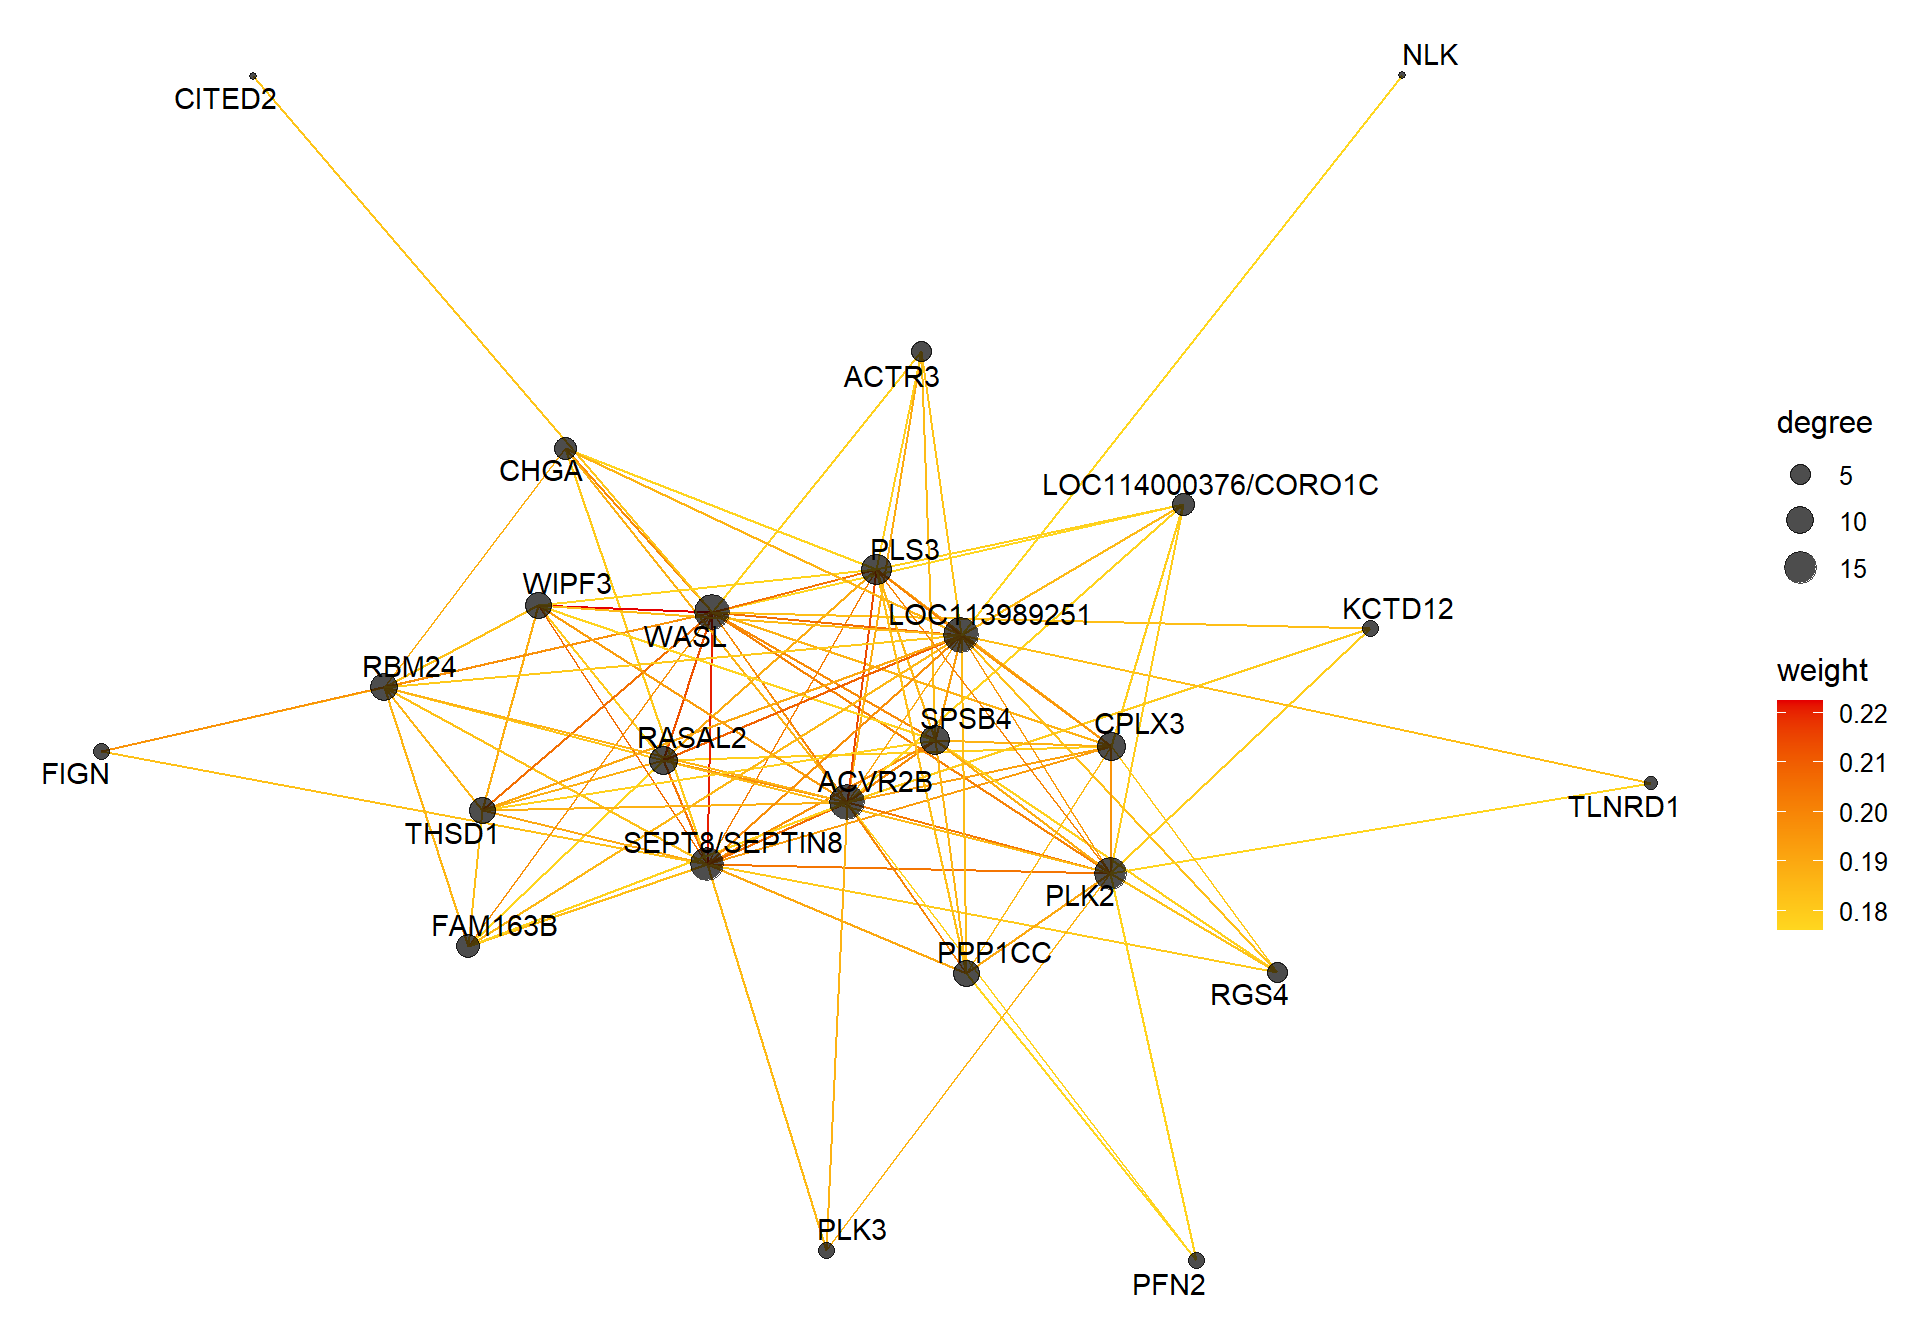
##### TOM BASED NETWORK ####
## get names of genes from the module


probes <- names(datExpr0)
inModule <- moduleColors==whichModule #creates logical vector of whether that gene is in the module
modProbes <- probes[inModule]


# Select the corresponding Topological Overlap
modTOM <- TOM[inModule, inModule] #TOM object does not have any gene names so need to use the positional information from the logical vector.

dimnames(modTOM) <- list(modProbes, modProbes)

IMConn<- softConnectivity(datExpr0[, modProbes], power = softPower, type="signed")
names(IMConn)<- modProbes
IMConn<- sort(IMConn, decreasing=T) #rank by highest connectivity
nTop<-30
top<- IMConn[1:nTop] #Take the top genes
top30TOM<- modTOM[names(top),names(top)]
#rename the TOM columns and rows to reflect the locno + gene ID.
top_genes<- module_genes[module_genes$gene %in% names(top),]
top_genes<- top_genes[match(names(top), top_genes$gene), ]
colnames(top30TOM)<- top_genes$display_gene_ID
rownames(top30TOM)<- top_genes$display_gene_ID
vis = exportNetworkToVisANT(top30TOM,
weighted = TRUE,
threshold = 0.00)
#take the top 25% of TOM connections
vis<- vis[vis$weight>summary(vis$weight)[5],]
CoExpGraph <- graph.data.frame(vis, directed=FALSE)
nDegree <- degree(CoExpGraph, v=V(CoExpGraph), mode=c("total"))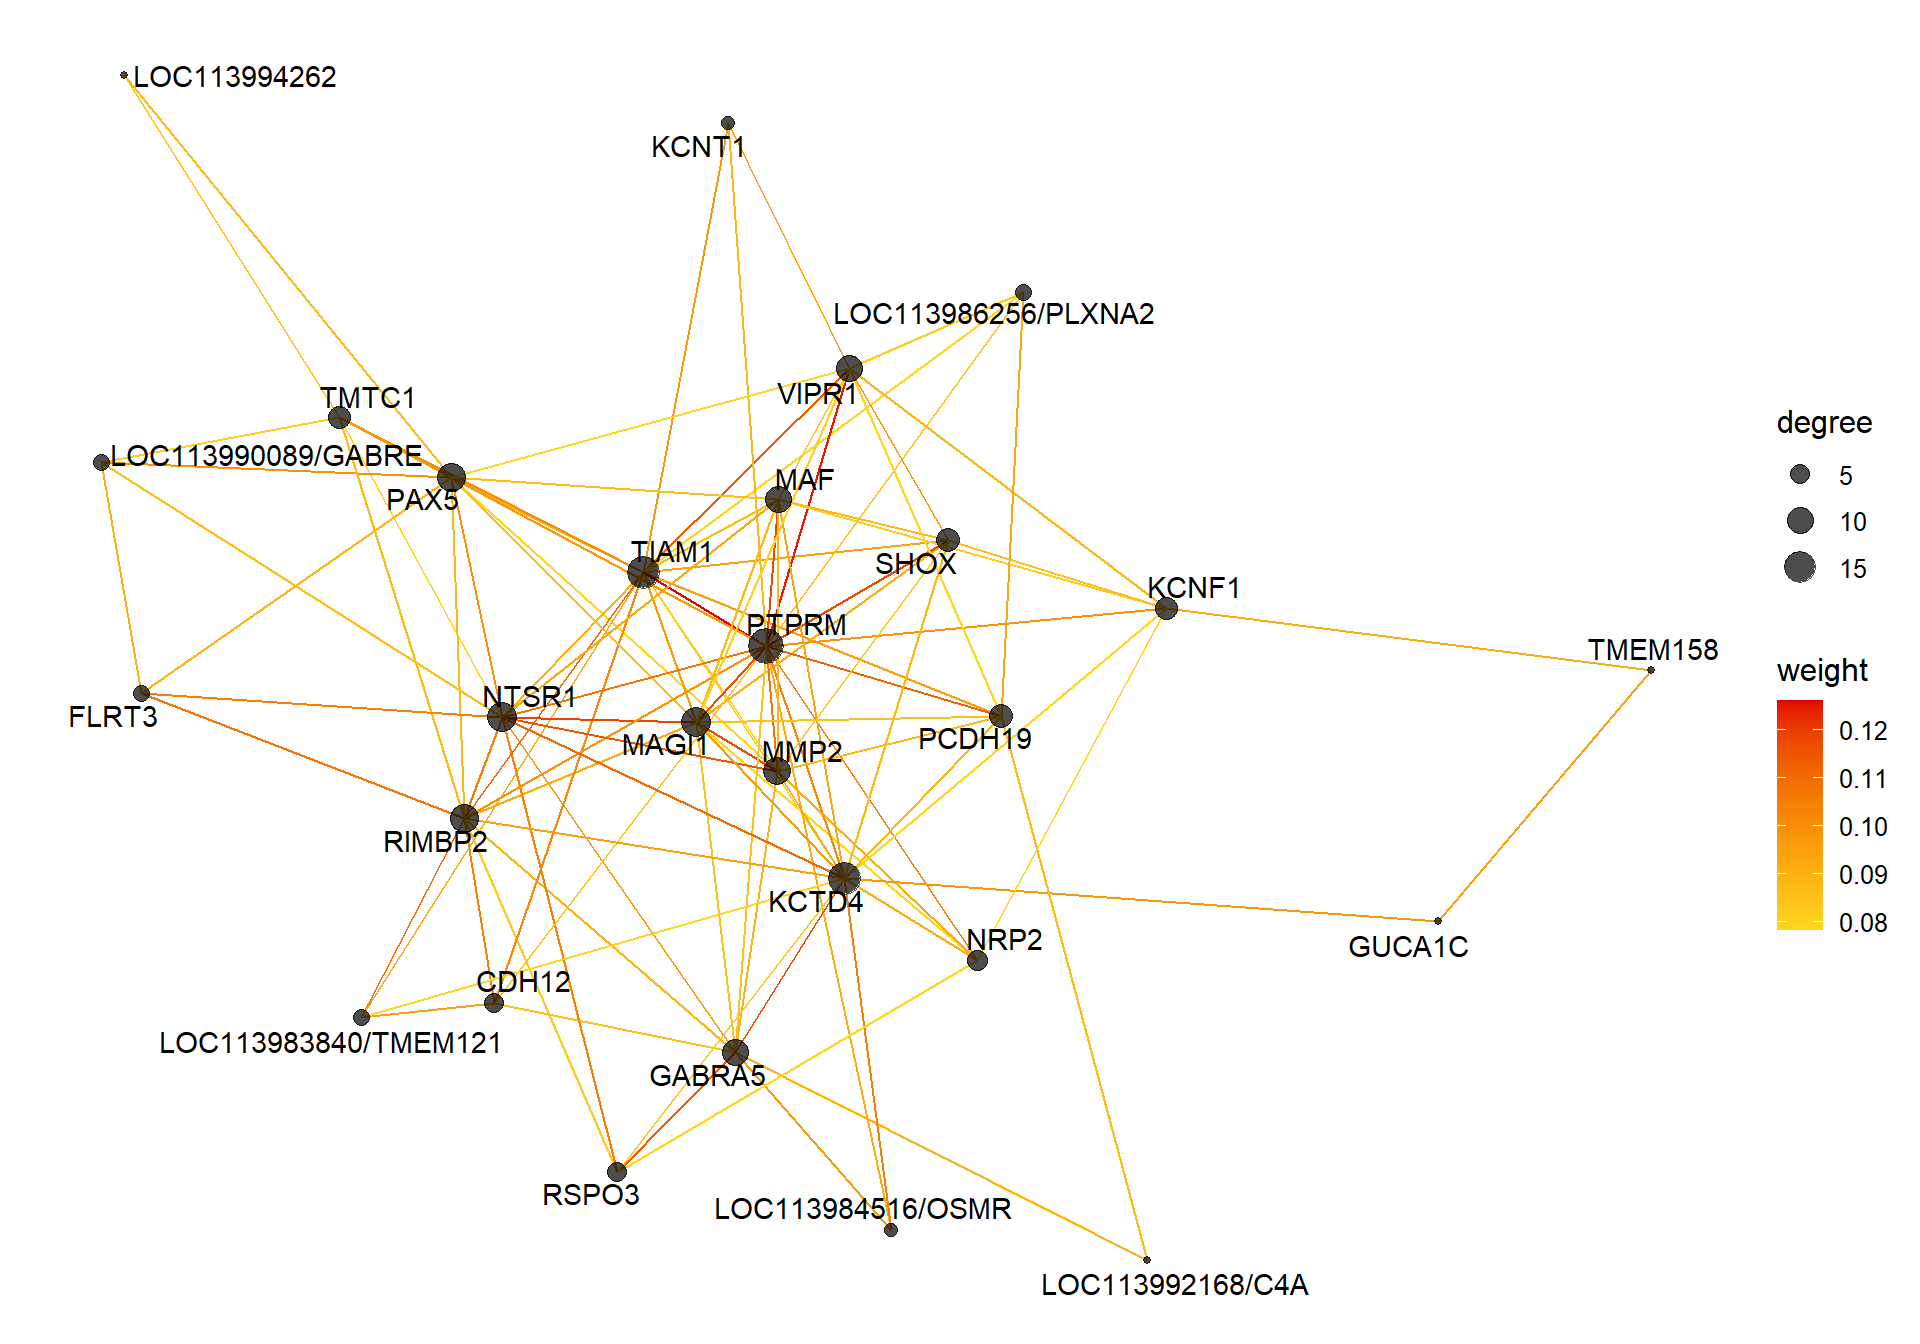
V(CoExpGraph)$degree <- nDegreeggplot(ggnetwork(CoExpGraph, layout=with_fr()), aes(x = x, y = y, xend = xend, yend = yend))+geom_edges(aes(color=weight))+geom_nodes(aes(x,y, size=degree),color="black", alpha=0.7) +scale_color_gradient(low="#ffd71f", high="#e50000")+theme_blank()+ geom_nodetext_repel(aes(label=name))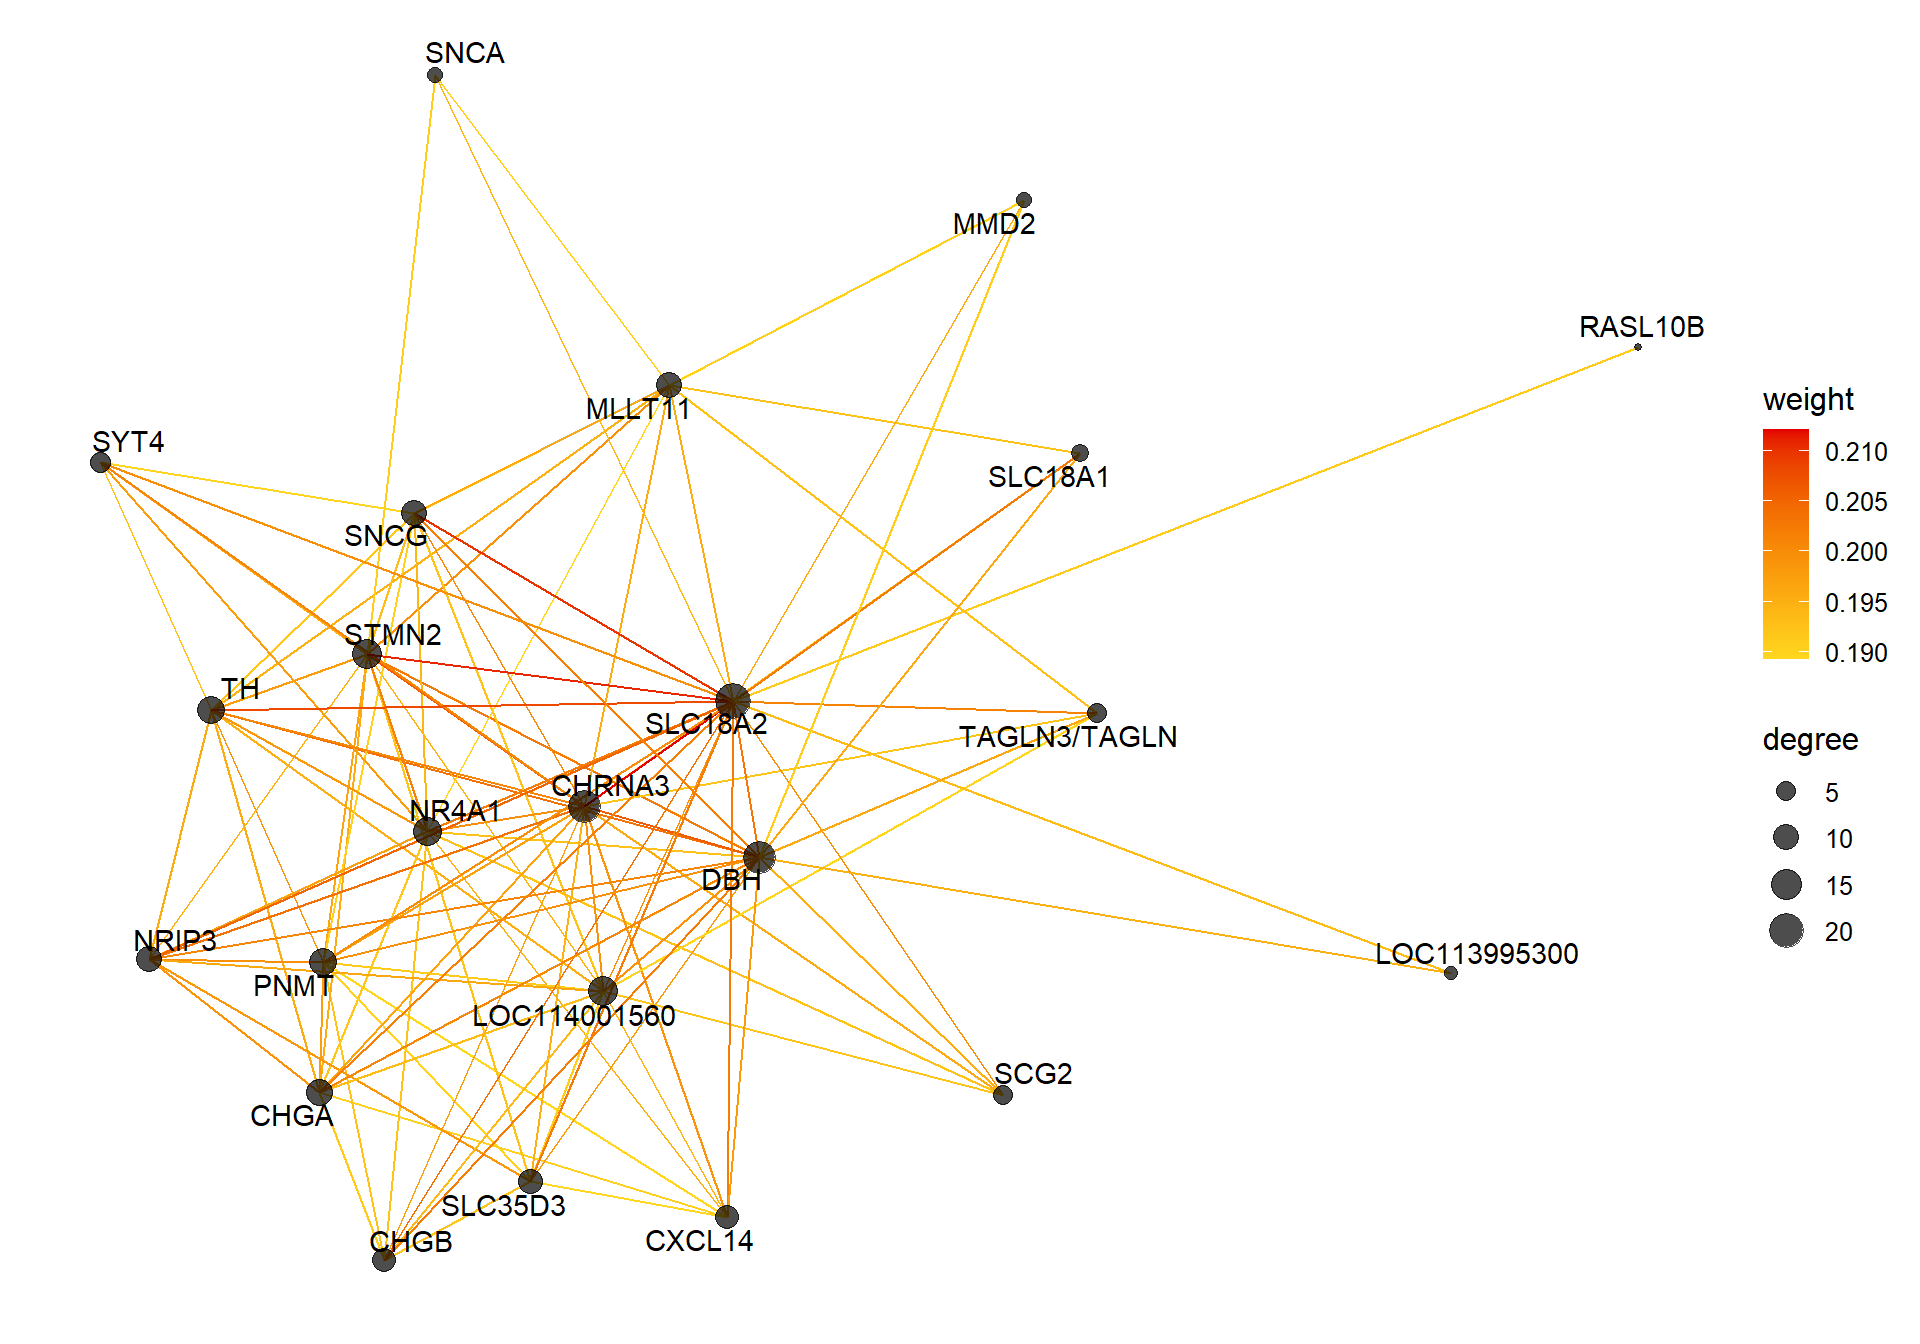
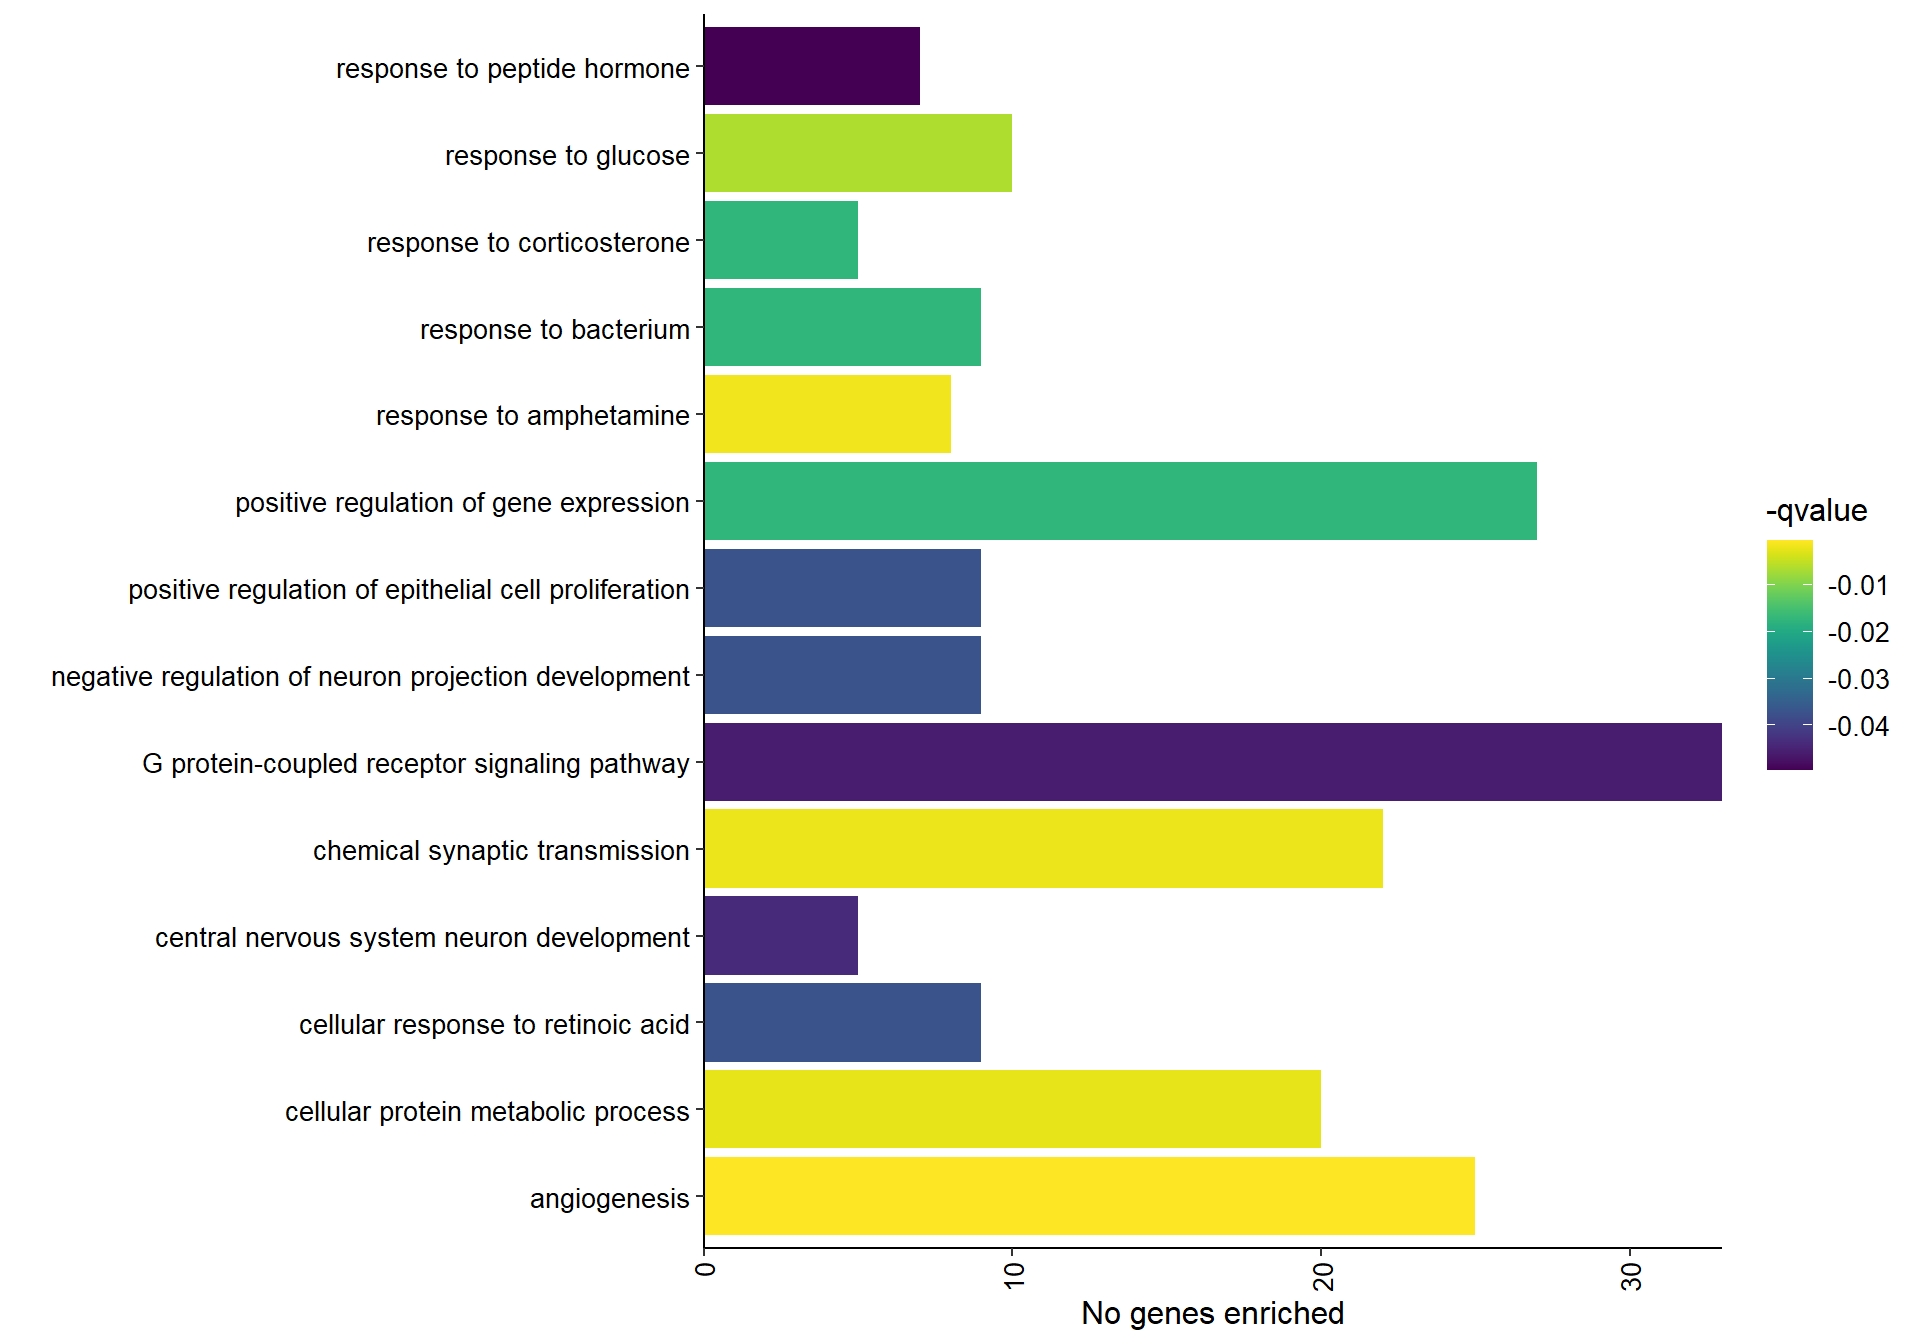
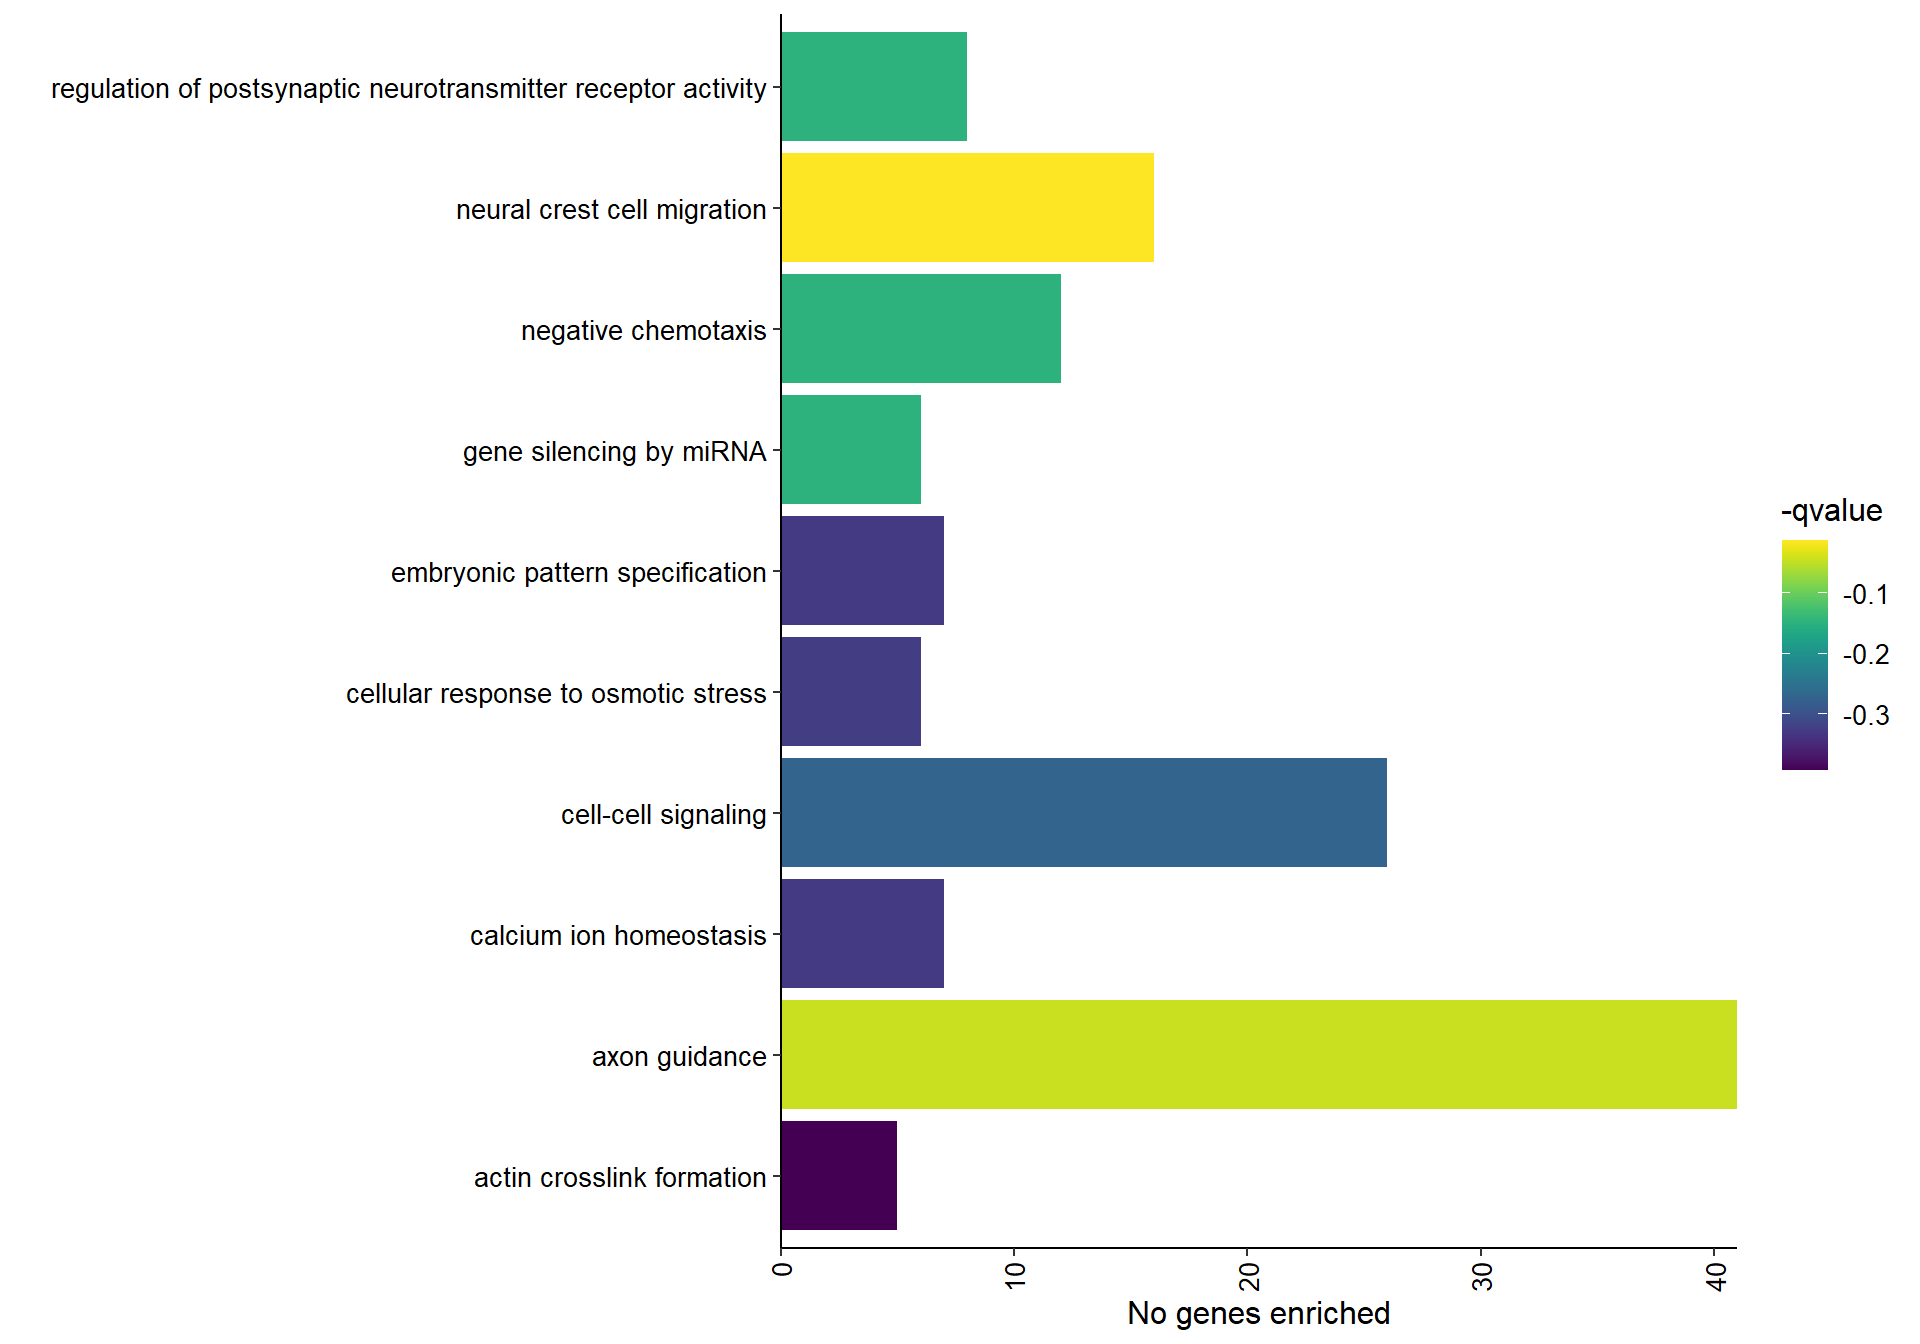
1.8.1.2 Gene Ontology
| ID | Description | GeneRatio | BgRatio | pvalue | p.adjust | qvalue | geneID | Count |
|---|---|---|---|---|---|---|---|---|
| GO:0001525 | angiogenesis | 25/490 | 205/12555 | 0.0000004 | 0.0006380 | 0.0005905 | ACVR1/ANXA2/APOLD1/ARHGAP22/CCN2/EGF/ENG/FGF1/FOXC1/HSPG2/ID1/JUN/LOC113990968/LOC114000824/LOC114001403/LOC114001849/MAPK14/MMP2/NRCAM/PLXND1/PROK2/ROBO4/SCG2/TGFBI/THY1 | 25 |
| GO:0001975 | response to amphetamine | 8/490 | 24/12555 | 0.0000022 | 0.0016401 | 0.0015179 | ASIC3/DBH/PPP1R9B/RGS10/RGS2/RGS4/SLC18A2/TH | 8 |
| GO:0007268 | chemical synaptic transmission | 22/490 | 188/12555 | 0.0000041 | 0.0020970 | 0.0019408 | AKAP5/CACNA1E/CHRNA3/CPLX1/CRH/DBH/FGF12/GAD2/HTR1E/HTR4/LOC113983406/LOC113990721/NPY/PLP1/PMP22/SLC18A2/SLC6A2/SNCA/SNCG/SV2B/SYN2/SYT1 | 22 |
| GO:0044267 | cellular protein metabolic process | 20/490 | 165/12555 | 0.0000066 | 0.0025184 | 0.0023308 | ADORA2B/ANO8/B2M/CHGB/CTSH/FURIN/HSPG2/LAMB2/LGALS1/LOC113986369/LOC114003910/LYZ/MMP2/SCG2/SCG3/SFTPB/SFTPC/SNCA/SNCAIP/TGFBI | 20 |
| GO:0009749 | response to glucose | 10/490 | 51/12555 | 0.0000226 | 0.0068942 | 0.0063809 | ACVR1C/ADIPOQ/CCN2/FKBP1B/GJA1/LOC113992227/LPL/SARM1/SREBF1/TXNIP | 10 |
| GO:0010628 | positive regulation of gene expression | 27/490 | 310/12555 | 0.0000826 | 0.0189665 | 0.0175543 | CCN2/CITED2/CRH/CTSH/EGF/FGF1/GATA5/GJA1/ID1/IL34/LOC113992691/LOC114001703/LRRC32/MAPK14/MYC/NOS1AP/NR5A1/OSR1/OSR2/PDE2A/PLP1/SLC26A9/SLC6A4/STAR/STAT3/TWIST1/ZNF804A | 27 |
| GO:0051412 | response to corticosterone | 5/490 | 13/12555 | 0.0000880 | 0.0189665 | 0.0175543 | CRH/LOC113992757/NEFL/STAR/TH | 5 |
| GO:0009617 | response to bacterium | 9/490 | 49/12555 | 0.0000996 | 0.0189665 | 0.0175543 | ADIPOQ/CCDC80/CLPS/DGKB/FKBP5/LOC114003559/LPL/RGS1/VIL1 | 9 |
| GO:0050679 | positive regulation of epithelial cell proliferation | 9/490 | 55/12555 | 0.0002504 | 0.0399249 | 0.0369522 | ATP7A/DLX5/FGF1/ID1/MYC/NR4A3/OSR1/OSR2/TWIST1 | 9 |
| GO:0010977 | negative regulation of neuron projection development | 9/490 | 56/12555 | 0.0002882 | 0.0399249 | 0.0369522 | B2M/INPP5J/LGALS1/LOC114000824/NR2F1/PRAG1/RTN4RL2/STMN2/VIM | 9 |
## preparing gene to GO mapping data...## preparing IC data...## Warning in if (class(try(col2rgb(palette), silent = TRUE)) == "try-error")
## stop("color palette is not correct"): the condition has length > 1 and only the
## first element will be used
2 Pituitary (PIT)
The code for this tissue is mostly above, but each section the R environment is cleared to only keep the base data.
keep<- c("data", "peri_theme", "key","key_behav","dodge","genes_key", "keep", "go2gene_mf","go2name_mf","go2gene_bp","go2name_bp", "wgcna_summary")
rm(list= ls()[!(ls() %in% keep)])
## [1] 14812## Warning in DESeqDataSet(se, design = design, ignoreRank): some variables in
## design formula are characters, converting to factors## estimating size factors## estimating dispersions## gene-wise dispersion estimates## mean-dispersion relationship## final dispersion estimates## fitting model and testing## -- replacing outliers and refitting for 101 genes
## -- DESeq argument 'minReplicatesForReplace' = 7
## -- original counts are preserved in counts(dds)## estimating dispersions## fitting model and testing## Flagging genes and samples with too many missing values...
## ..step 1## [1] TRUE## Power SFT.R.sq slope truncated.R.sq mean.k. median.k. max.k.
## 1 1 0.003630 -4.320 0.856 7410.0 7420.0 7640
## 2 2 0.000786 0.449 0.935 4240.0 4230.0 4720
## 3 3 0.002610 -0.375 0.918 2650.0 2640.0 3310
## 4 4 0.027300 -0.758 0.906 1780.0 1750.0 2490
## 5 5 0.091300 -1.030 0.896 1250.0 1220.0 1960
## 6 6 0.181000 -1.180 0.892 911.0 881.0 1600
## 7 7 0.279000 -1.310 0.890 687.0 654.0 1340
## 8 8 0.375000 -1.420 0.892 531.0 498.0 1140
## 9 9 0.455000 -1.490 0.896 419.0 386.0 985
## 10 10 0.517000 -1.580 0.894 337.0 304.0 863
## 11 11 0.578000 -1.620 0.908 275.0 243.0 764
## 12 12 0.619000 -1.670 0.911 228.0 196.0 681
## 13 14 0.675000 -1.750 0.914 161.0 133.0 554
## 14 16 0.707000 -1.810 0.913 118.0 92.7 460
## 15 18 0.712000 -1.890 0.903 89.3 66.3 389
## 16 20 0.732000 -1.920 0.912 69.1 48.5 334
## 17 22 0.751000 -1.930 0.922 54.6 36.4 290
## 18 24 0.757000 -1.970 0.925 43.8 27.8 254
## 19 26 0.775000 -1.970 0.934 35.7 21.5 224
The soft-power selected for PIT is 18.
| moduleColors | Freq |
|---|---|
| bisque4 | 1328 |
| blue | 1594 |
| blue2 | 156 |
| brown4 | 208 |
| coral1 | 2779 |
| coral2 | 382 |
| coral3 | 59 |
| darkgreen | 397 |
| darkgrey | 883 |
| darkolivegreen2 | 589 |
| darkolivegreen4 | 253 |
| darkorange2 | 126 |
| darkslateblue | 936 |
| darkviolet | 72 |
| firebrick3 | 1601 |
| floralwhite | 295 |
| honeydew | 61 |
| lightcyan1 | 133 |
| lightgreen | 1798 |
| orangered3 | 84 |
| palevioletred2 | 66 |
| pink4 | 265 |
| plum1 | 140 |
| plum2 | 176 |
| sienna4 | 56 |
| violet | 375 |
2.1 Interesting Modules
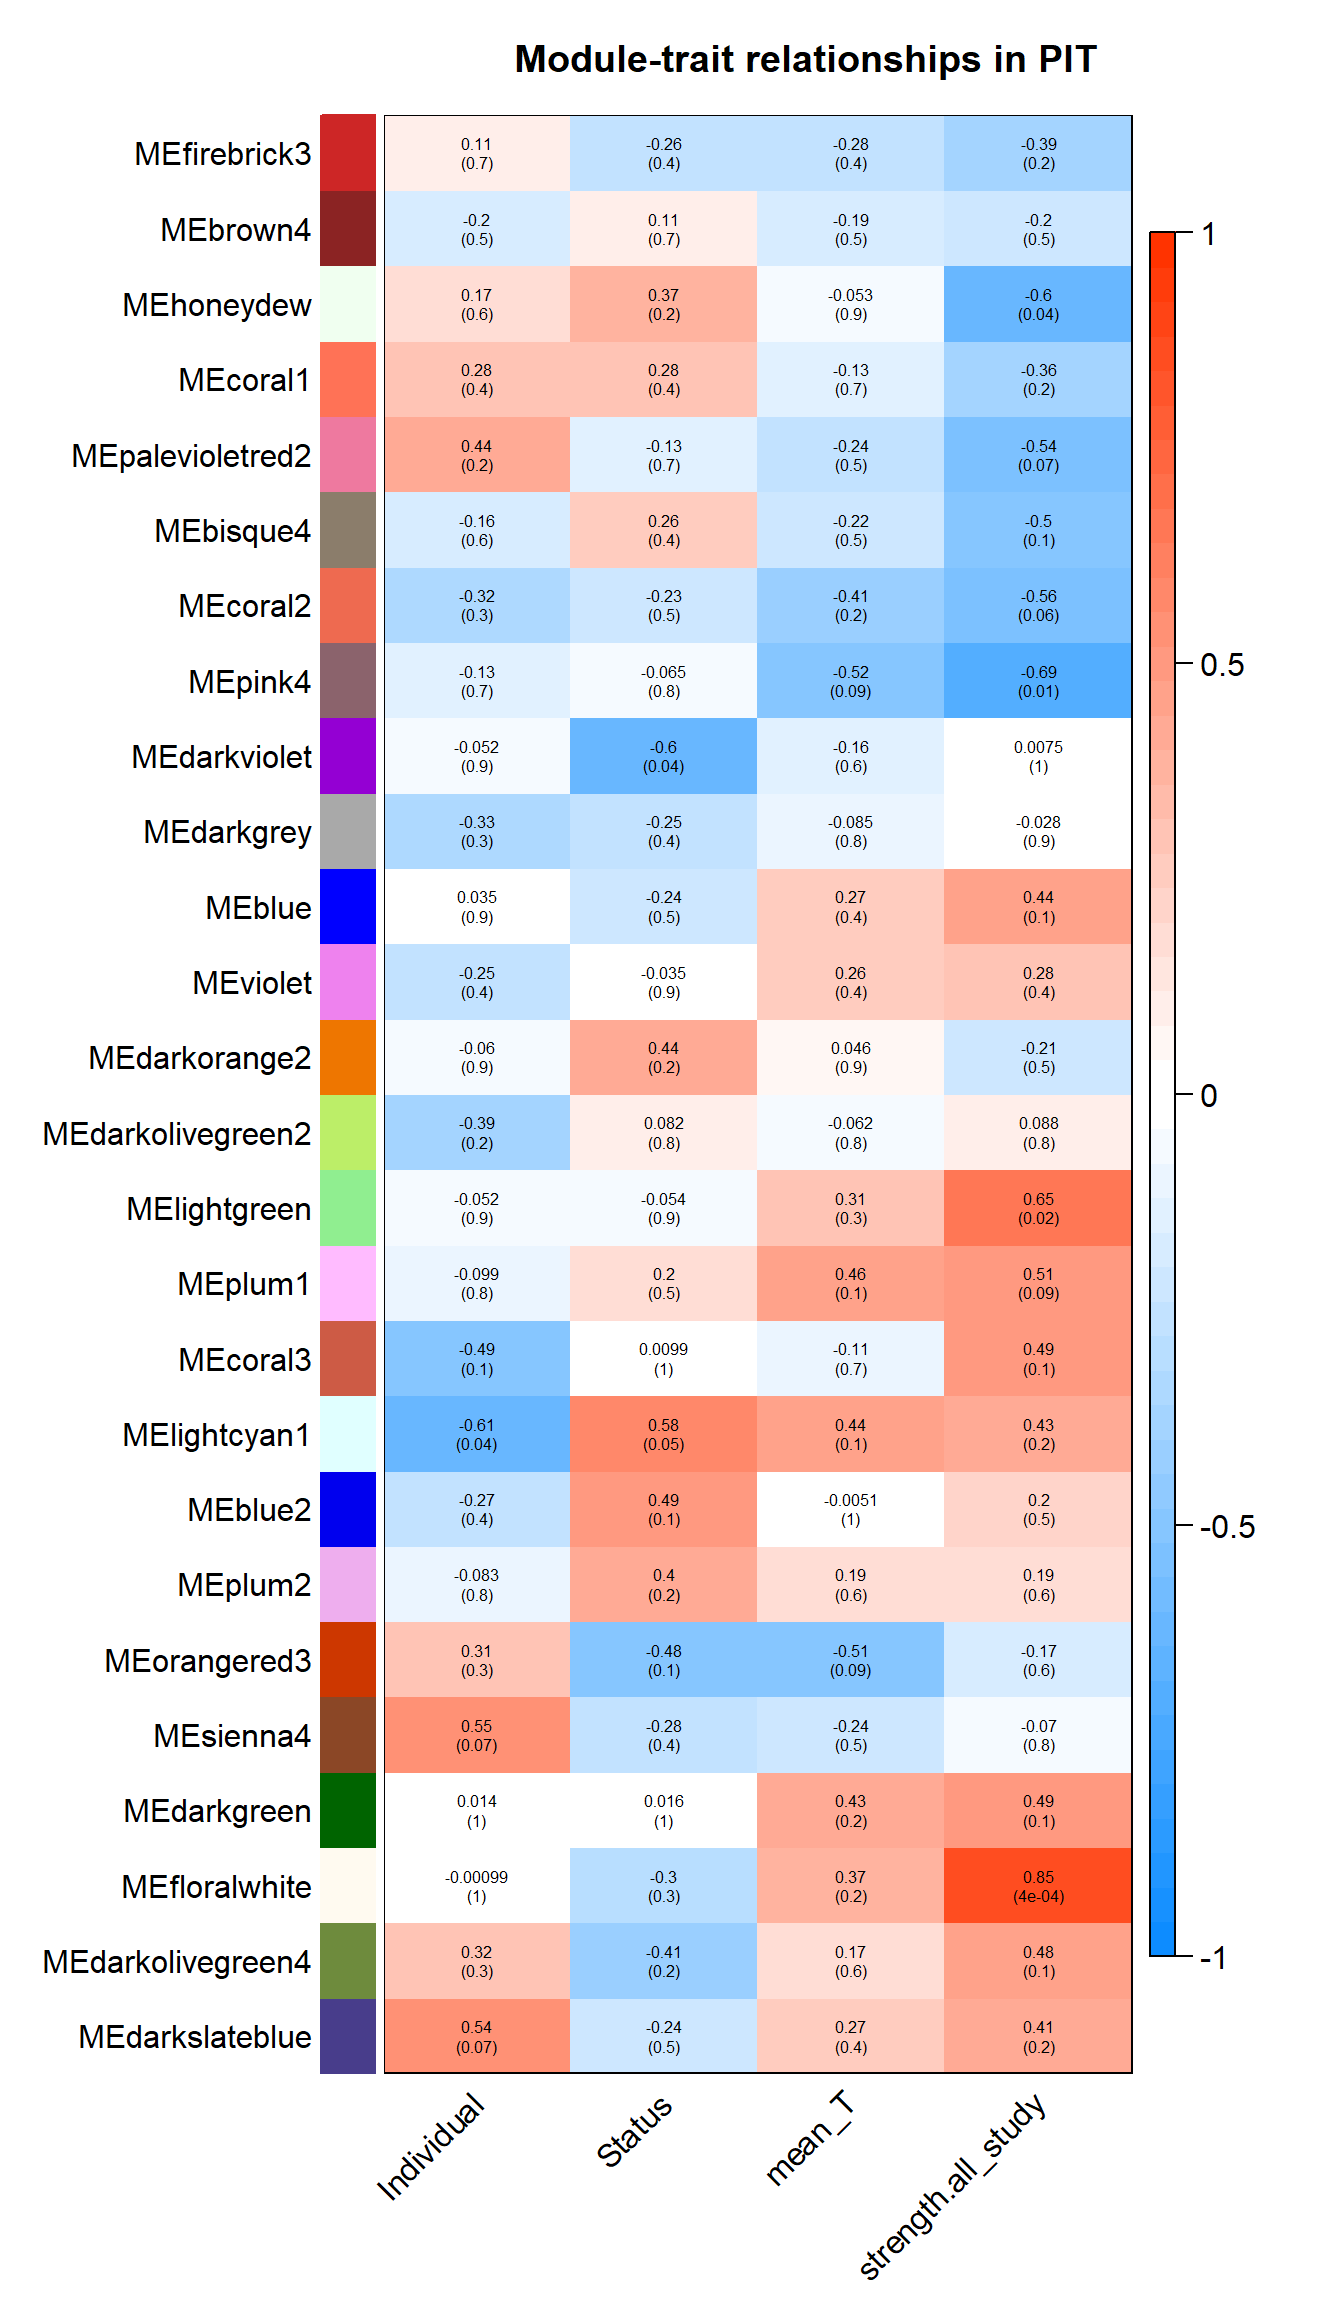
2.1.1 floralwhite module - strength
This module is associated with social network strength.
##  softConnectivity: FYI: connecitivty of genes with less than 4 valid samples will be returned as NA.
##  ..calculating connectivities..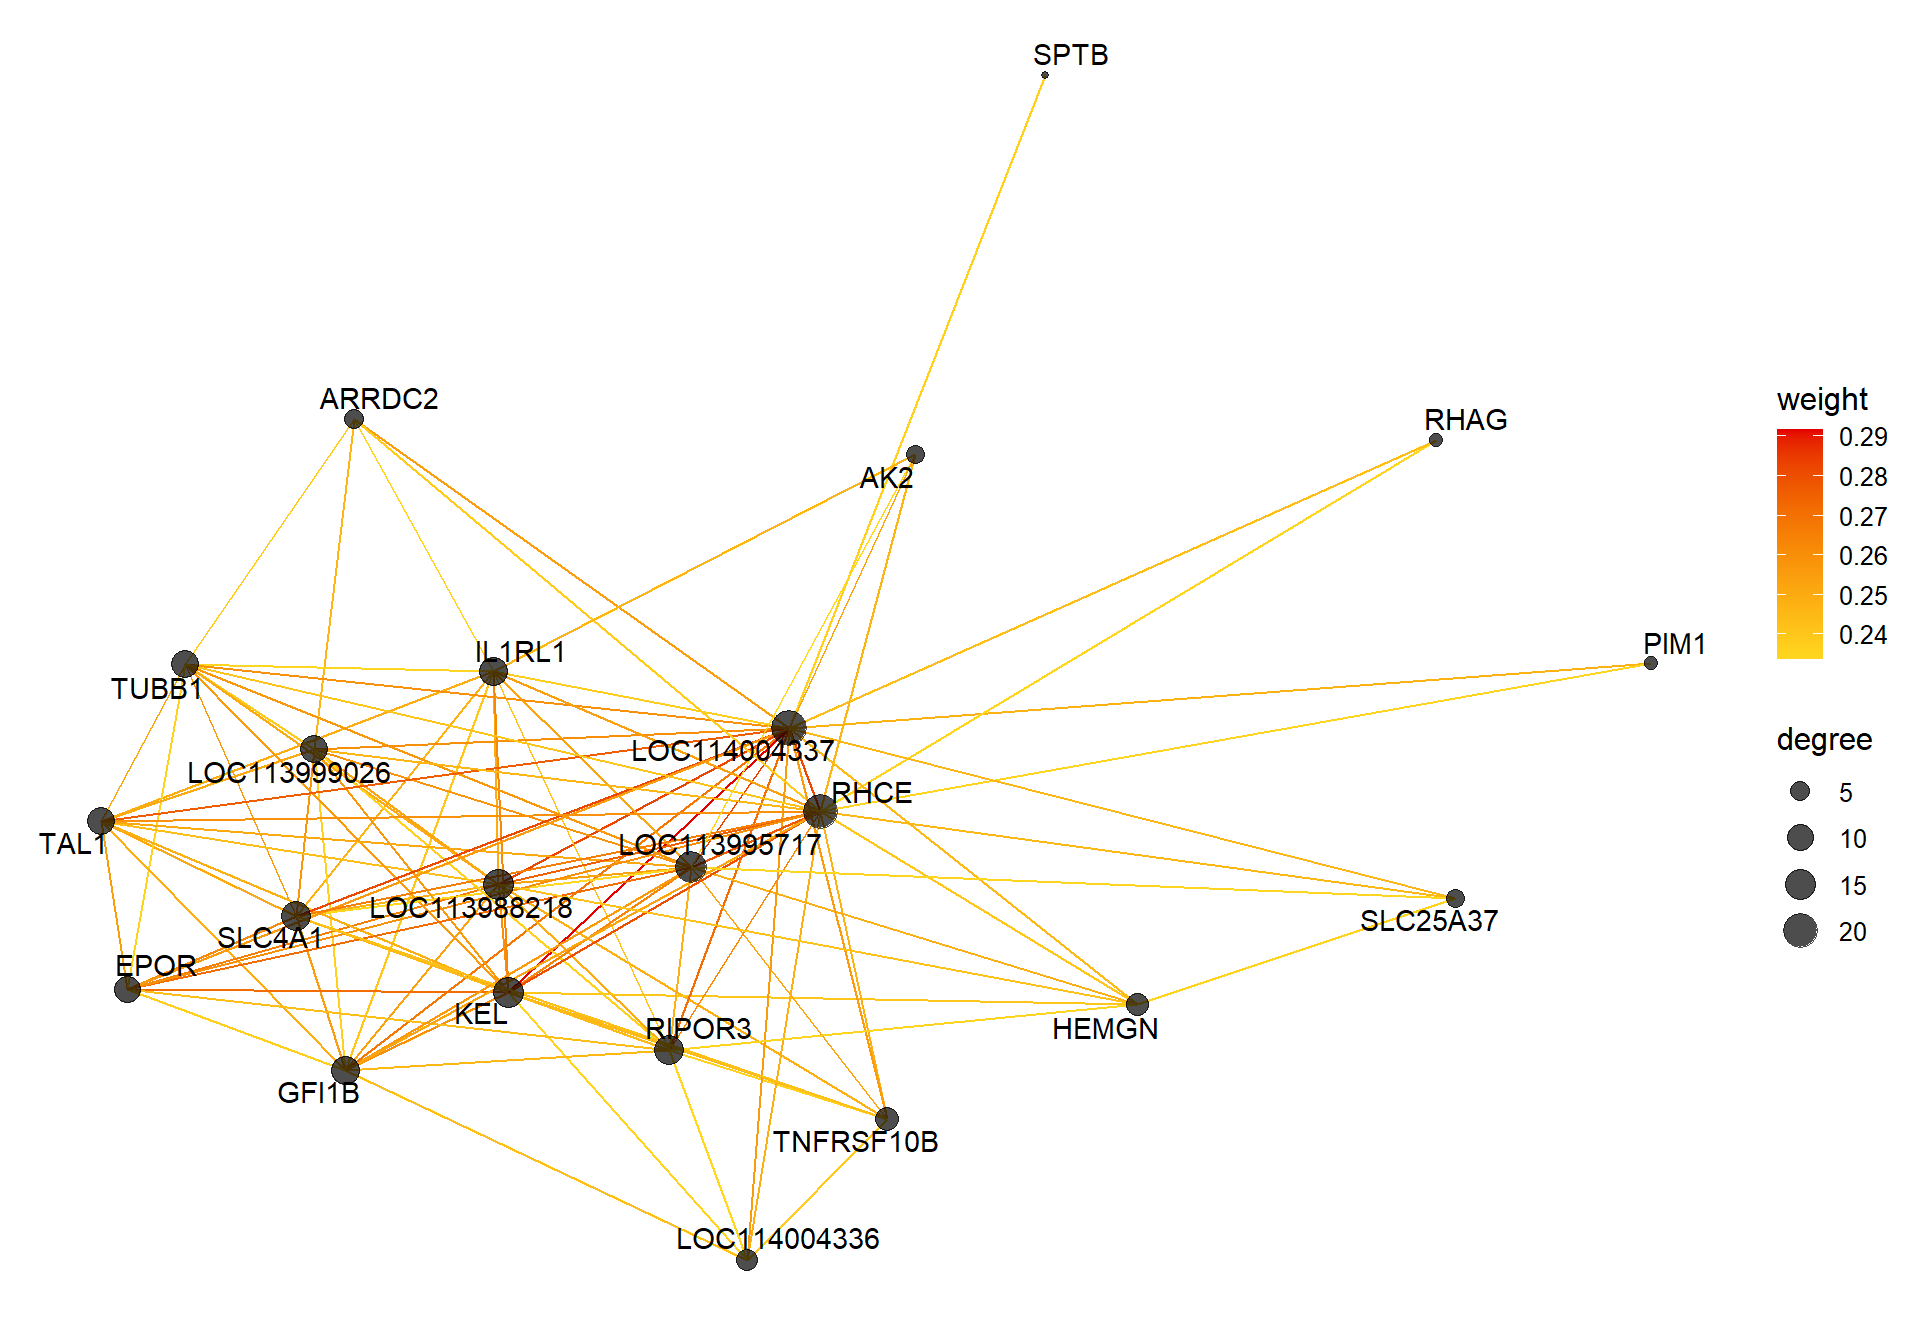
This module is too influenced by PFT3. This is a sample I removed in the DESeq2 analysis. Disregard.
2.1.2 pink4 module - strength
This module is also associated with social network strength
2.1.2.1 Gene Ontology
| ID | Description | GeneRatio | BgRatio | pvalue | p.adjust | qvalue | geneID | Count |
|---|---|---|---|---|---|---|---|---|
| GO:0007288 | sperm axoneme assembly | 4/214 | 20/12079 | 0.0003714 | 0.1318112 | 0.1312432 | ARMC2/CFAP206/SPEF2/TTLL1 | 4 |
| GO:0031647 | regulation of protein stability | 7/214 | 76/12079 | 0.0003854 | 0.1318112 | 0.1312432 | APTX/ATF7IP/DPM2/LOC113993664/MOSMO/PINX1/QRSL1 | 7 |
| GO:0006362 | transcription elongation from RNA polymerase I promoter | 3/214 | 23/12079 | 0.0074766 | 0.6320762 | 0.6293525 | CCNH/ERCC3/TAF1A | 3 |
| GO:0050821 | protein stabilization | 8/214 | 162/12079 | 0.0082095 | 0.6320762 | 0.6293525 | ATF7IP/CCNH/CCT6A/GAPDH/GTPBP4/MFSD1/NCLN/TBL1XR1 | 8 |
| GO:0006363 | termination of RNA polymerase I transcription | 3/214 | 24/12079 | 0.0084346 | 0.6320762 | 0.6293525 | CCNH/ERCC3/TAF1A | 3 |
| GO:0006890 | retrograde vesicle-mediated transport, Golgi to endoplasmic reticulum | 5/214 | 73/12079 | 0.0094384 | 0.6320762 | 0.6293525 | ARFGAP2/COPB1/KIFAP3/PITPNB/RINT1 | 5 |
| GO:0006361 | transcription initiation from RNA polymerase I promoter | 3/214 | 25/12079 | 0.0094614 | 0.6320762 | 0.6293525 | CCNH/ERCC3/TAF1A | 3 |
| GO:0006310 | DNA recombination | 4/214 | 51/12079 | 0.0125004 | 0.6320762 | 0.6293525 | ACTR8/KIN/LOC113982971/SUPV3L1 | 4 |
| GO:0000226 | microtubule cytoskeleton organization | 6/214 | 109/12079 | 0.0128965 | 0.6320762 | 0.6293525 | GAPDH/KNSTRN/MARK3/PRKCZ/TTLL1/TUBA8 | 6 |
| GO:0070085 | glycosylation | 2/214 | 11/12079 | 0.0154662 | 0.6320762 | 0.6293525 | B4GALT4/LOC113992792 | 2 |

## preparing gene to GO mapping data...## preparing IC data...## Warning in if (class(try(col2rgb(palette), silent = TRUE)) == "try-error")
## stop("color palette is not correct"): the condition has length > 1 and only the
## first element will be used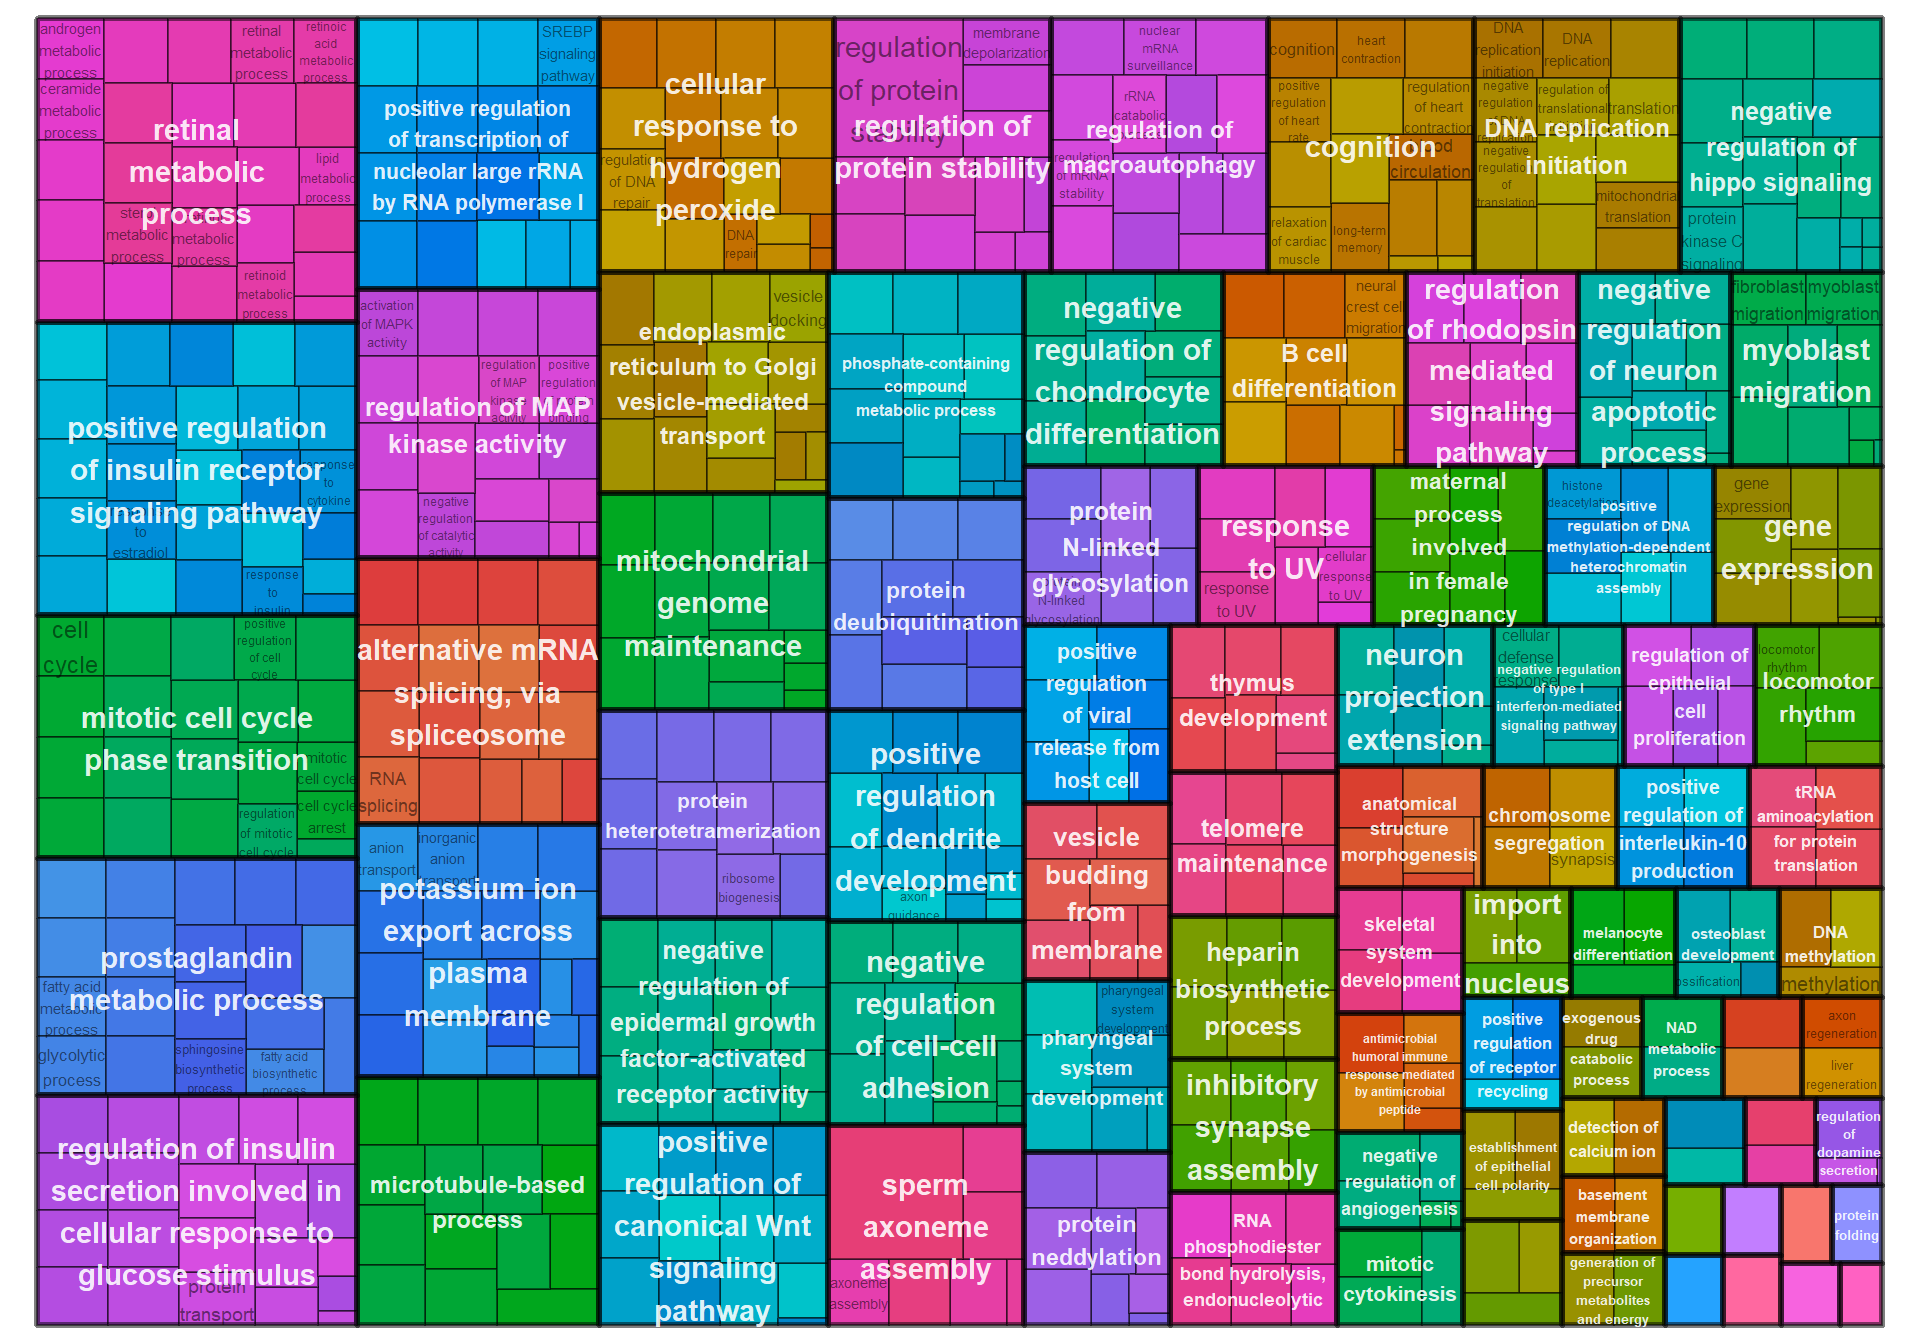
3 Ventromedial Hypothalamus (VMH)
## [1] 15223## Warning in DESeqDataSet(se, design = design, ignoreRank): some variables in
## design formula are characters, converting to factors## estimating size factors## estimating dispersions## gene-wise dispersion estimates## mean-dispersion relationship## final dispersion estimates## fitting model and testing## -- replacing outliers and refitting for 102 genes
## -- DESeq argument 'minReplicatesForReplace' = 7
## -- original counts are preserved in counts(dds)## estimating dispersions## fitting model and testing## Power SFT.R.sq slope truncated.R.sq mean.k. median.k. max.k.
## 1 1 0.008020 12.600 0.986 7610.0 7610.00 7770
## 2 2 0.000212 -0.471 0.940 4210.0 4200.00 4600
## 3 3 0.080100 -3.750 0.890 2500.0 2480.00 3050
## 4 4 0.196000 -3.140 0.903 1580.0 1550.00 2160
## 5 5 0.329000 -2.720 0.928 1040.0 1010.00 1600
## 6 6 0.473000 -2.710 0.949 715.0 686.00 1240
## 7 7 0.567000 -2.620 0.955 506.0 478.00 985
## 8 8 0.632000 -2.530 0.961 368.0 341.00 802
## 9 9 0.685000 -2.440 0.966 274.0 248.00 664
## 10 10 0.716000 -2.400 0.964 208.0 184.00 558
## 11 11 0.747000 -2.330 0.968 160.0 139.00 474
## 12 12 0.772000 -2.290 0.972 126.0 106.00 408
## 13 14 0.800000 -2.300 0.970 80.4 64.00 314
## 14 16 0.821000 -2.300 0.970 53.8 40.30 248
## 15 18 0.831000 -2.290 0.967 37.3 26.20 201
## 16 20 0.840000 -2.270 0.969 26.7 17.50 165
## 17 22 0.851000 -2.250 0.972 19.6 12.00 138
## 18 24 0.855000 -2.240 0.972 14.7 8.42 117
## 19 26 0.859000 -2.230 0.972 11.2 6.03 101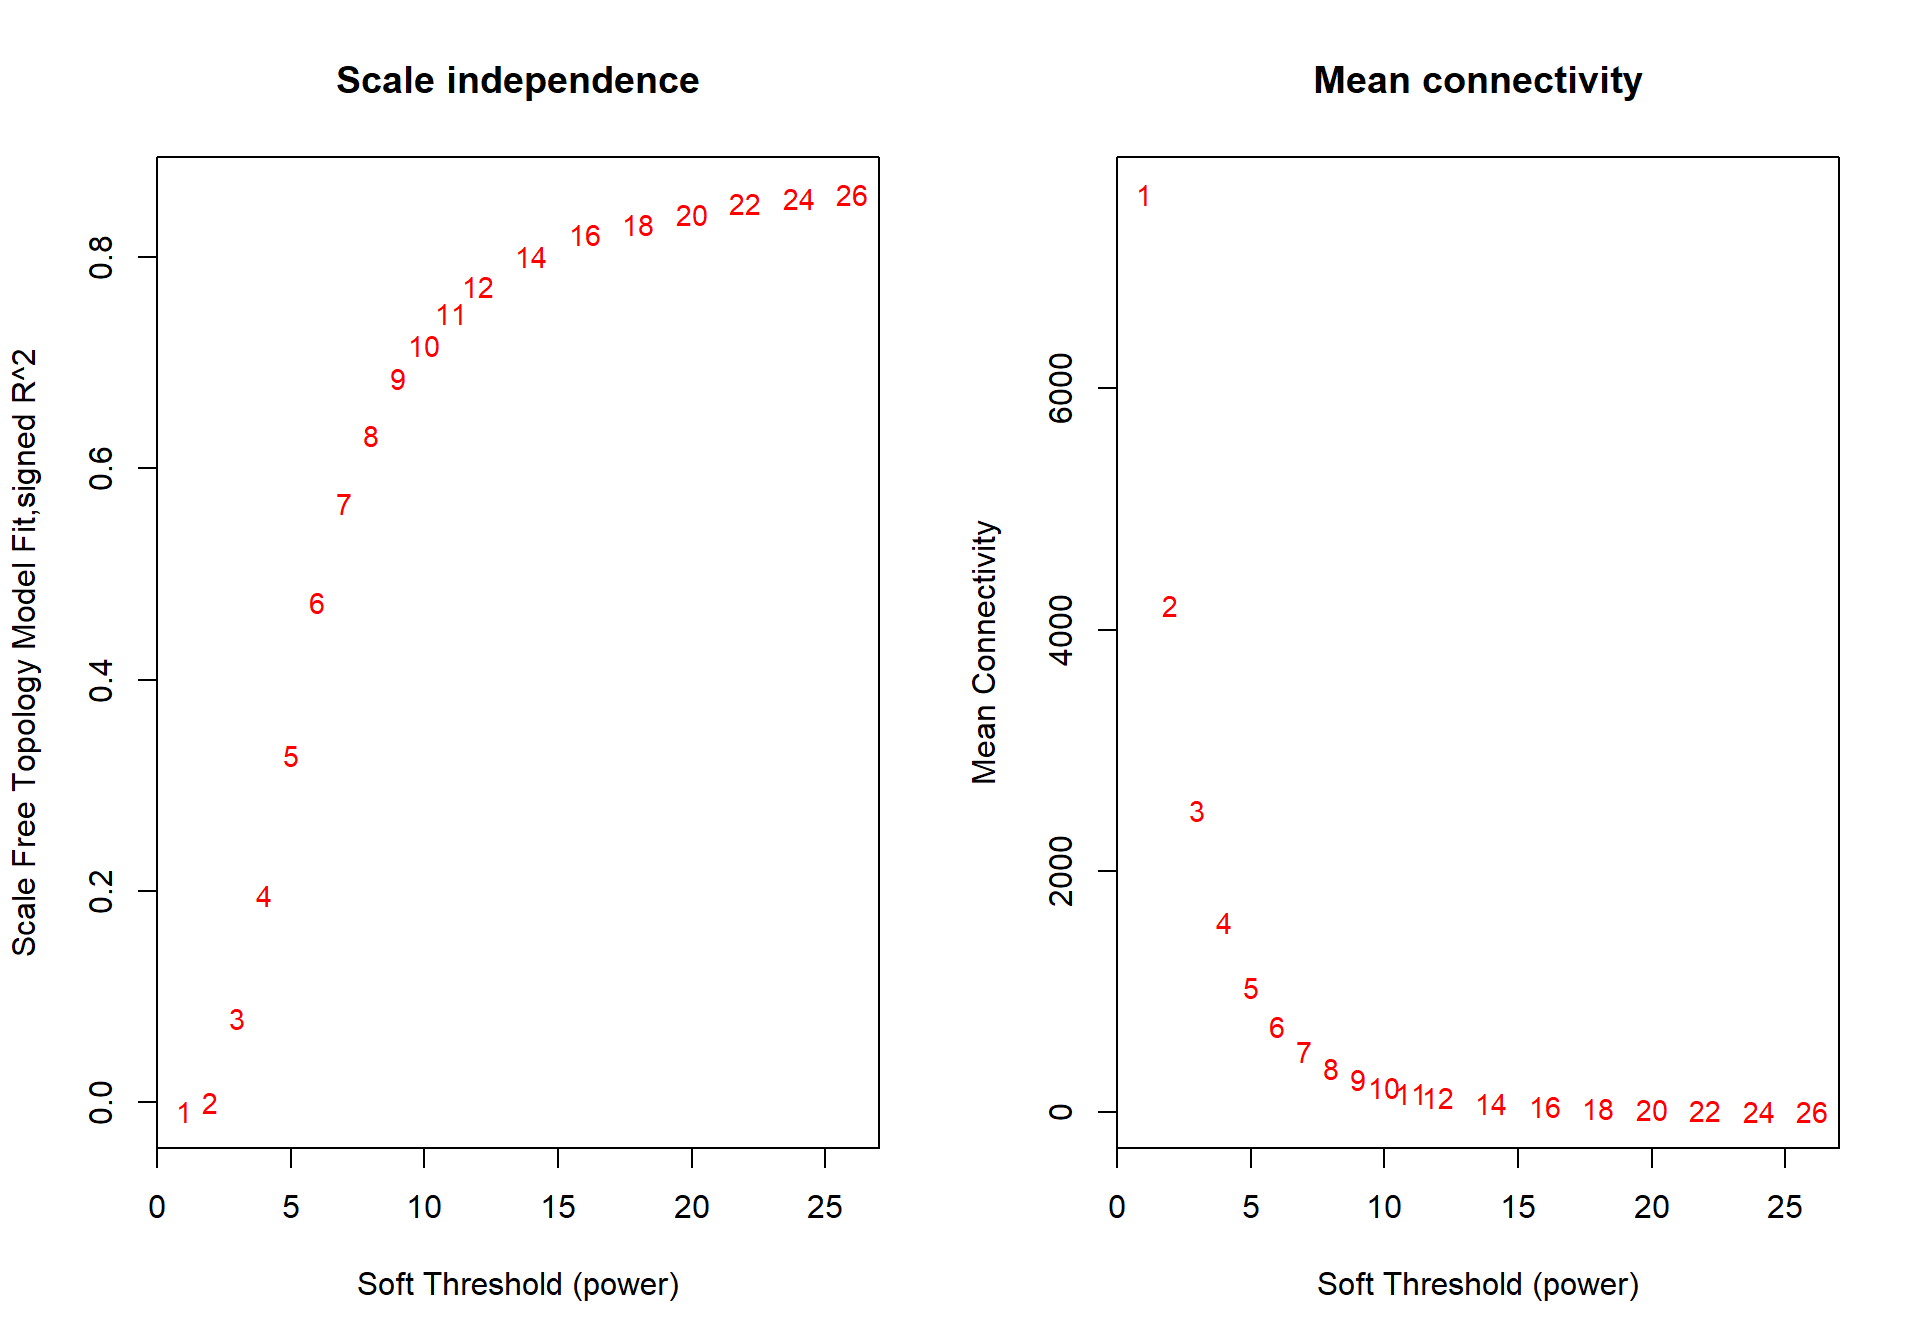
The soft-power selected for VMH is 18.
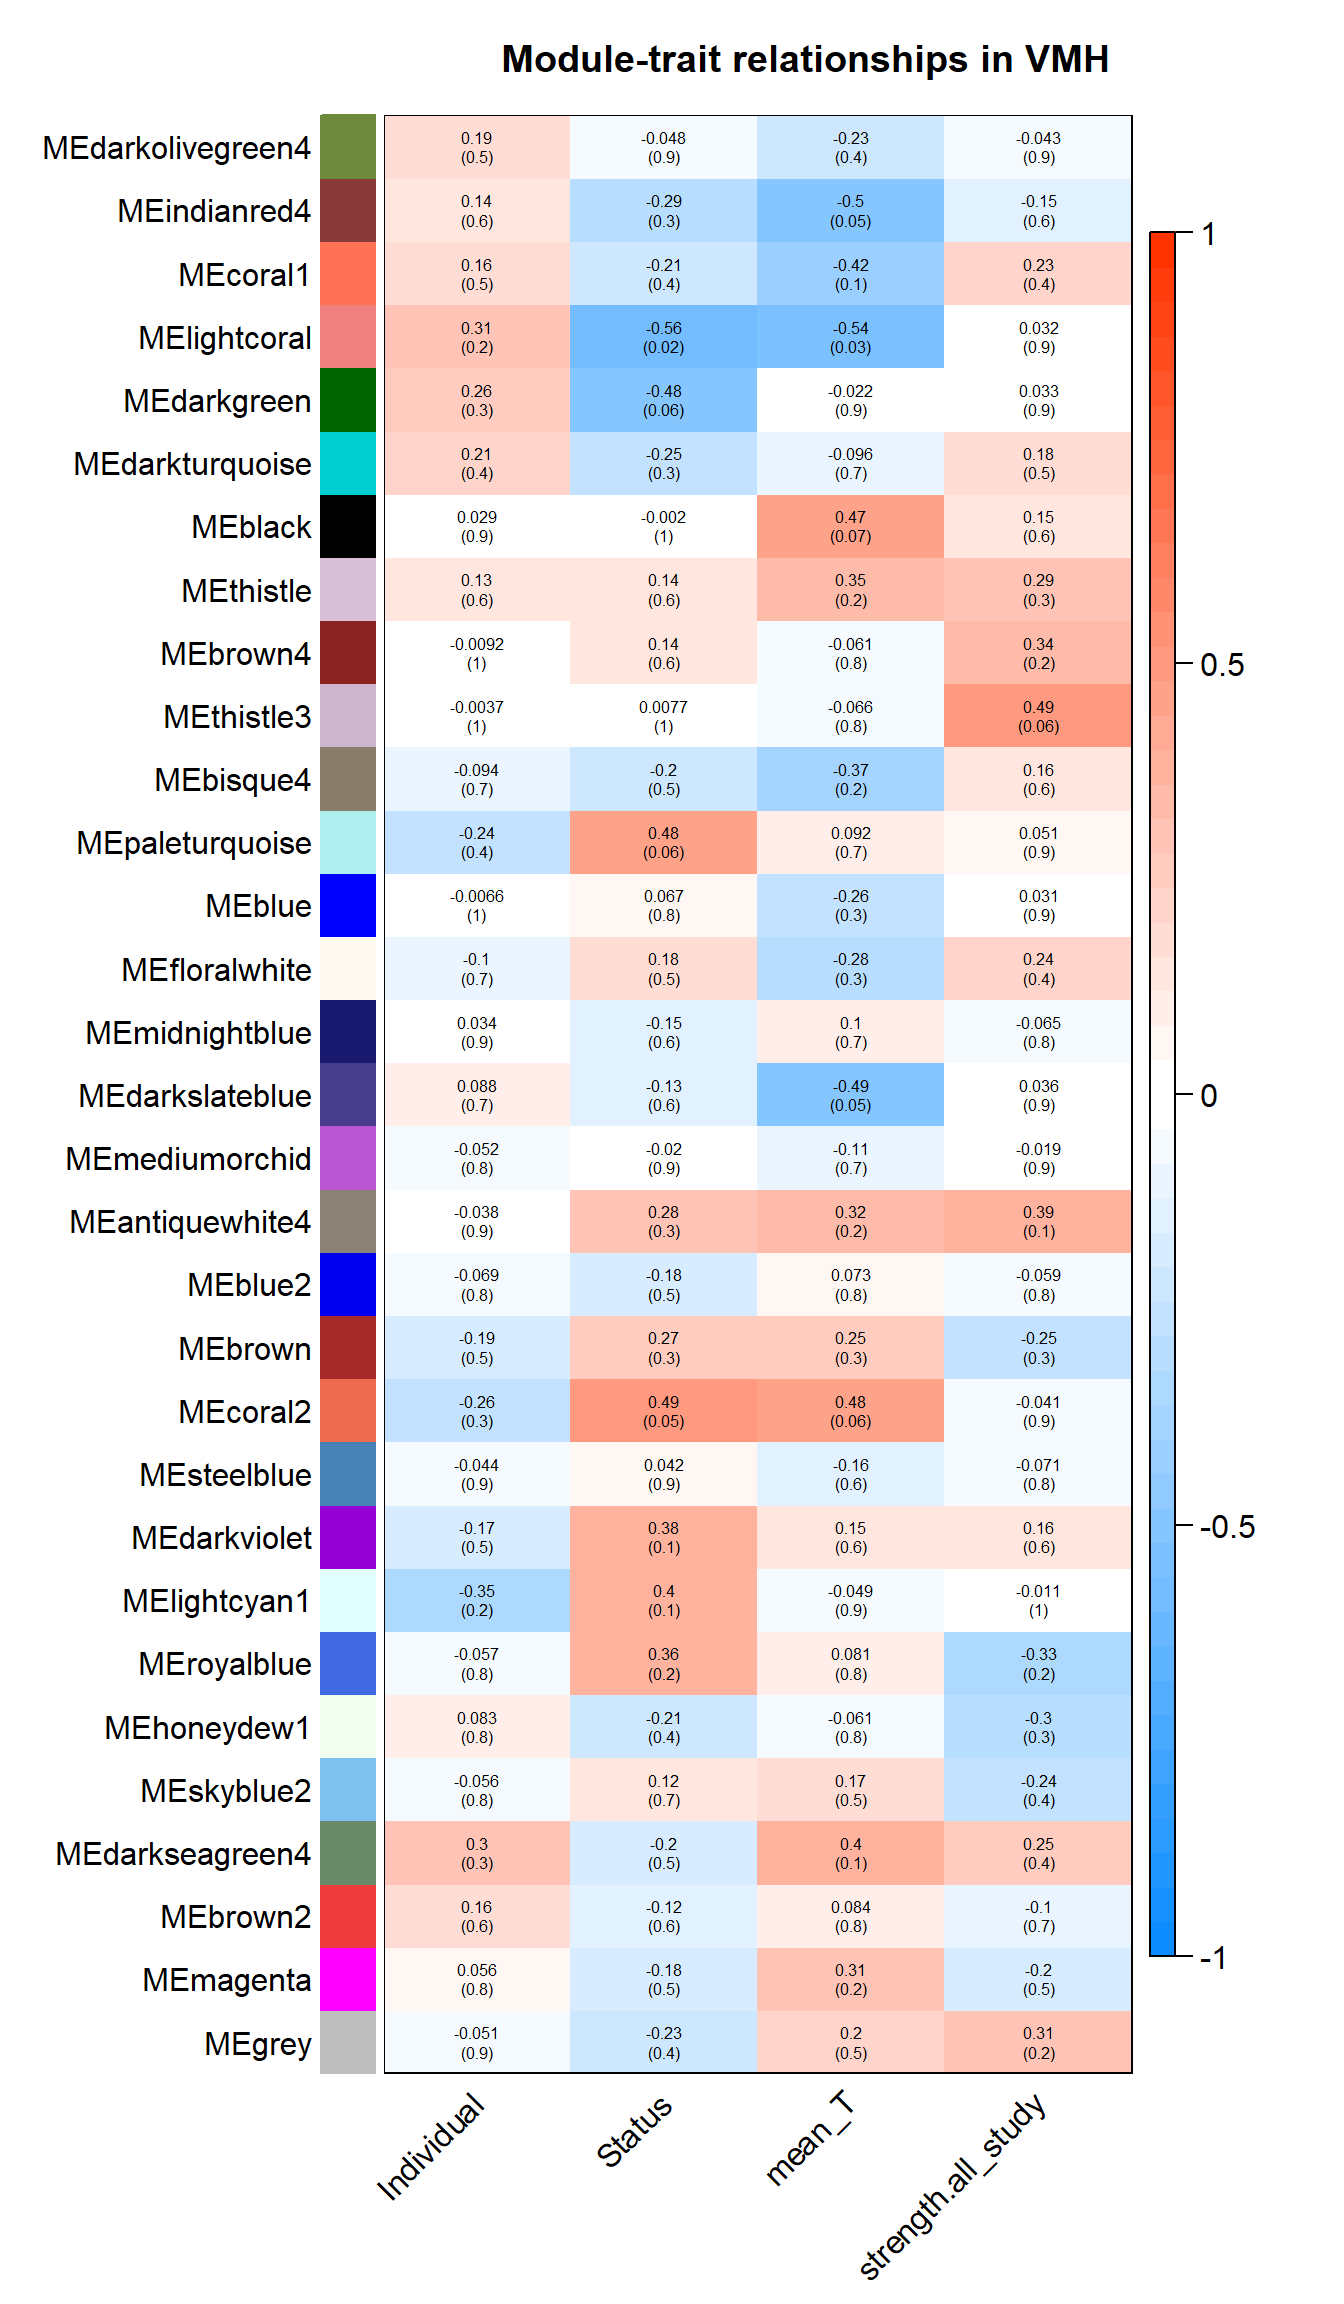
| moduleColors | Freq |
|---|---|
| antiquewhite4 | 223 |
| bisque4 | 103 |
| black | 590 |
| blue | 2088 |
| blue2 | 49 |
| brown | 2842 |
| brown2 | 50 |
| brown4 | 981 |
| coral1 | 1033 |
| coral2 | 125 |
| darkgreen | 901 |
| darkolivegreen4 | 51 |
| darkseagreen4 | 72 |
| darkslateblue | 99 |
| darkturquoise | 906 |
| darkviolet | 47 |
| floralwhite | 530 |
| grey | 1 |
| honeydew1 | 620 |
| indianred4 | 474 |
| lightcoral | 53 |
| lightcyan1 | 253 |
| magenta | 512 |
| mediumorchid | 65 |
| midnightblue | 1746 |
| paleturquoise | 292 |
| royalblue | 208 |
| skyblue2 | 63 |
| steelblue | 155 |
| thistle | 42 |
| thistle3 | 46 |
3.1 Interesting Modules
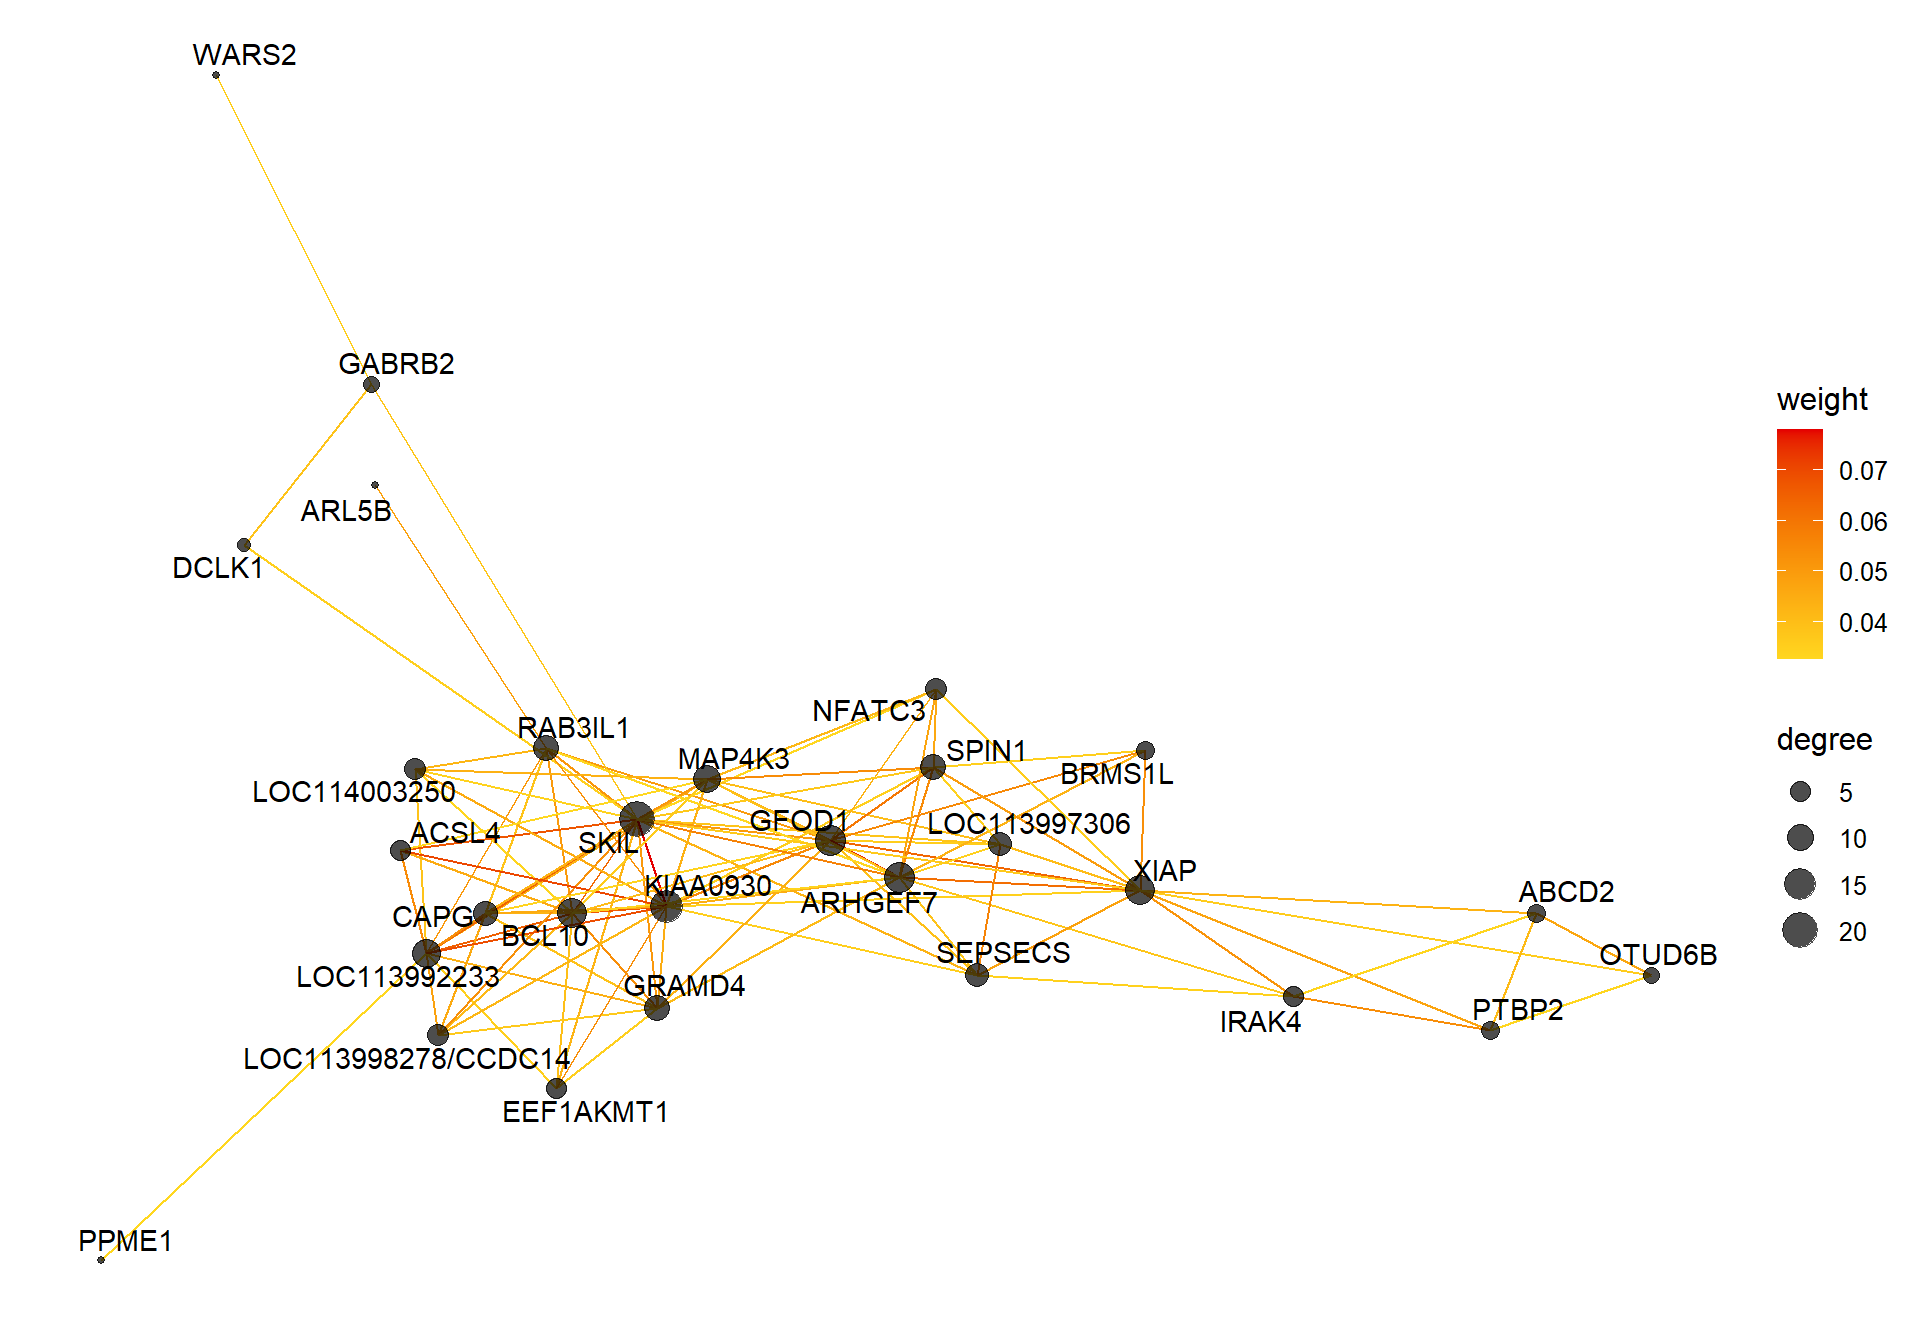
3.1.1 lightcoral module - Status/mean testosterone
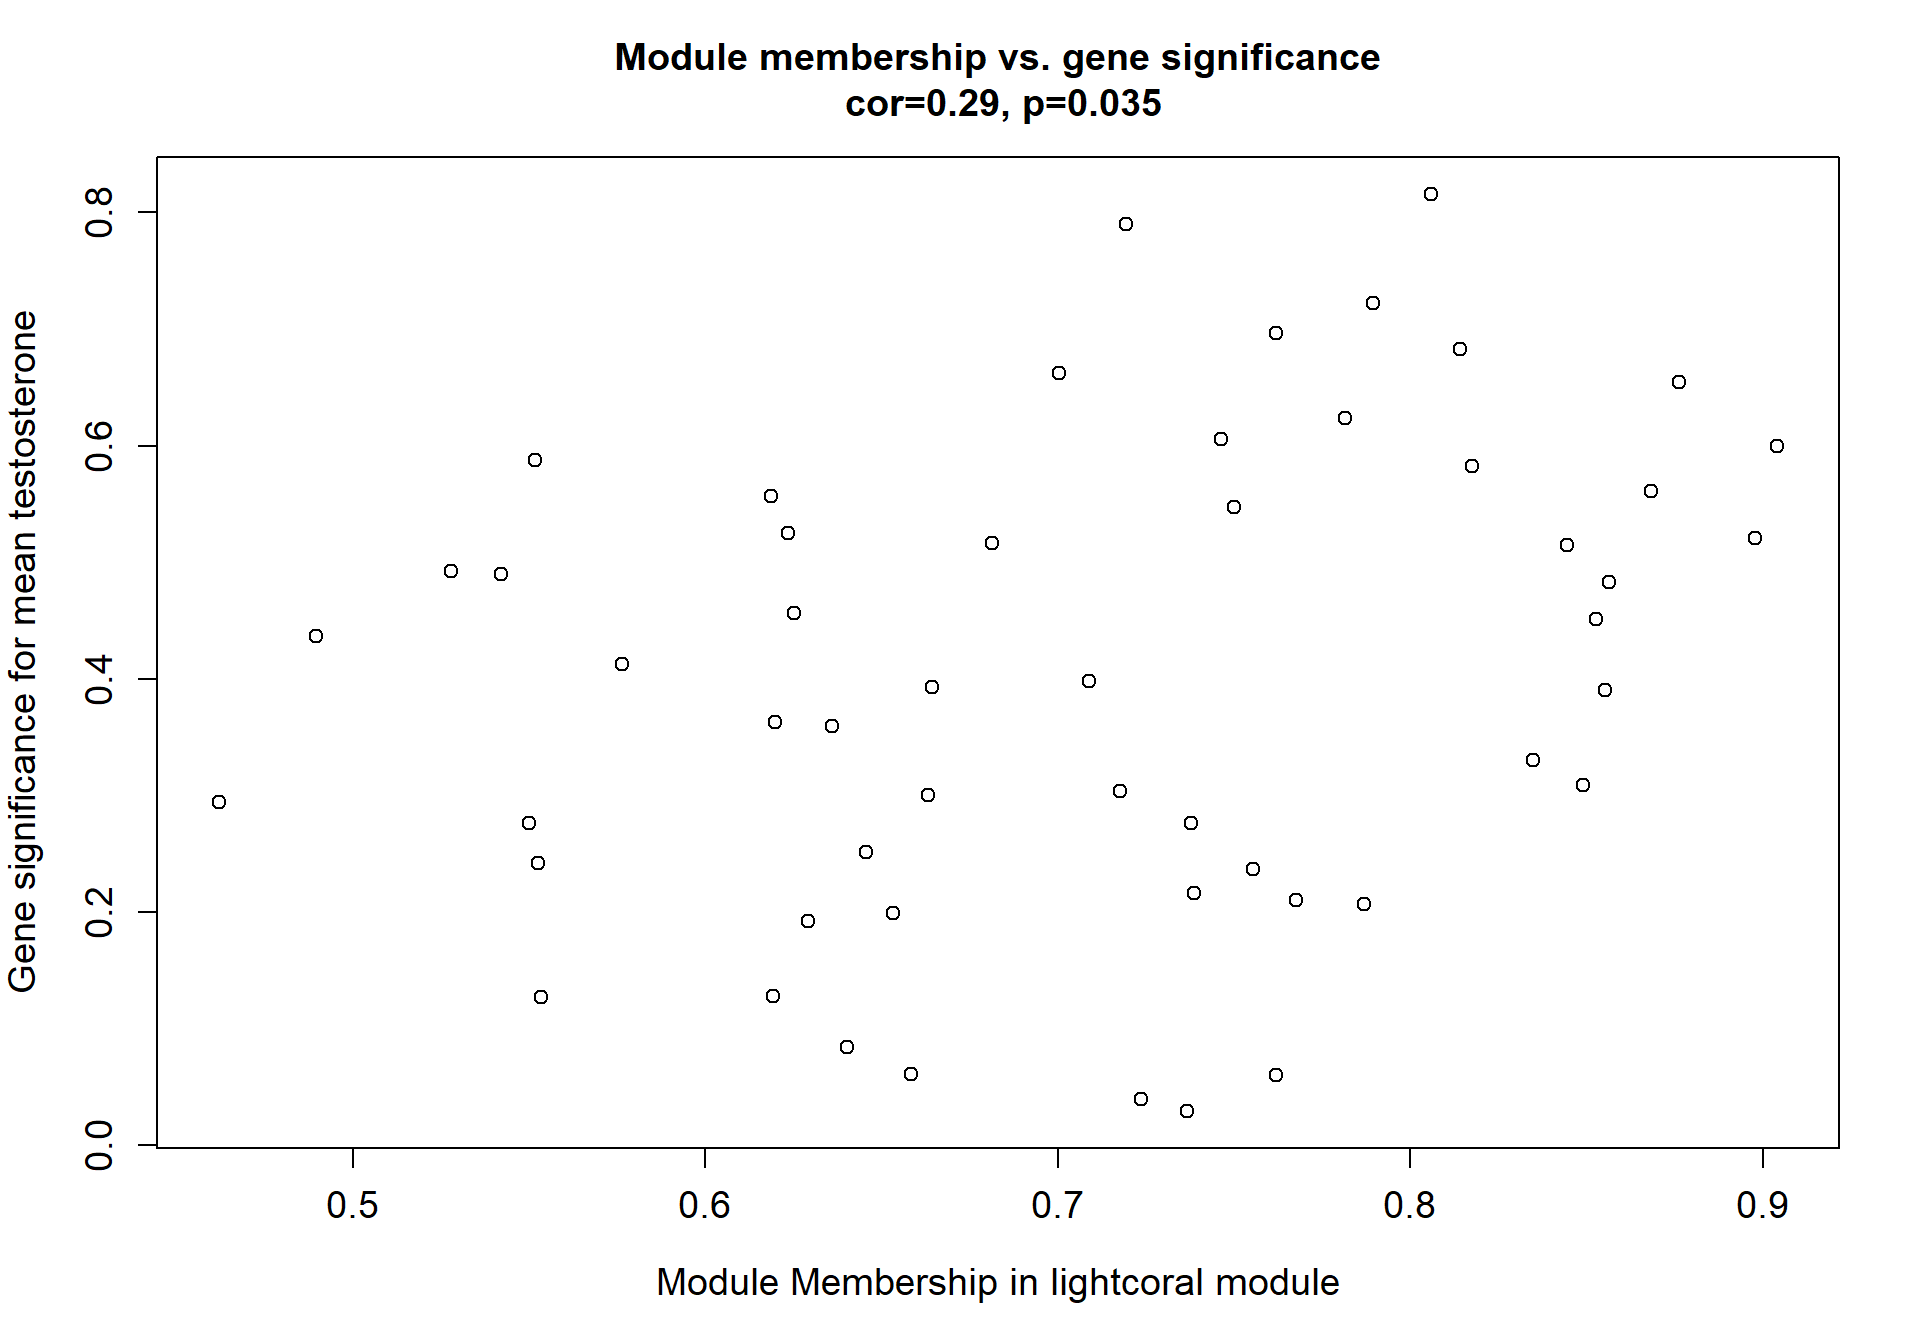
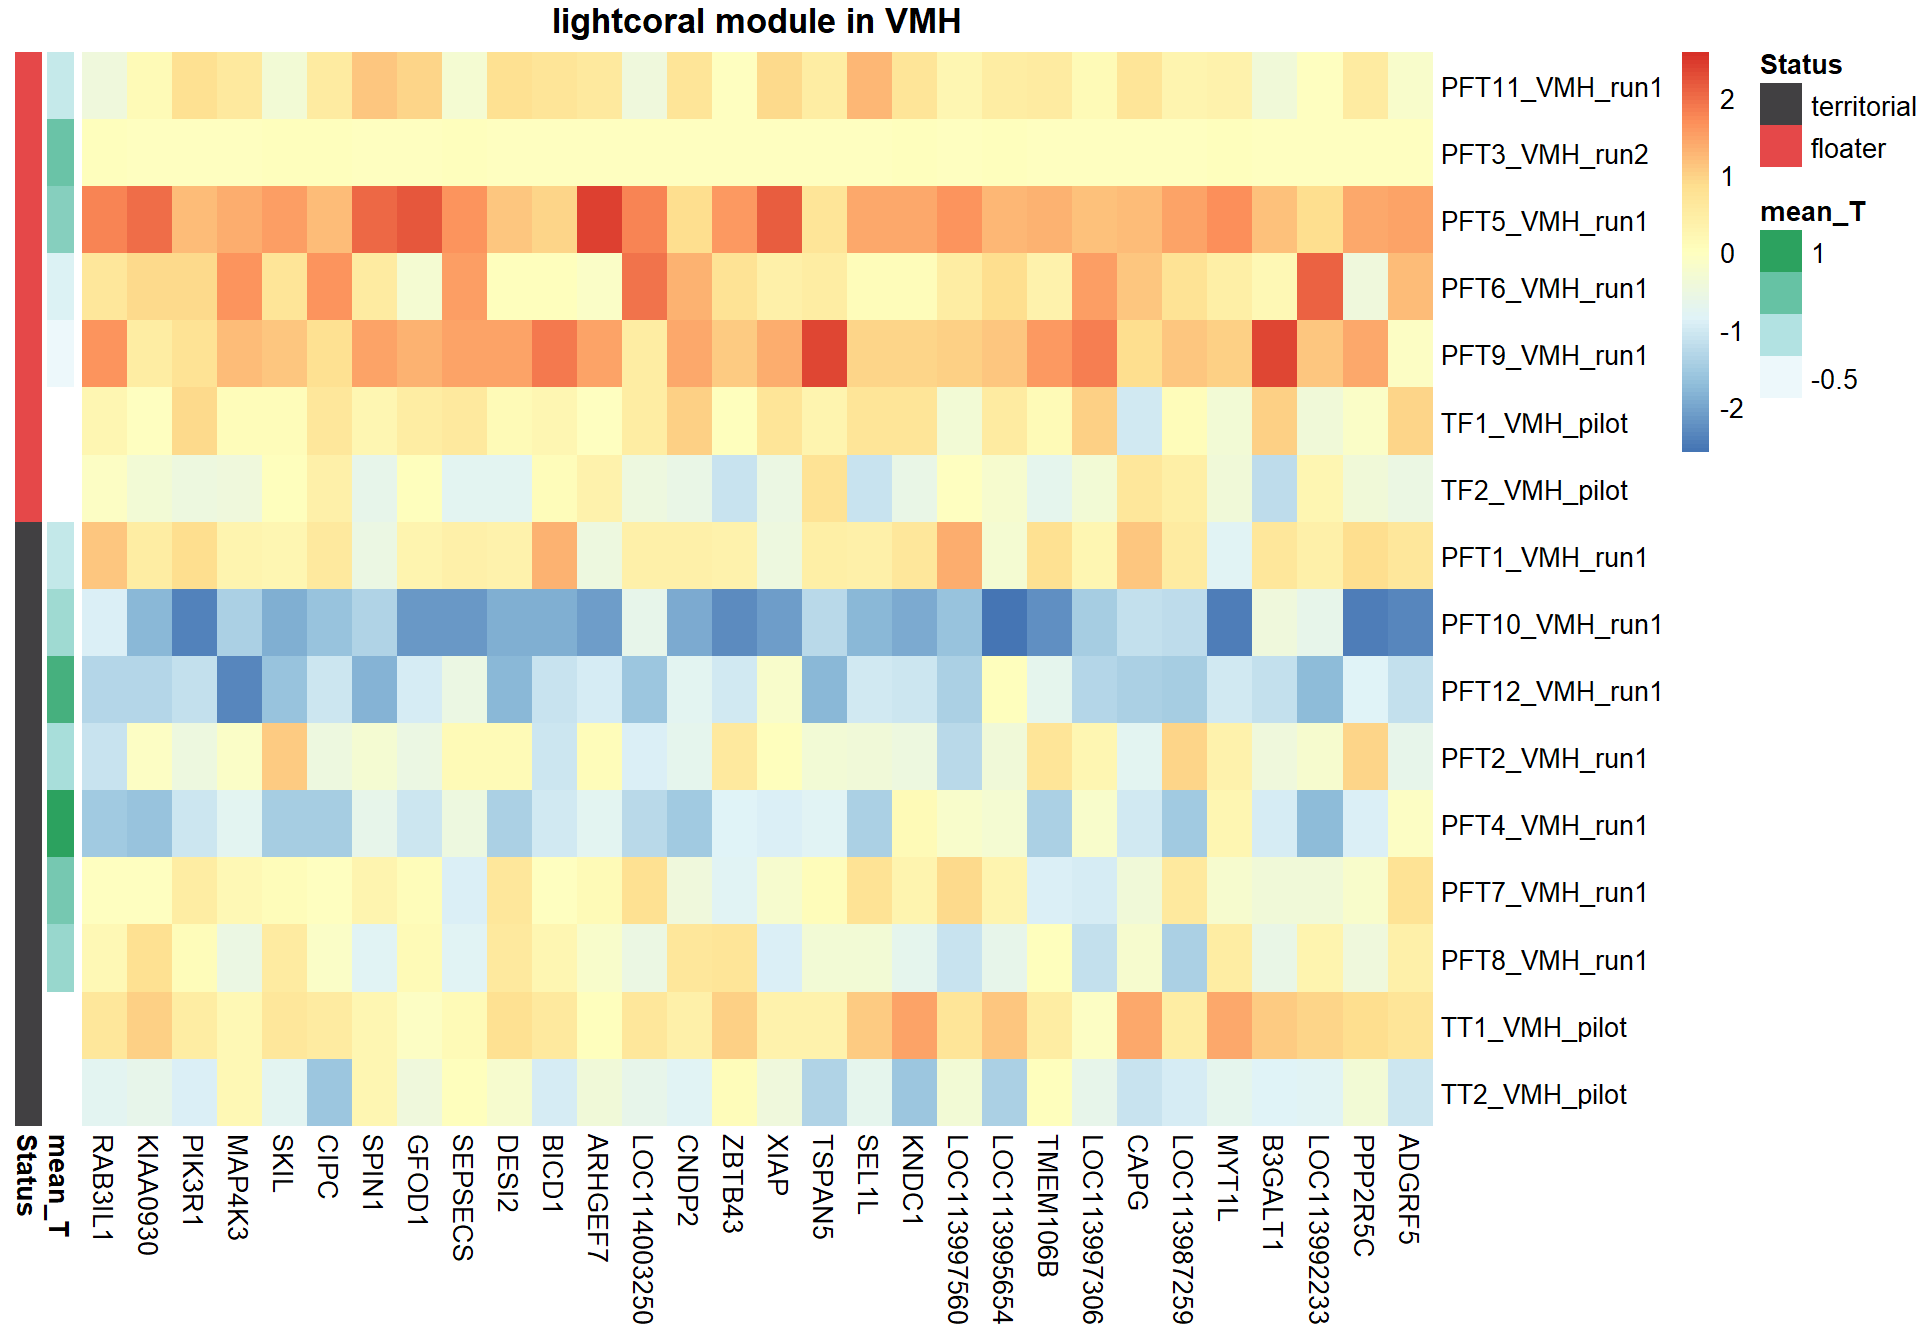
The top hub gene was not significantly associated with either mean_T or Status in the DESeq2 analysis.
3.1.1.1 Gene Ontology
| ID | Description | GeneRatio | BgRatio | pvalue | p.adjust | qvalue | geneID | Count |
|---|---|---|---|---|---|---|---|---|
| GO:0032094 | response to food | 2/45 | 15/12287 | 0.0013361 | 0.1789233 | 0.1543029 | BCL10/OPRM1 | 2 |
| GO:0008154 | actin polymerization or depolymerization | 2/45 | 16/12287 | 0.0015234 | 0.1789233 | 0.1543029 | CAPG/WASL | 2 |
| GO:0001676 | long-chain fatty acid metabolic process | 2/45 | 19/12287 | 0.0021557 | 0.1789233 | 0.1543029 | ACAD9/ACSL4 | 2 |
| GO:2000310 | regulation of NMDA receptor activity | 2/45 | 31/12287 | 0.0057008 | 0.2080429 | 0.1794156 | LOC113983406/OPRM1 | 2 |
| GO:0002224 | toll-like receptor signaling pathway | 2/45 | 33/12287 | 0.0064432 | 0.2080429 | 0.1794156 | BCL10/IRAK4 | 2 |
| GO:0043280 | positive regulation of cysteine-type endopeptidase activity involved in apoptotic process | 2/45 | 36/12287 | 0.0076346 | 0.2080429 | 0.1794156 | BCL10/GRAMD4 | 2 |
| GO:0007254 | JNK cascade | 2/45 | 39/12287 | 0.0089175 | 0.2080429 | 0.1794156 | IRAK4/MAP4K3 | 2 |
| GO:0016192 | vesicle-mediated transport | 3/45 | 130/12287 | 0.0118818 | 0.2080429 | 0.1794156 | ARL5B/LOC113995129/LOC113998023 | 3 |
| GO:0051056 | regulation of small GTPase mediated signal transduction | 3/45 | 140/12287 | 0.0144937 | 0.2080429 | 0.1794156 | ARHGEF7/LOC113995129/LOC113998023 | 3 |
| GO:0001843 | neural tube closure | 2/45 | 66/12287 | 0.0242541 | 0.2080429 | 0.1794156 | BCL10/SEC24B | 2 |
## preparing gene to GO mapping data...## preparing IC data...## Warning in if (class(try(col2rgb(palette), silent = TRUE)) == "try-error")
## stop("color palette is not correct"): the condition has length > 1 and only the
## first element will be used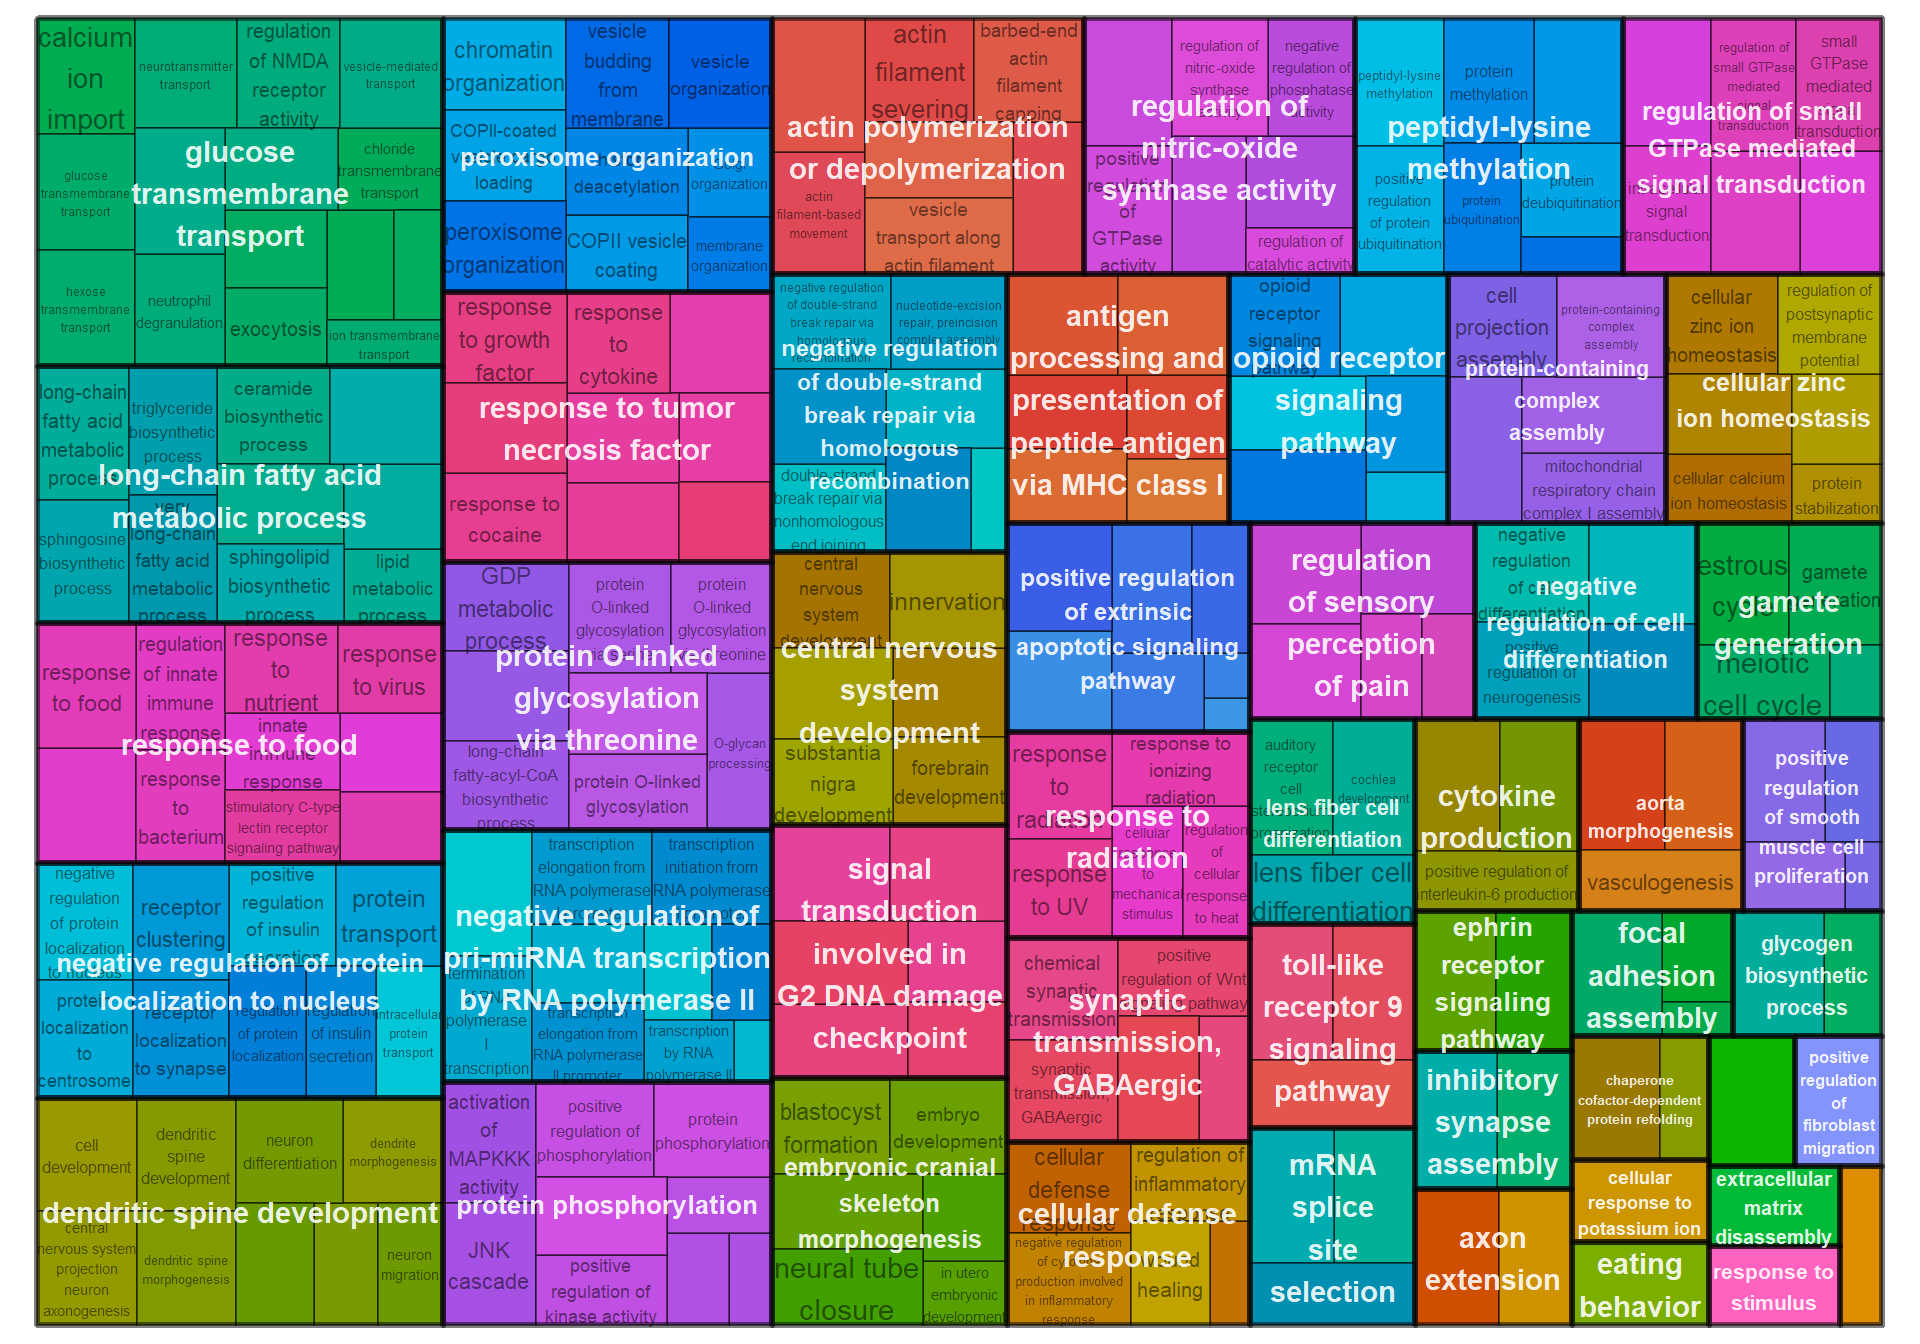
4 Anterior Hypothalamus (AH)
## [1] 14928## estimating size factors## estimating dispersions## gene-wise dispersion estimates## mean-dispersion relationship## final dispersion estimates## fitting model and testing## Power SFT.R.sq slope truncated.R.sq mean.k. median.k. max.k.
## 1 1 0.000105 -2.410 0.986 7460.0 7460.0 7550
## 2 2 0.065400 4.700 0.810 4330.0 4330.0 4730
## 3 3 0.052000 1.330 0.796 2760.0 2760.0 3340
## 4 4 0.003500 -0.203 0.819 1880.0 1880.0 2550
## 5 5 0.077200 -0.705 0.850 1350.0 1340.0 2050
## 6 6 0.196000 -0.959 0.881 1000.0 989.0 1700
## 7 7 0.324000 -1.130 0.906 768.0 749.0 1440
## 8 8 0.429000 -1.250 0.925 603.0 579.0 1240
## 9 9 0.510000 -1.340 0.940 483.0 455.0 1090
## 10 10 0.577000 -1.420 0.945 393.0 364.0 967
## 11 11 0.632000 -1.490 0.953 325.0 295.0 866
## 12 12 0.666000 -1.550 0.954 272.0 241.0 781
## 13 14 0.724000 -1.620 0.965 196.0 166.0 648
## 14 16 0.761000 -1.680 0.970 147.0 118.0 549
## 15 18 0.792000 -1.730 0.976 113.0 85.8 472
## 16 20 0.808000 -1.770 0.977 88.7 63.9 411
## 17 22 0.821000 -1.800 0.978 71.0 48.6 362
## 18 24 0.833000 -1.820 0.982 57.8 37.5 321
## 19 26 0.833000 -1.850 0.979 47.6 29.4 288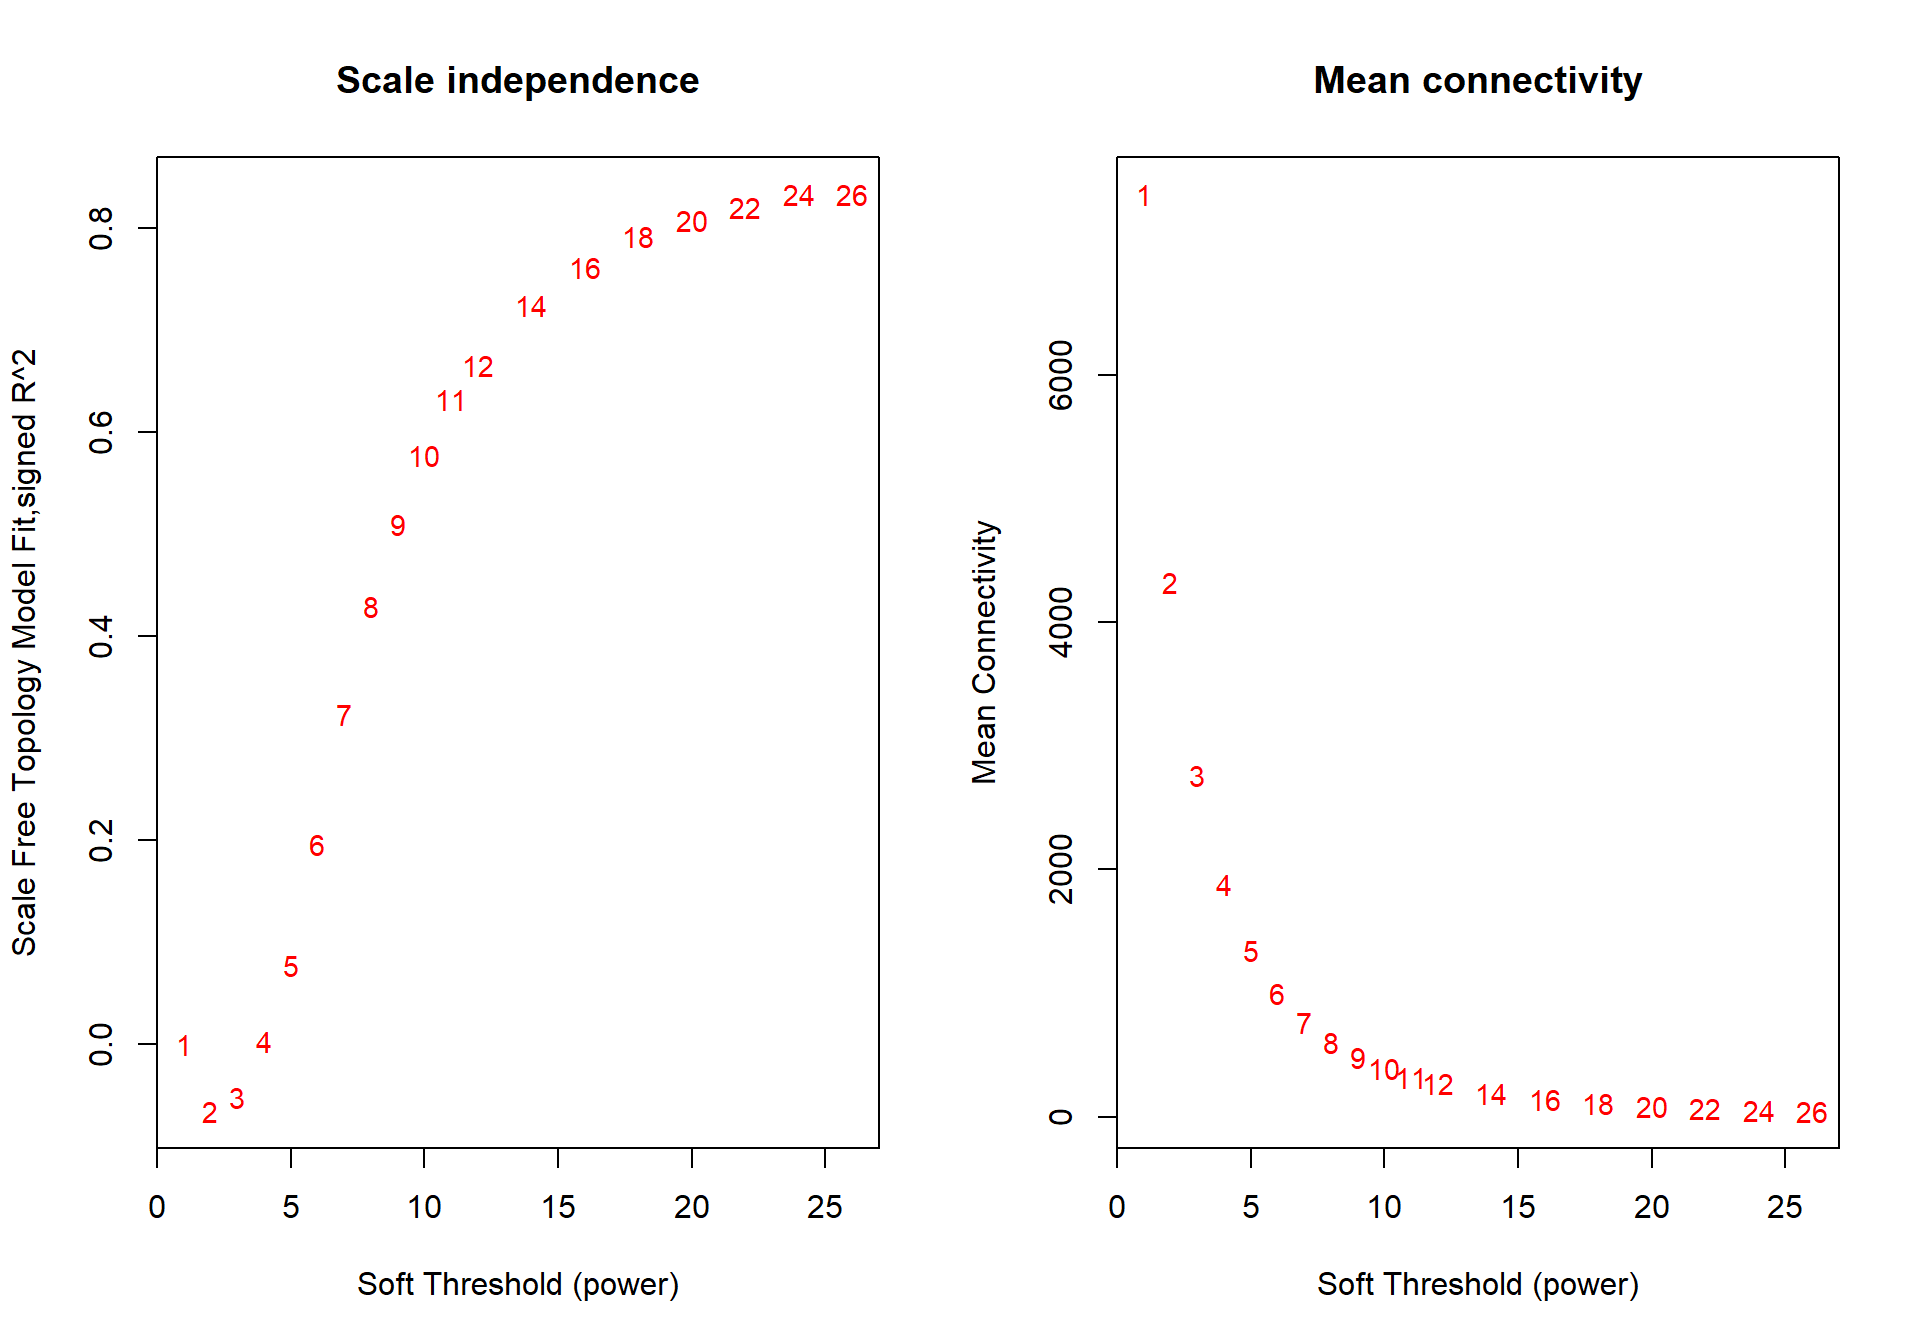
The soft-power selected for AH is 18.
| moduleColors | Freq |
|---|---|
| antiquewhite2 | 63 |
| antiquewhite4 | 2152 |
| bisque4 | 383 |
| blue2 | 1283 |
| blue4 | 141 |
| blueviolet | 239 |
| coral3 | 63 |
| darkmagenta | 131 |
| darkolivegreen2 | 193 |
| darkolivegreen4 | 147 |
| darkseagreen3 | 1754 |
| darkslateblue | 107 |
| darkviolet | 578 |
| firebrick3 | 417 |
| firebrick4 | 72 |
| greenyellow | 1308 |
| honeydew1 | 178 |
| indianred3 | 120 |
| lavenderblush2 | 64 |
| lightcyan | 310 |
| lightpink2 | 41 |
| lightslateblue | 152 |
| magenta4 | 123 |
| maroon | 96 |
| mediumpurple1 | 56 |
| mediumpurple2 | 75 |
| navajowhite | 104 |
| orangered4 | 1148 |
| plum | 317 |
| plum4 | 49 |
| royalblue | 2177 |
| salmon1 | 45 |
| skyblue2 | 86 |
| tan | 469 |
| violet | 137 |
| yellow3 | 62 |
| yellow4 | 86 |
4.1 Interesting Modules
4.1.1 mediumpurple1 module - Status
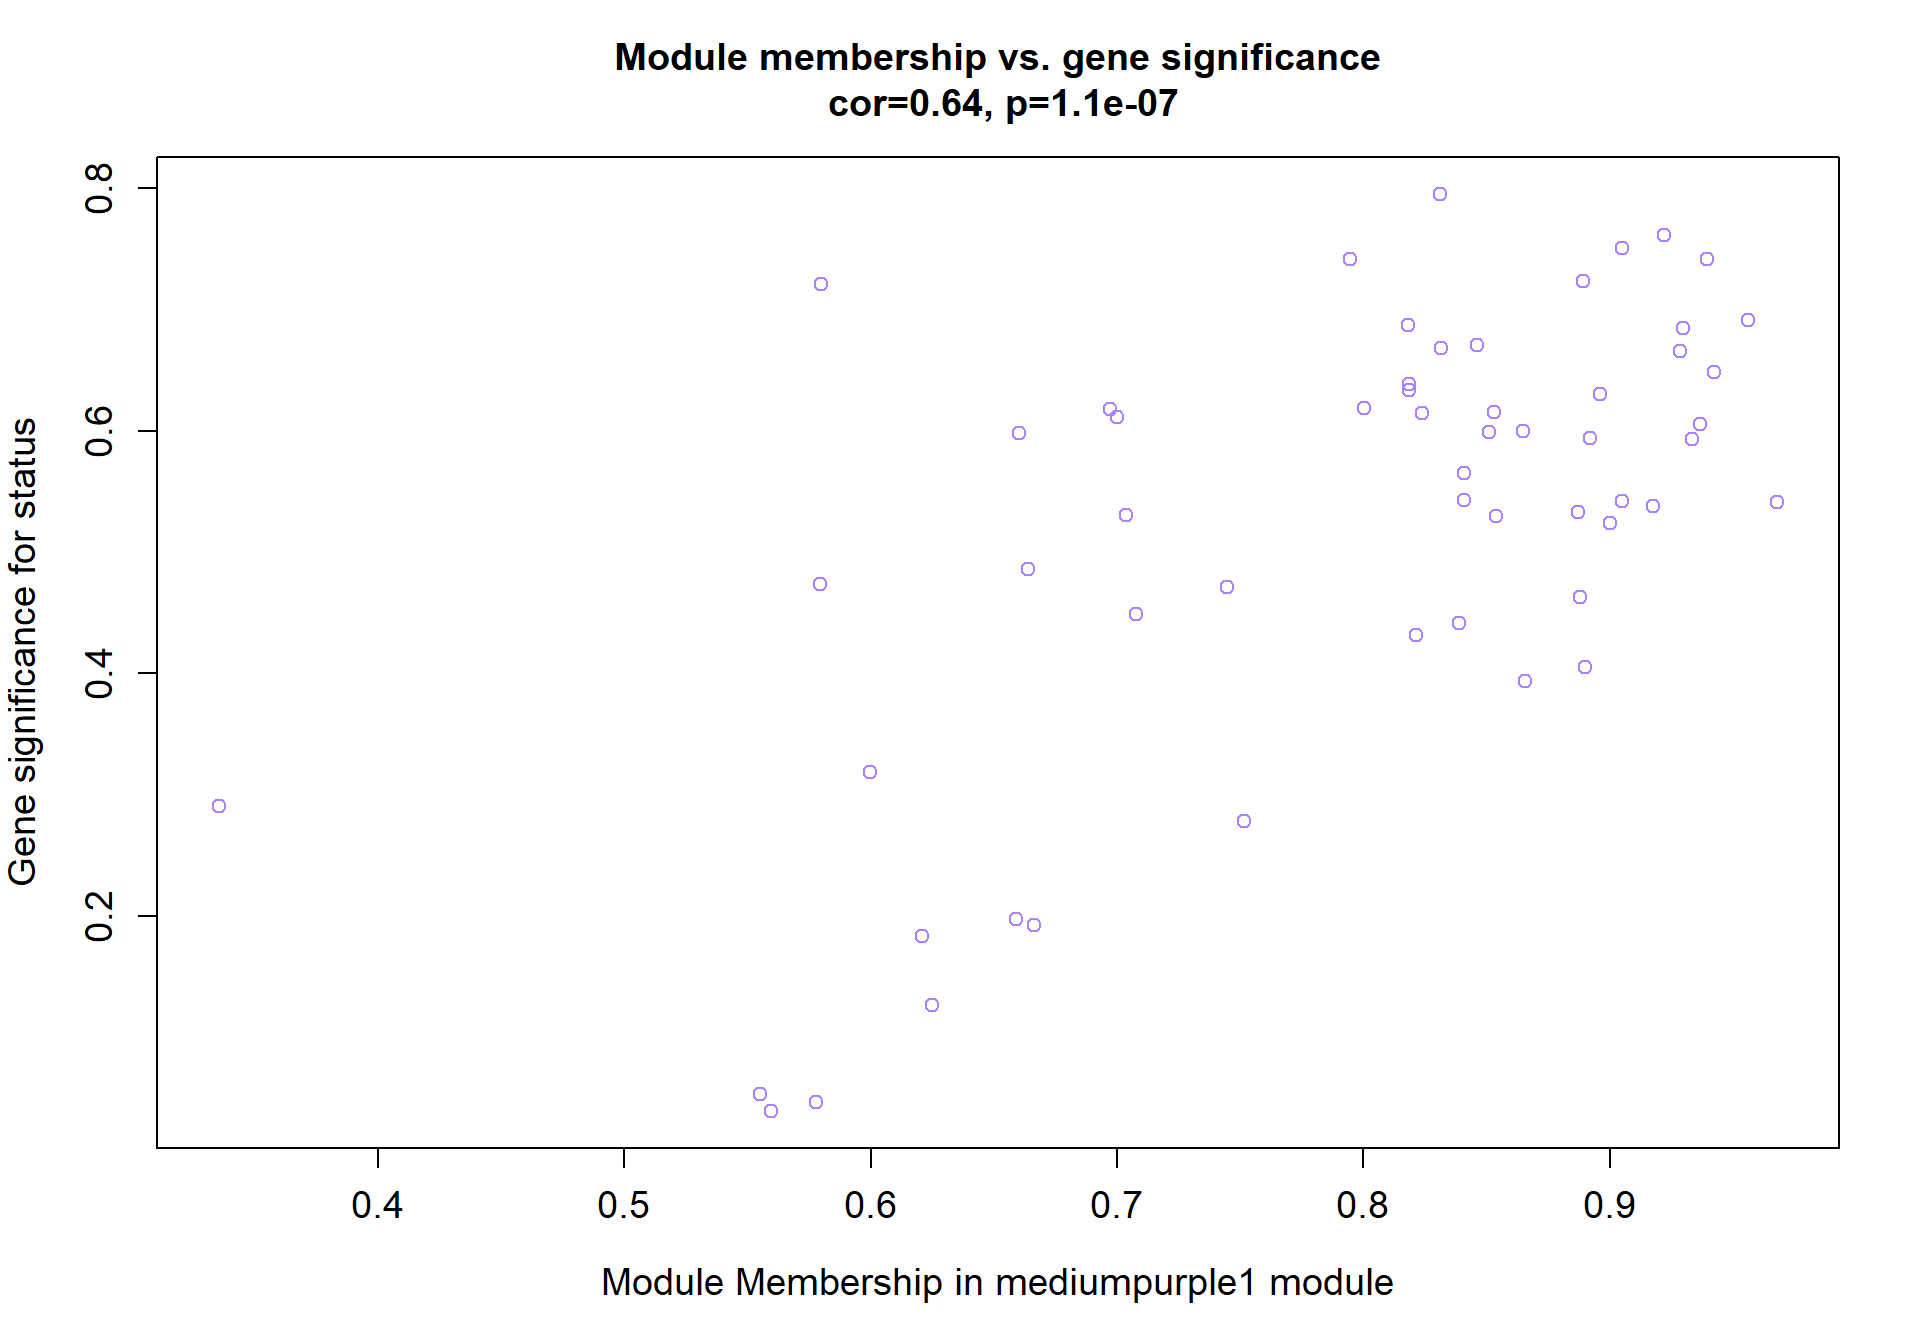
4.1.1.1 Gene Ontology
| ID | Description | GeneRatio | BgRatio | pvalue | p.adjust | qvalue | geneID | Count |
|---|---|---|---|---|---|---|---|---|
| GO:0016082 | synaptic vesicle priming | 3/48 | 20/12138 | 0.0000631 | 0.0101610 | 0.0086999 | LOC113987015/LOC113991140/LOC113993758 | 3 |
| GO:0016079 | synaptic vesicle exocytosis | 3/48 | 23/12138 | 0.0000972 | 0.0101610 | 0.0086999 | LOC113987015/LOC113991140/LOC113993758 | 3 |
| GO:0007009 | plasma membrane organization | 3/48 | 28/12138 | 0.0001774 | 0.0123577 | 0.0105807 | LOC113987015/LOC113991140/LOC113993758 | 3 |
| GO:0006406 | mRNA export from nucleus | 4/48 | 96/12138 | 0.0005477 | 0.0249930 | 0.0213992 | DDX25/LOC113993656/LOC114004318/NUP160 | 4 |
| GO:0061025 | membrane fusion | 3/48 | 42/12138 | 0.0005979 | 0.0249930 | 0.0213992 | LOC113987015/LOC113991140/LOC113993758 | 3 |
| GO:0038063 | collagen-activated tyrosine kinase receptor signaling pathway | 2/48 | 13/12138 | 0.0011617 | 0.0346858 | 0.0296983 | LOC113998275/OTOL1 | 2 |
| GO:0098789 | pre-mRNA cleavage required for polyadenylation | 2/48 | 13/12138 | 0.0011617 | 0.0346858 | 0.0296983 | LOC113993656/LOC114004318 | 2 |
| GO:0006388 | tRNA splicing, via endonucleolytic cleavage and ligation | 2/48 | 15/12138 | 0.0015560 | 0.0406503 | 0.0348051 | LOC113993656/LOC114004318 | 2 |
| GO:0016254 | preassembly of GPI anchor in ER membrane | 2/48 | 16/12138 | 0.0017738 | 0.0411915 | 0.0352685 | PIGV/PIGX | 2 |
| GO:0006637 | acyl-CoA metabolic process | 2/48 | 22/12138 | 0.0033633 | 0.0702937 | 0.0601860 | GPAT4/HMGCL | 2 |
## preparing gene to GO mapping data...## preparing IC data...## Warning in if (class(try(col2rgb(palette), silent = TRUE)) == "try-error")
## stop("color palette is not correct"): the condition has length > 1 and only the
## first element will be used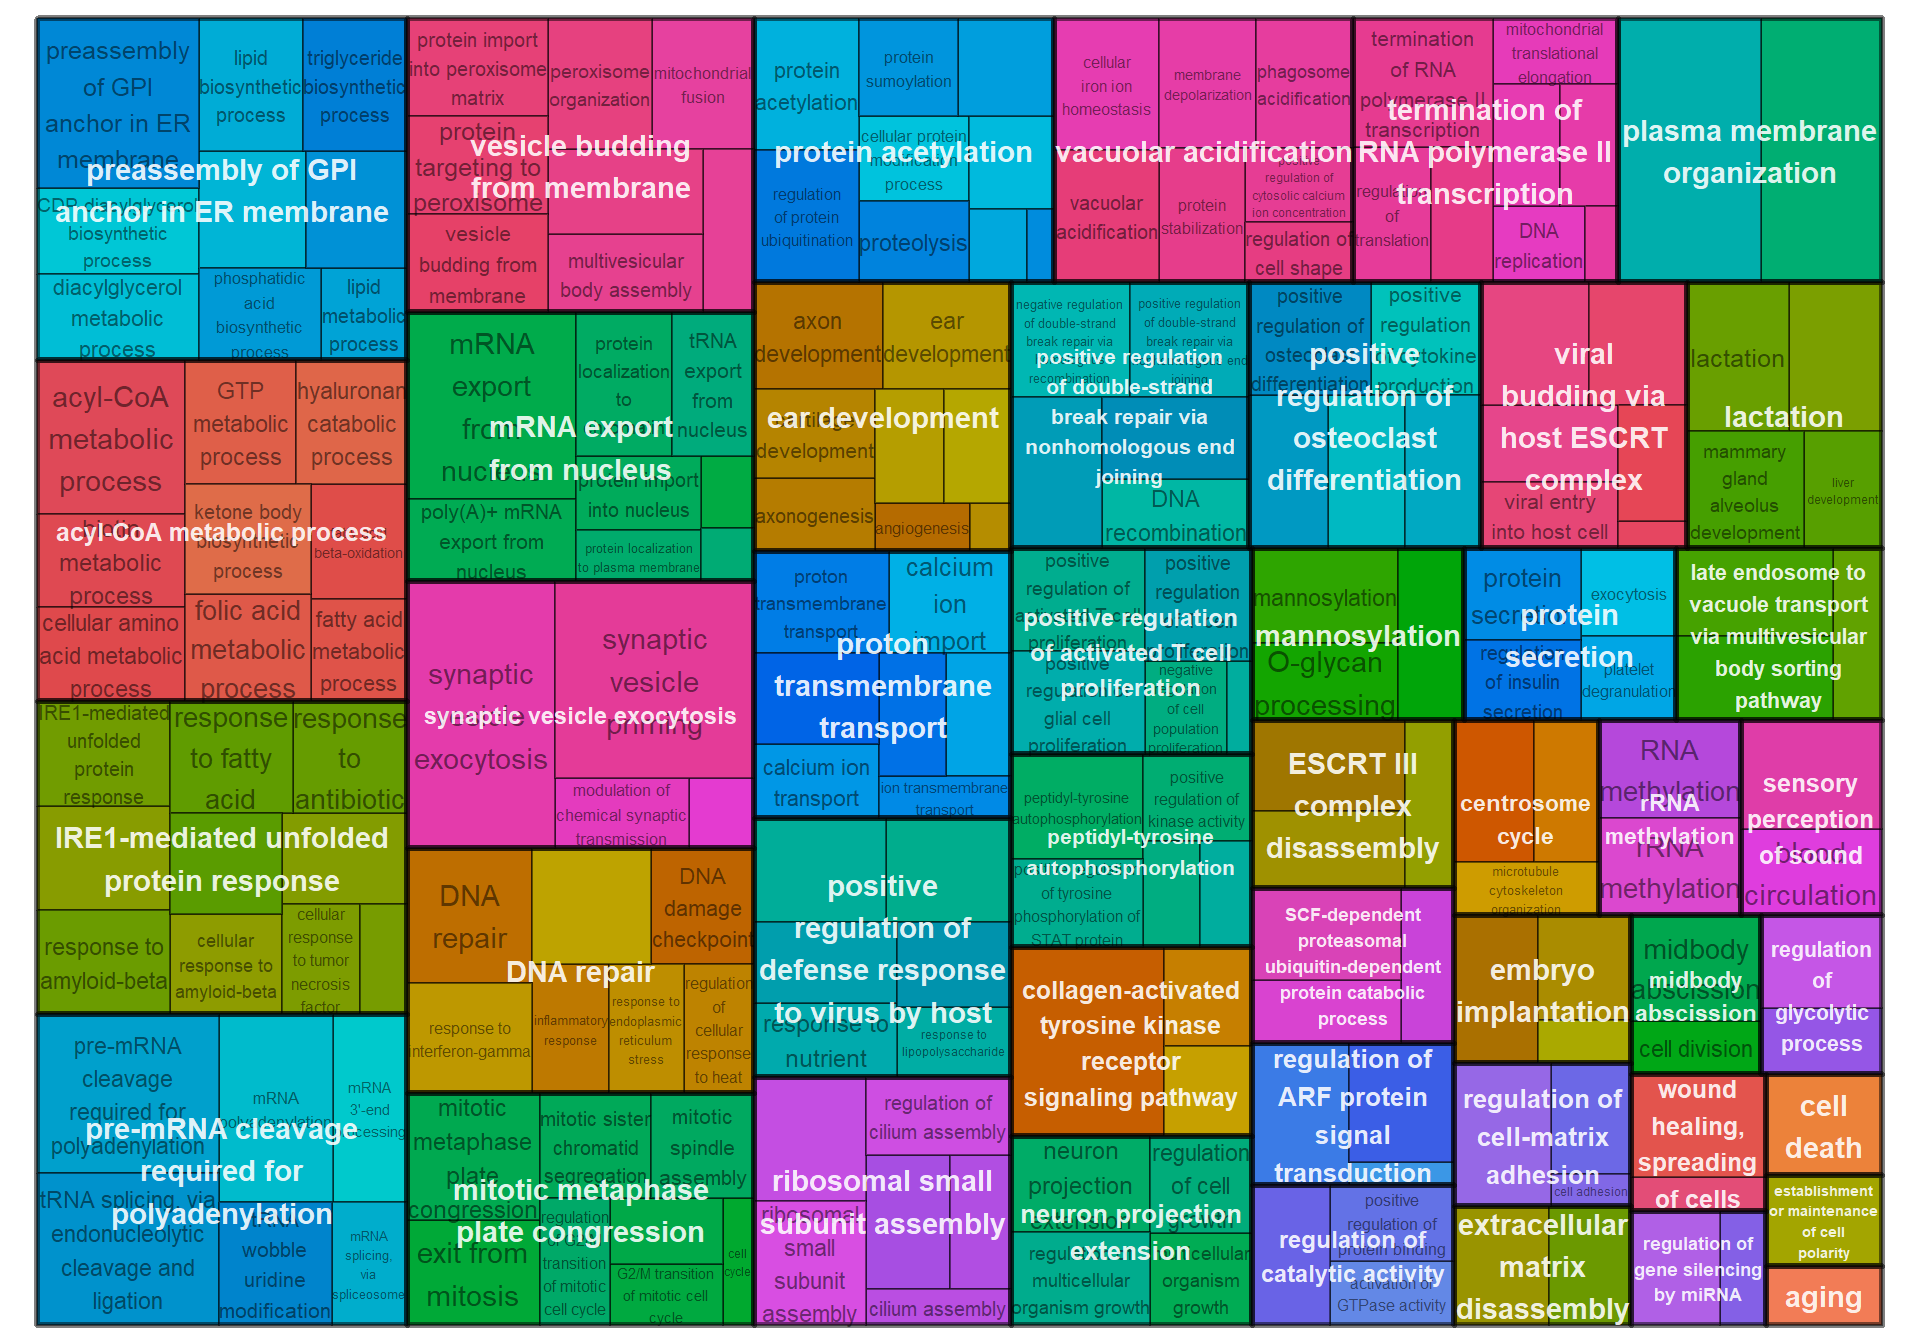
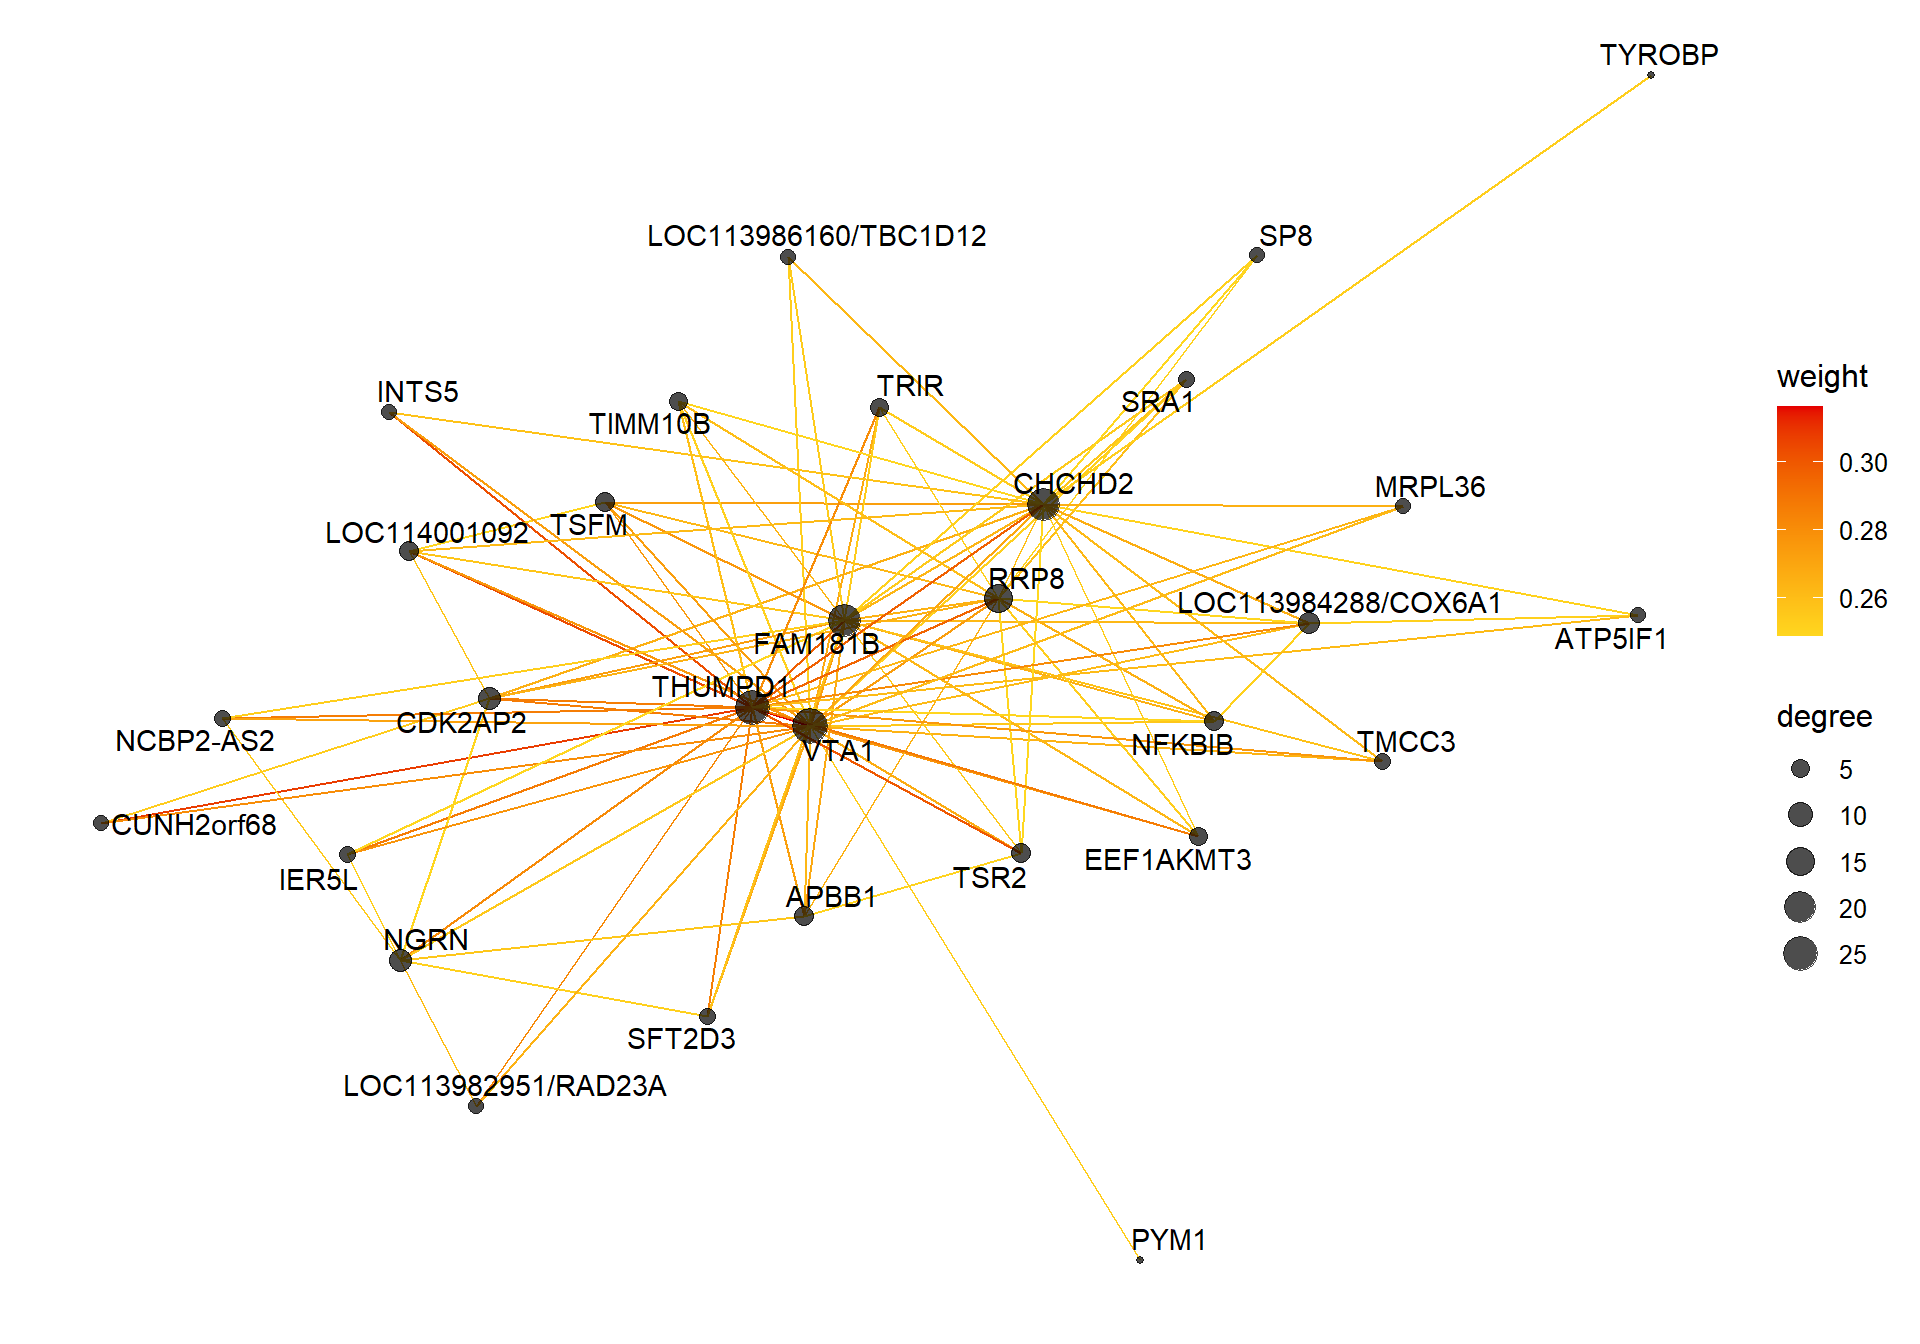
4.1.2 tan module - Status
Also the inverse module of the mediumpurple1 module based on the intermodule correlation plot
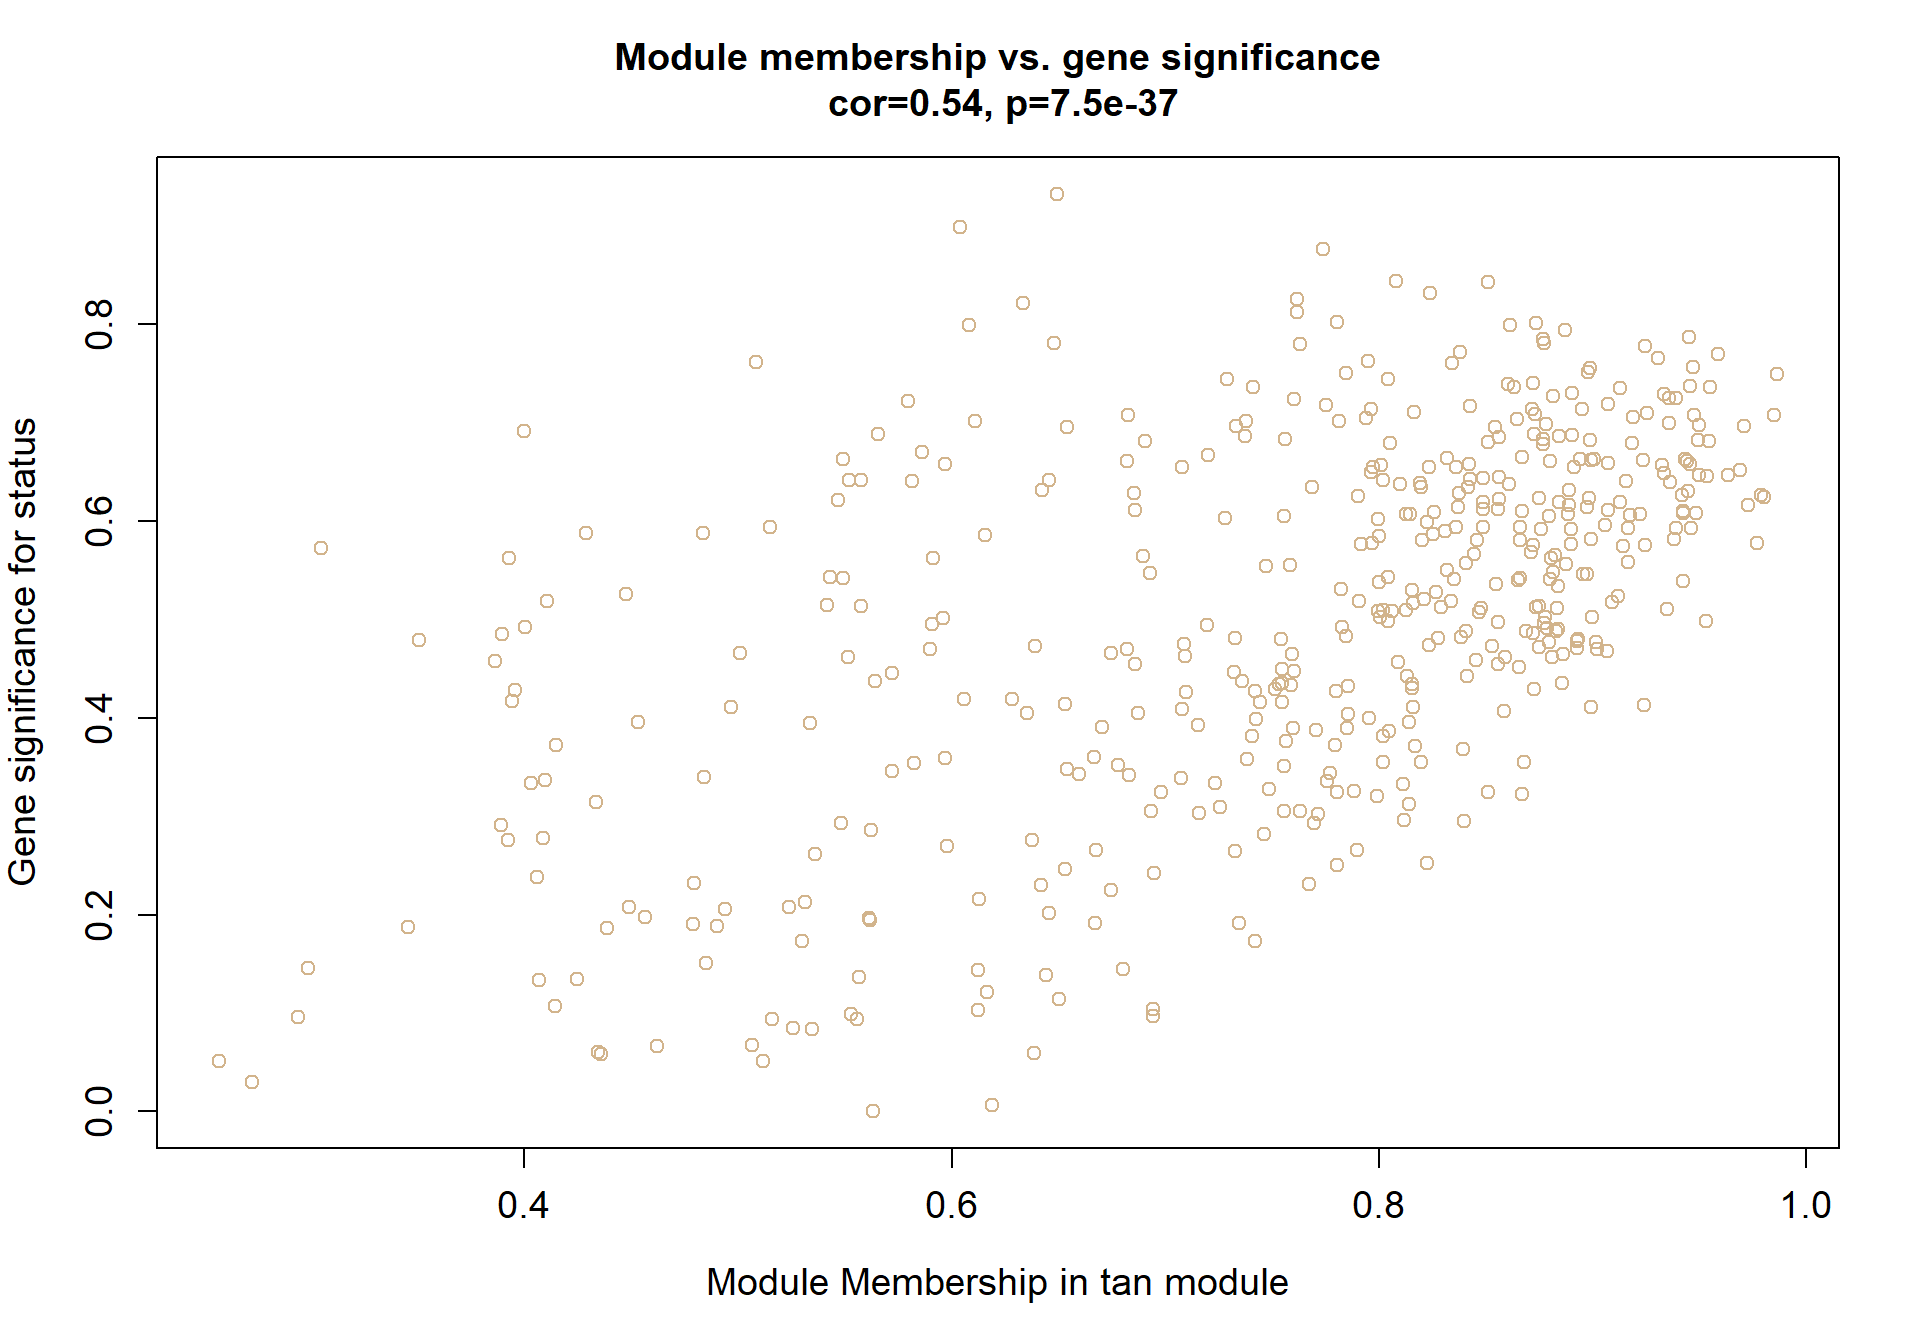
4.1.2.1 Gene Ontology
| ID | Description | GeneRatio | BgRatio | pvalue | p.adjust | qvalue | geneID | Count |
|---|---|---|---|---|---|---|---|---|
| GO:0070125 | mitochondrial translational elongation | 10/351 | 87/12138 | 0.0001990 | 0.2147199 | 0.2128242 | CHCHD1/MRPL14/MRPL24/MRPL35/MRPL36/MRPL51/MRPL54/MRPS18C/MRPS22/TSFM | 10 |
| GO:0016075 | rRNA catabolic process | 4/351 | 14/12138 | 0.0005467 | 0.2949453 | 0.2923413 | EXOSC4/EXOSC6/TRIR/XRN1 | 4 |
| GO:0070126 | mitochondrial translational termination | 9/351 | 87/12138 | 0.0008986 | 0.3231911 | 0.3203377 | CHCHD1/MRPL14/MRPL24/MRPL35/MRPL36/MRPL51/MRPL54/MRPS18C/MRPS22 | 9 |
| GO:0055088 | lipid homeostasis | 5/351 | 31/12138 | 0.0017973 | 0.3598964 | 0.3567189 | ABHD5/CEBPA/DDX3X/LOC114000584/LOC114001595 | 5 |
| GO:0090503 | RNA phosphodiester bond hydrolysis, exonucleolytic | 5/351 | 33/12138 | 0.0023947 | 0.3598964 | 0.3567189 | DCP2/EXOSC4/EXOSC6/TRIR/XRN1 | 5 |
| GO:0009650 | UV protection | 3/351 | 10/12138 | 0.0024730 | 0.3598964 | 0.3567189 | ERCC4/LOC113992976/XPA | 3 |
| GO:0071028 | nuclear mRNA surveillance | 3/351 | 10/12138 | 0.0024730 | 0.3598964 | 0.3567189 | EXOSC4/EXOSC6/XRN1 | 3 |
| GO:0030308 | negative regulation of cell growth | 9/351 | 104/12138 | 0.0031382 | 0.3598964 | 0.3567189 | ADIPOR1/APBB1/BTG1/DDX3X/LOC113996102/LOC113999325/PPP2CA/PSRC1/VGLL4 | 9 |
| GO:0045930 | negative regulation of mitotic cell cycle | 4/351 | 22/12138 | 0.0033278 | 0.3598964 | 0.3567189 | BTG1/CDKN1C/FOXC1/LOC113996102 | 4 |
| GO:0009411 | response to UV | 5/351 | 36/12138 | 0.0035441 | 0.3598964 | 0.3567189 | ERCC4/ERCC6/LOC113992976/LOC114000584/LOC114001595 | 5 |
## preparing gene to GO mapping data...## preparing IC data...## Warning in if (class(try(col2rgb(palette), silent = TRUE)) == "try-error")
## stop("color palette is not correct"): the condition has length > 1 and only the
## first element will be used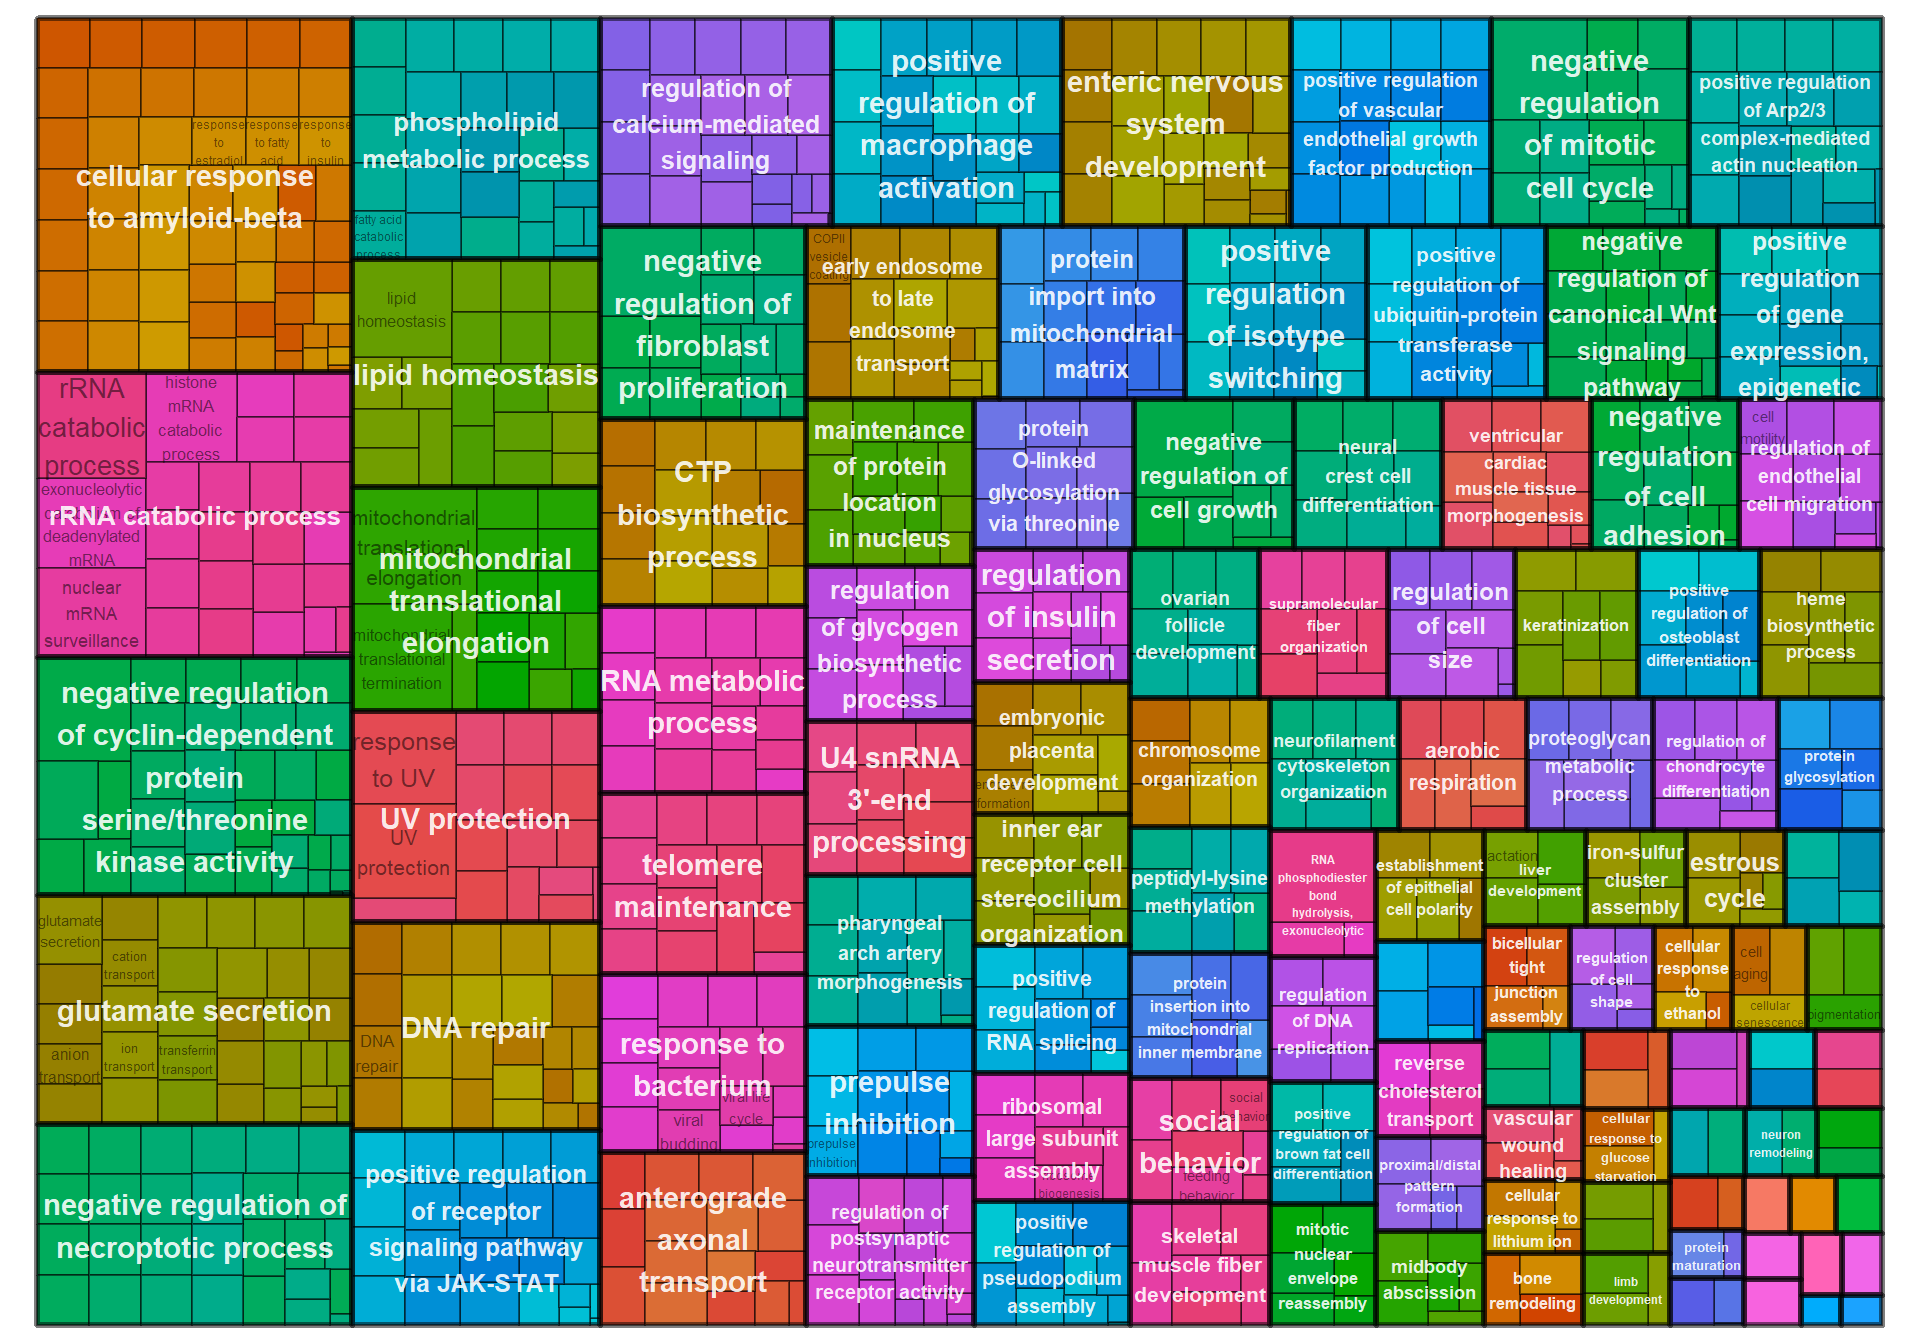
5 Paraventricular Nucleus (PVN)
## [1] 15153## Warning in DESeqDataSet(se, design = design, ignoreRank): some variables in
## design formula are characters, converting to factors## estimating size factors## estimating dispersions## gene-wise dispersion estimates## mean-dispersion relationship## final dispersion estimates## fitting model and testing## -- replacing outliers and refitting for 15 genes
## -- DESeq argument 'minReplicatesForReplace' = 7
## -- original counts are preserved in counts(dds)## estimating dispersions## fitting model and testing## Power SFT.R.sq slope truncated.R.sq mean.k. median.k. max.k.
## 1 1 0.0195 19.20 0.743 7580.0 7580.0 7660
## 2 2 0.4010 -9.84 0.711 4300.0 4240.0 4880
## 3 3 0.4960 -3.59 0.645 2660.0 2570.0 3470
## 4 4 0.6420 -2.55 0.757 1760.0 1660.0 2670
## 5 5 0.7320 -2.27 0.844 1220.0 1110.0 2180
## 6 6 0.8040 -2.09 0.901 883.0 776.0 1840
## 7 7 0.8580 -1.99 0.937 658.0 556.0 1580
## 8 8 0.8910 -1.93 0.957 504.0 408.0 1390
## 9 9 0.9080 -1.90 0.964 395.0 306.0 1240
## 10 10 0.9180 -1.87 0.967 315.0 233.0 1110
## 11 11 0.9320 -1.83 0.975 256.0 180.0 1010
## 12 12 0.9330 -1.82 0.974 211.0 141.0 924
## 13 14 0.9330 -1.79 0.969 148.0 89.5 785
## 14 16 0.9400 -1.76 0.974 108.0 59.1 679
## 15 18 0.9440 -1.73 0.976 81.4 40.2 596
## 16 20 0.9390 -1.71 0.972 62.9 28.1 528
## 17 22 0.9390 -1.69 0.974 49.7 20.2 472
## 18 24 0.9340 -1.68 0.971 39.9 14.8 424
## 19 26 0.9240 -1.68 0.964 32.6 11.0 384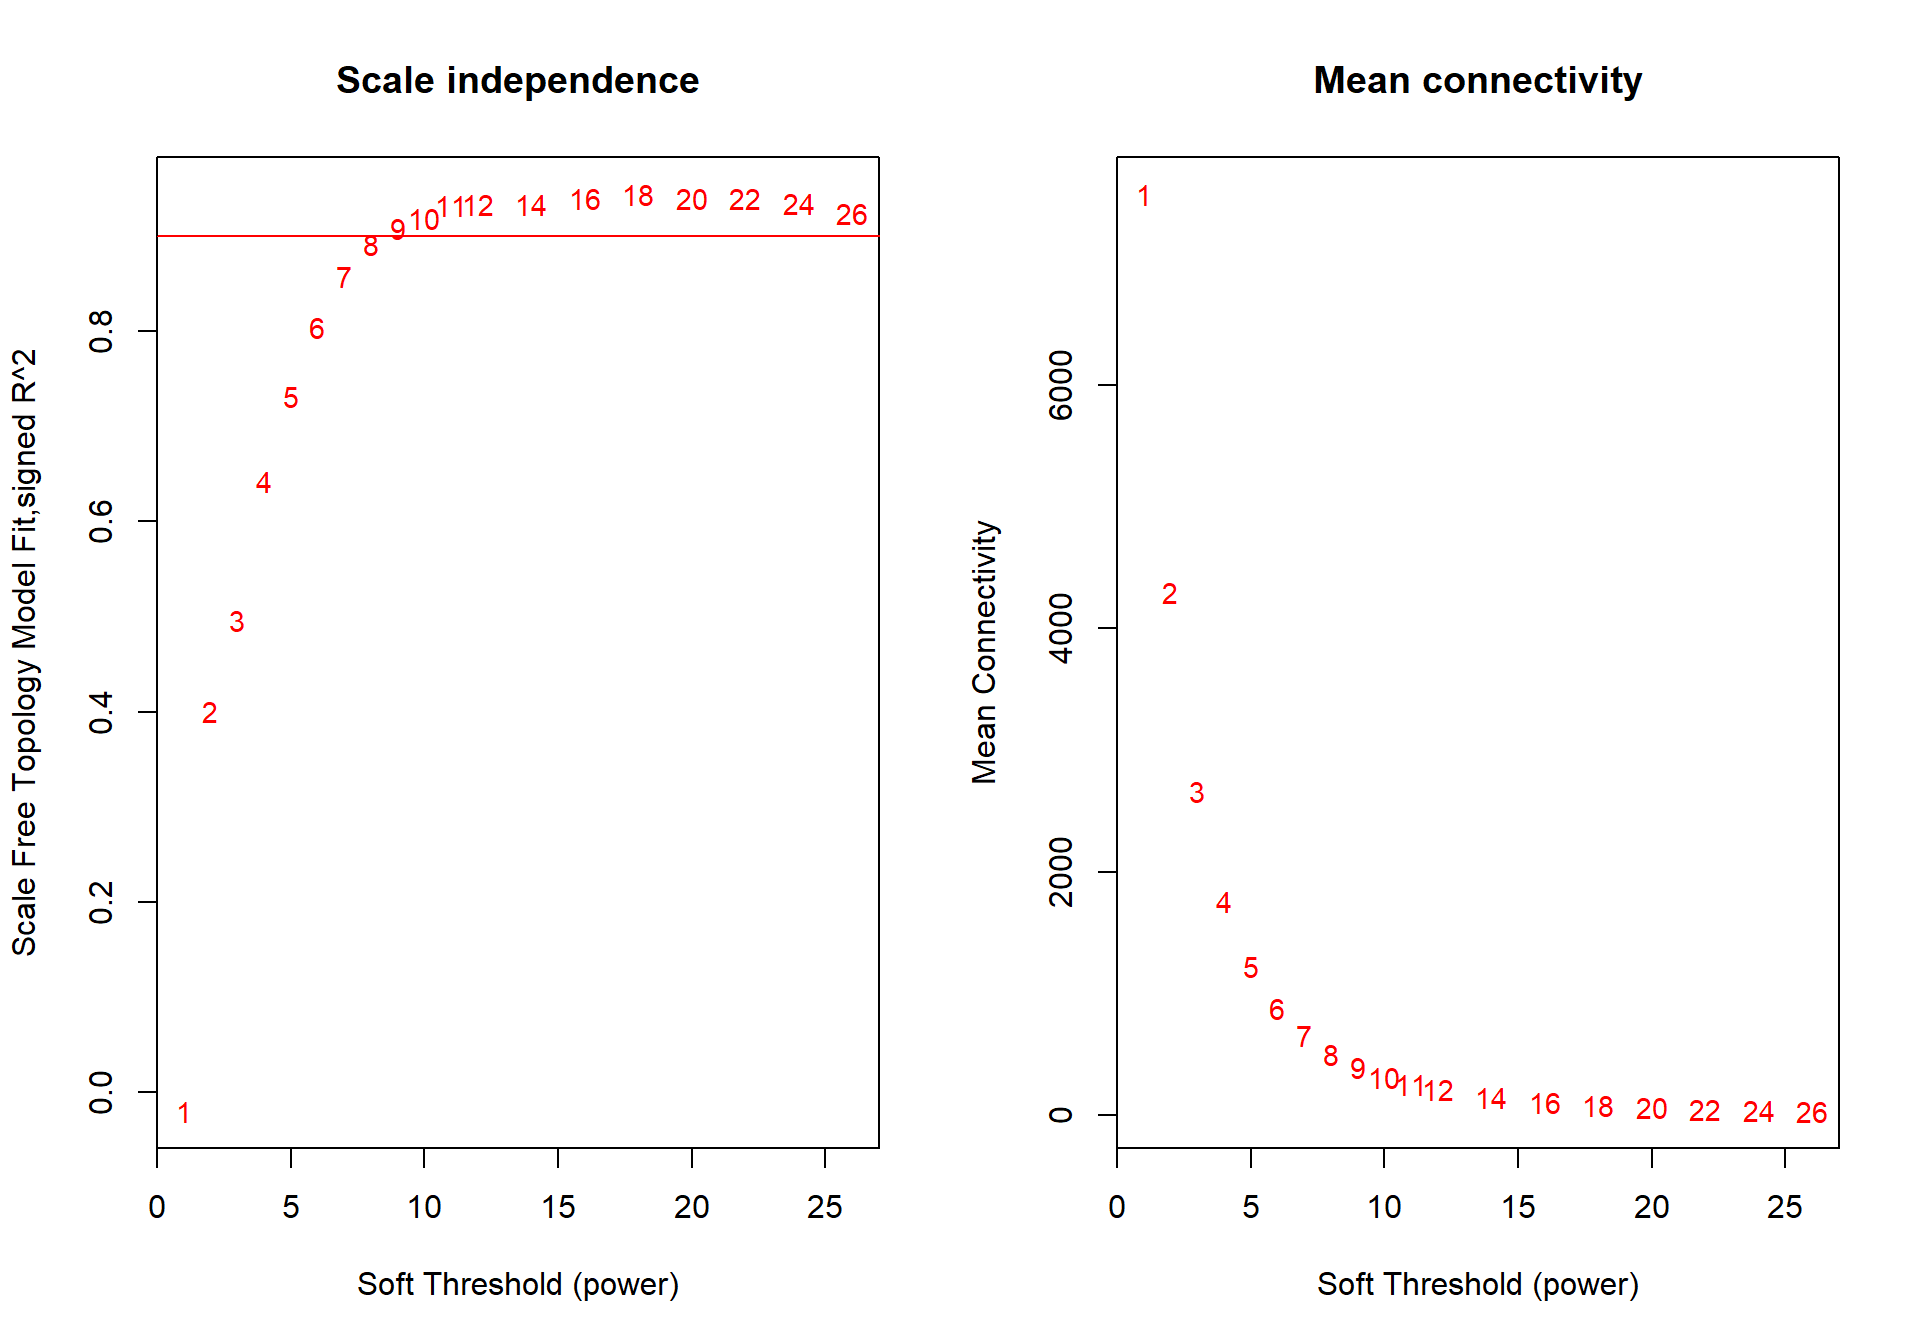
The soft-power selected for PVN is 9.
| moduleColors | Freq |
|---|---|
| black | 438 |
| blue | 5377 |
| darkgreen | 383 |
| darkmagenta | 75 |
| darkolivegreen | 348 |
| darkorange | 394 |
| darkred | 664 |
| darkturquoise | 181 |
| green | 555 |
| greenyellow | 886 |
| midnightblue | 646 |
| paleturquoise | 159 |
| saddlebrown | 106 |
| sienna3 | 73 |
| steelblue | 106 |
| turquoise | 4631 |
| white | 129 |
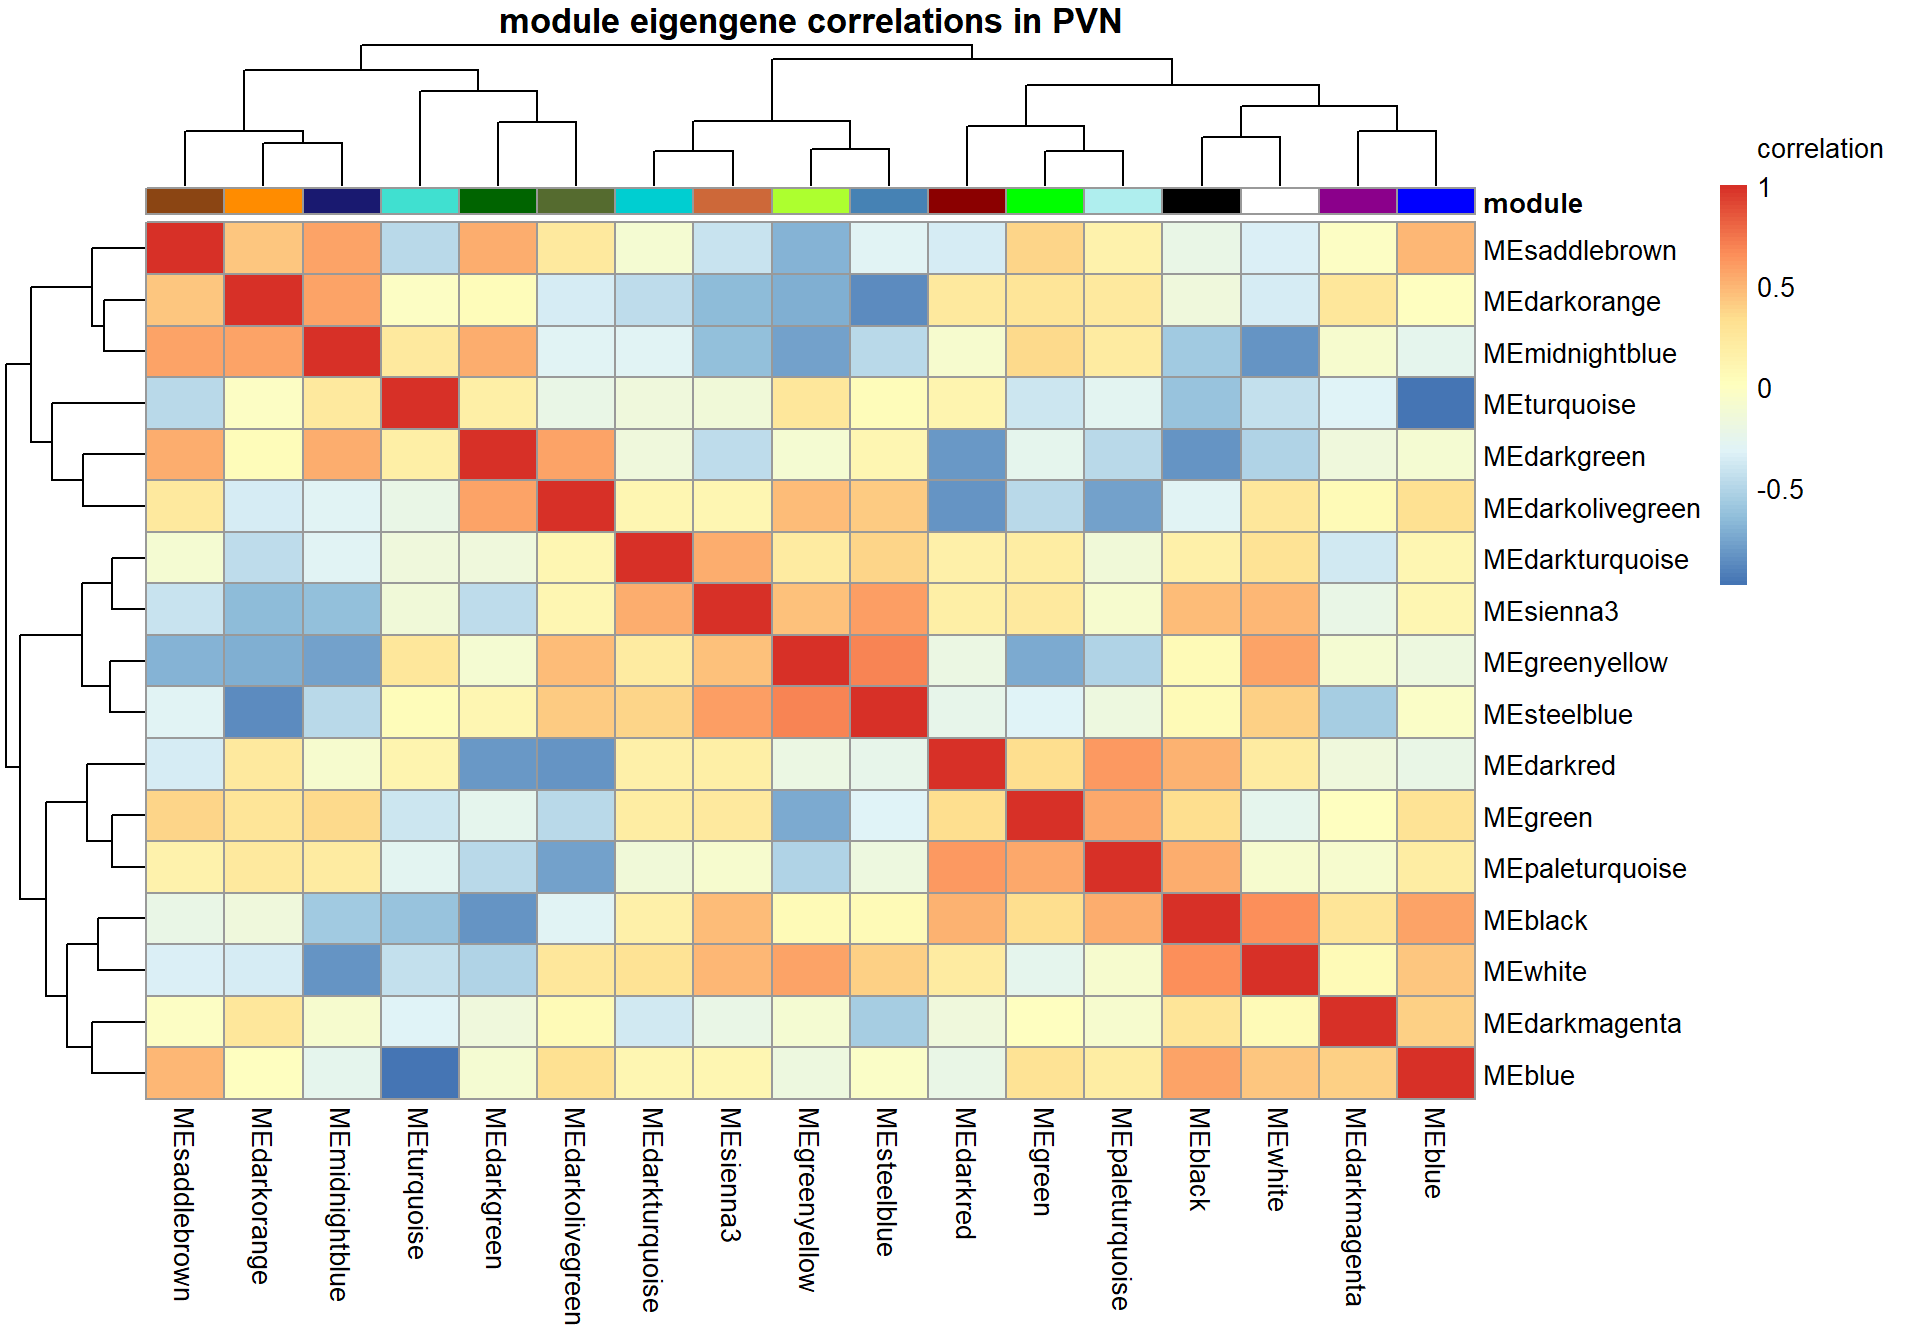
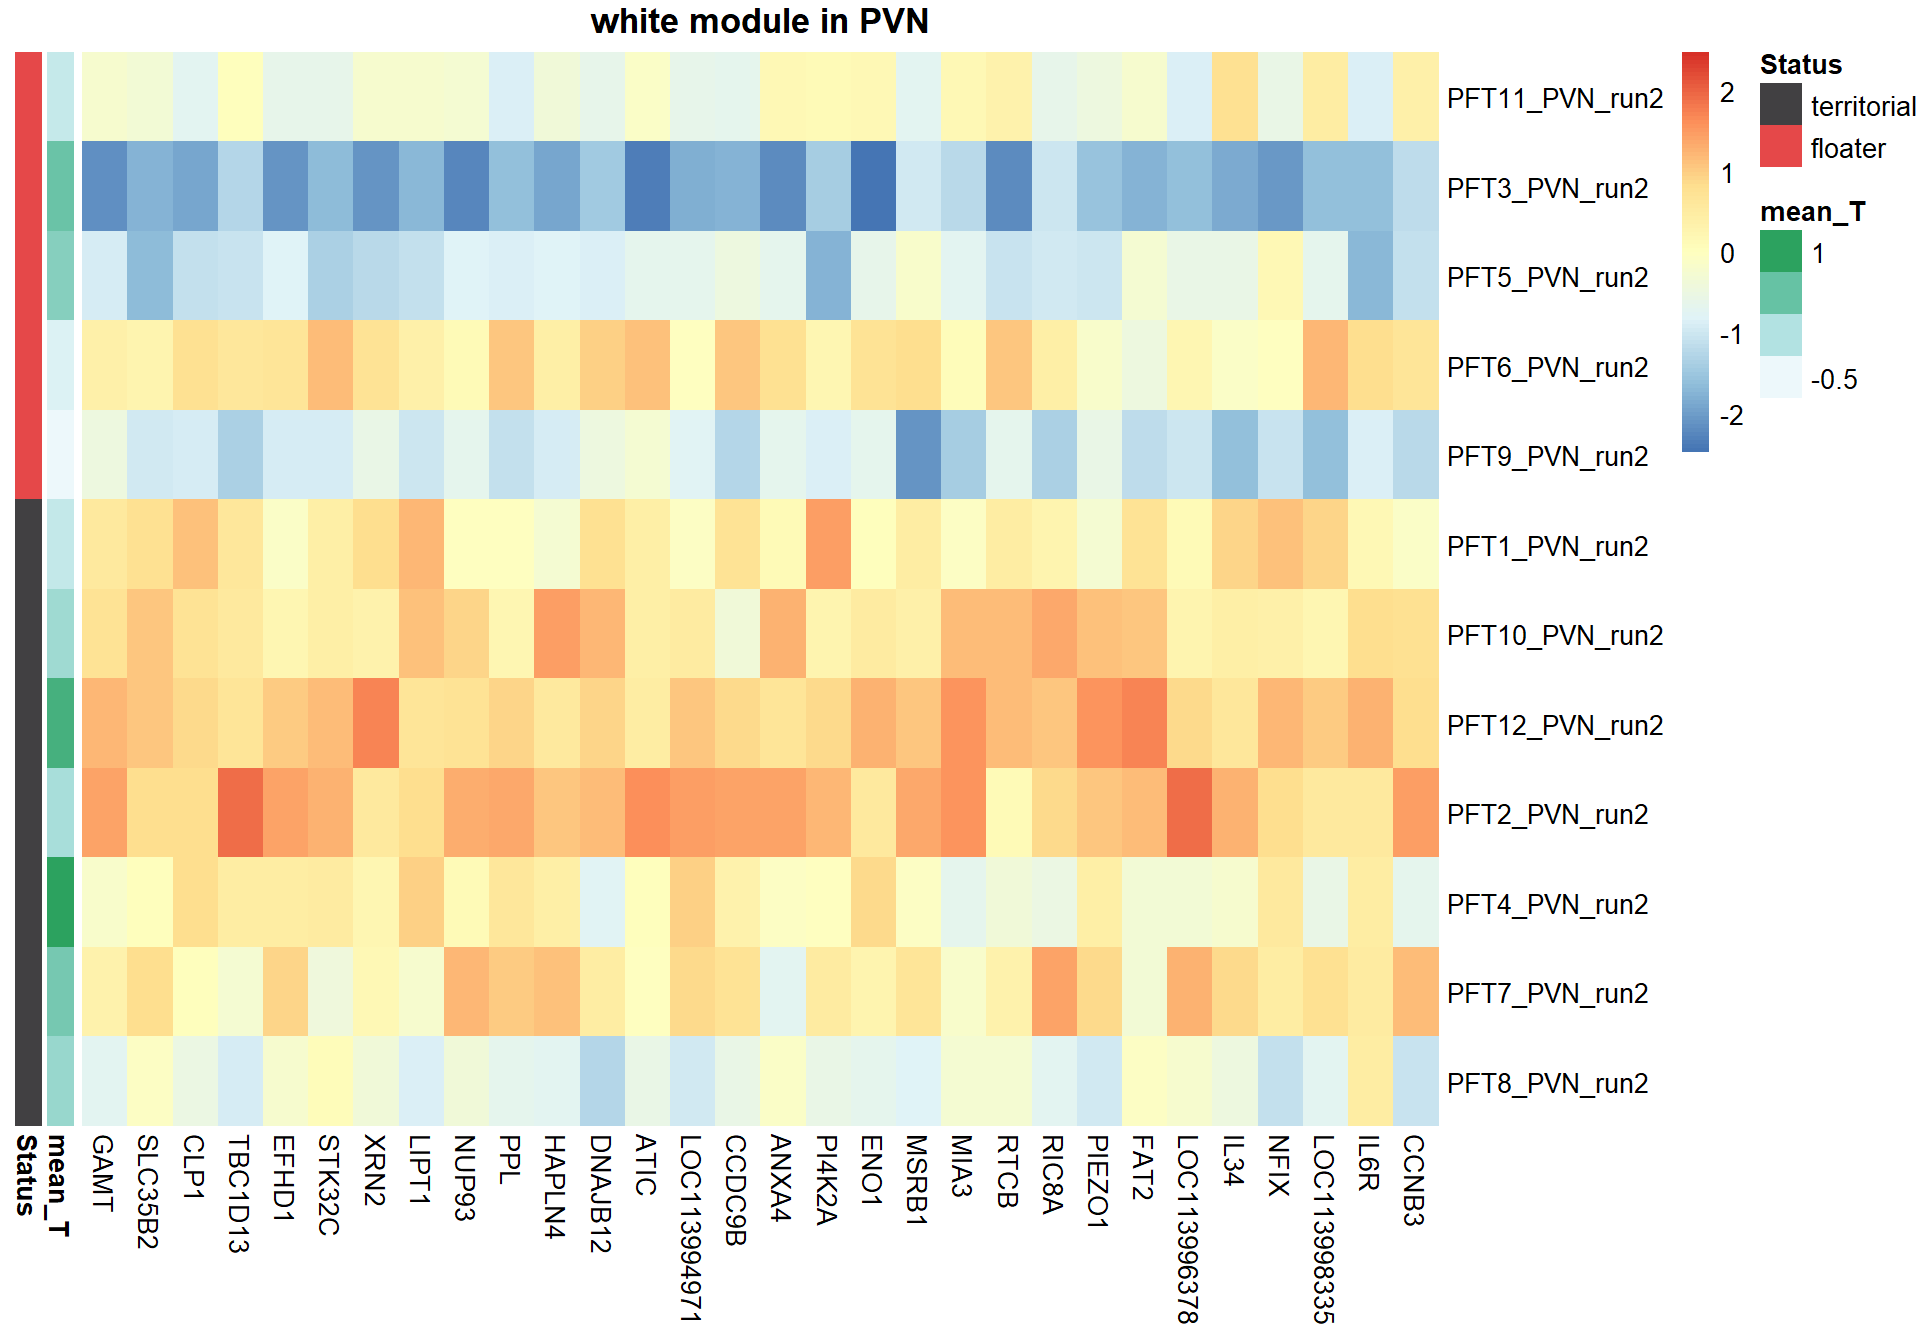
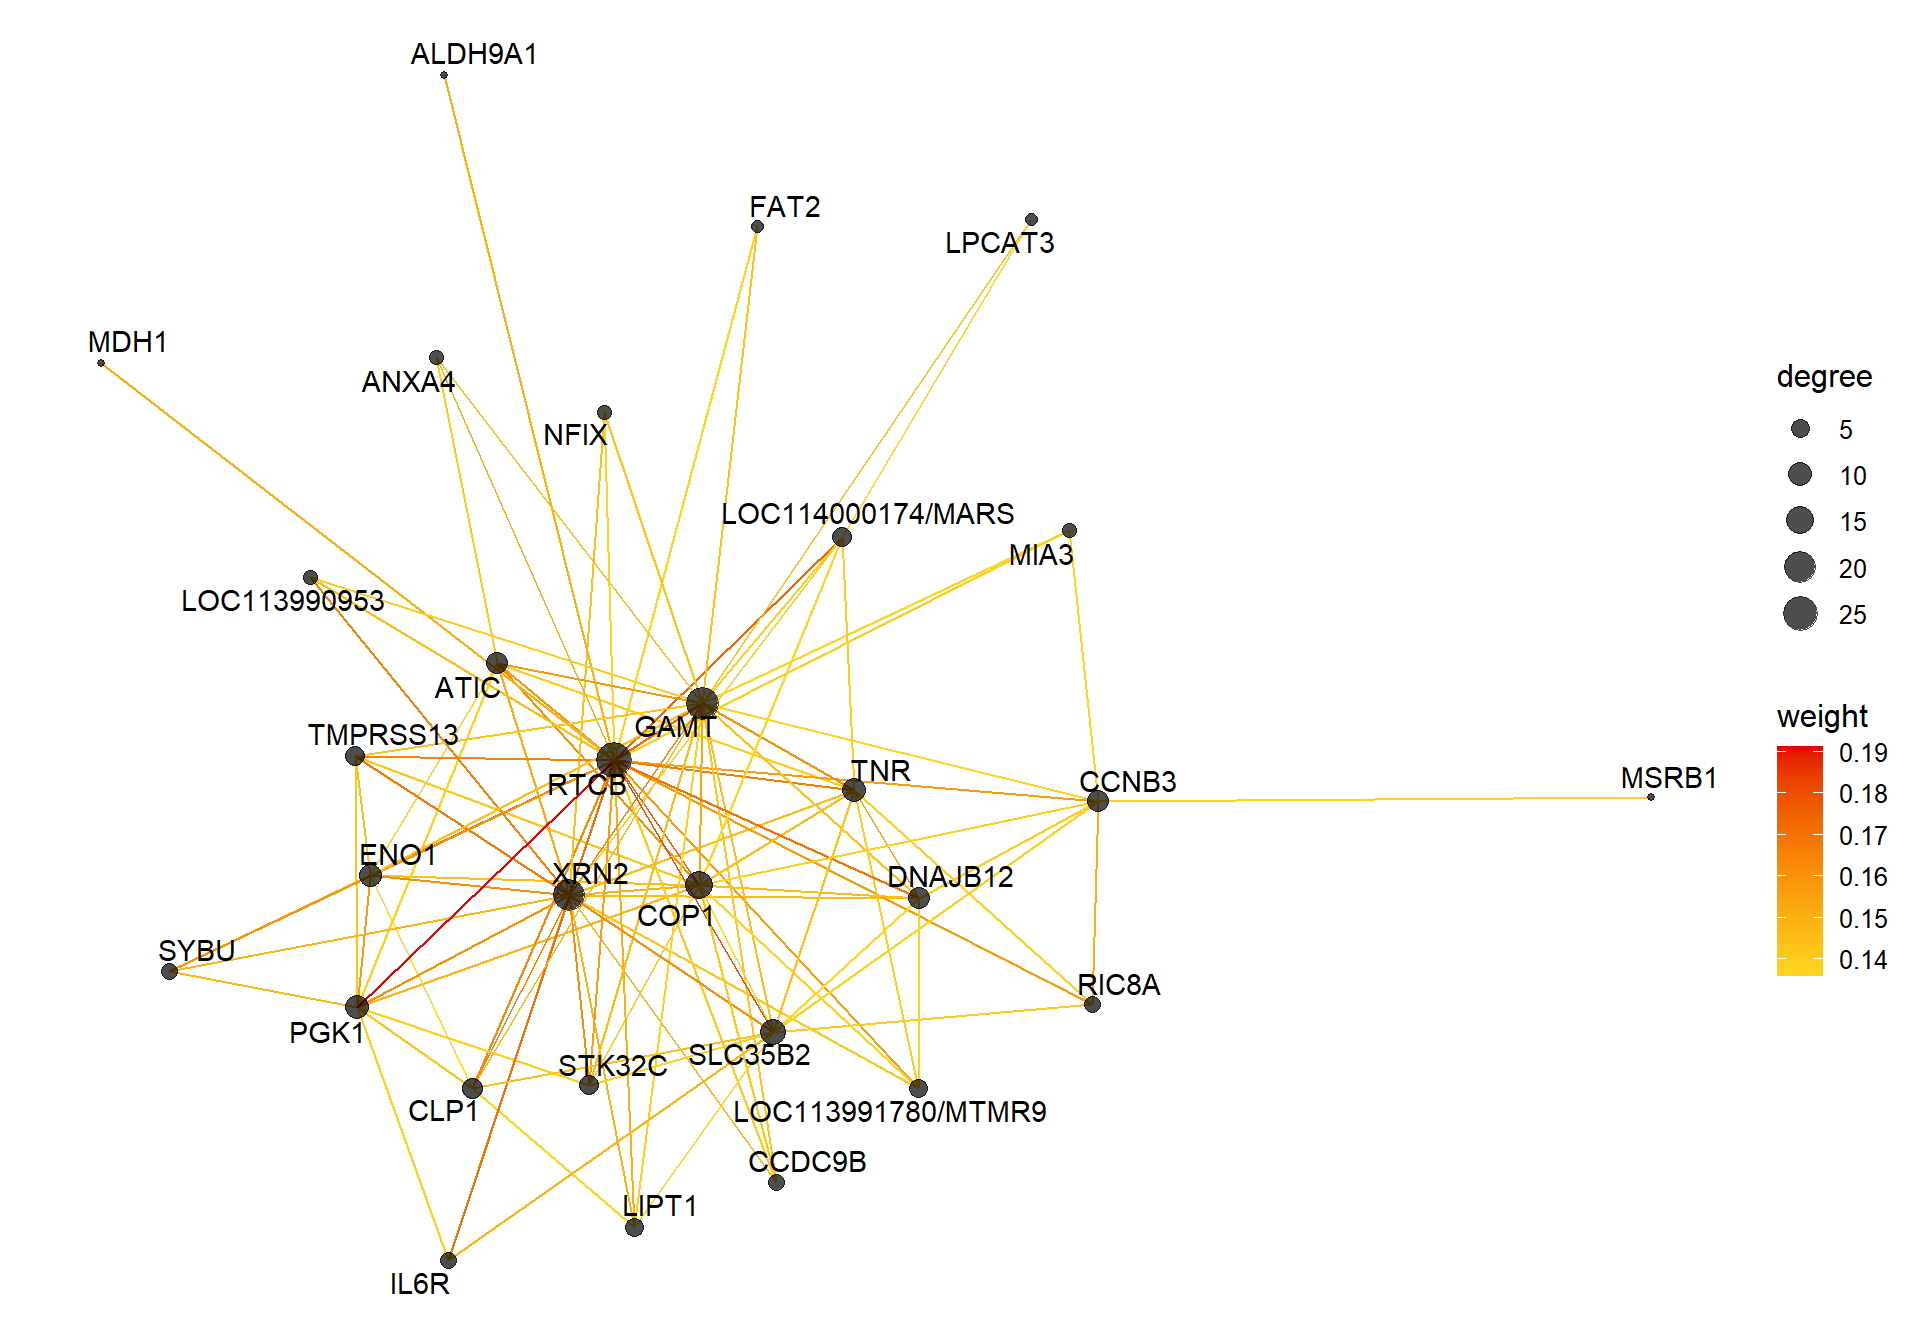
It doesn’t appear that our interesting module white is associated with any other module of interest.
5.1 Interesting Modules
5.1.1 white module - status
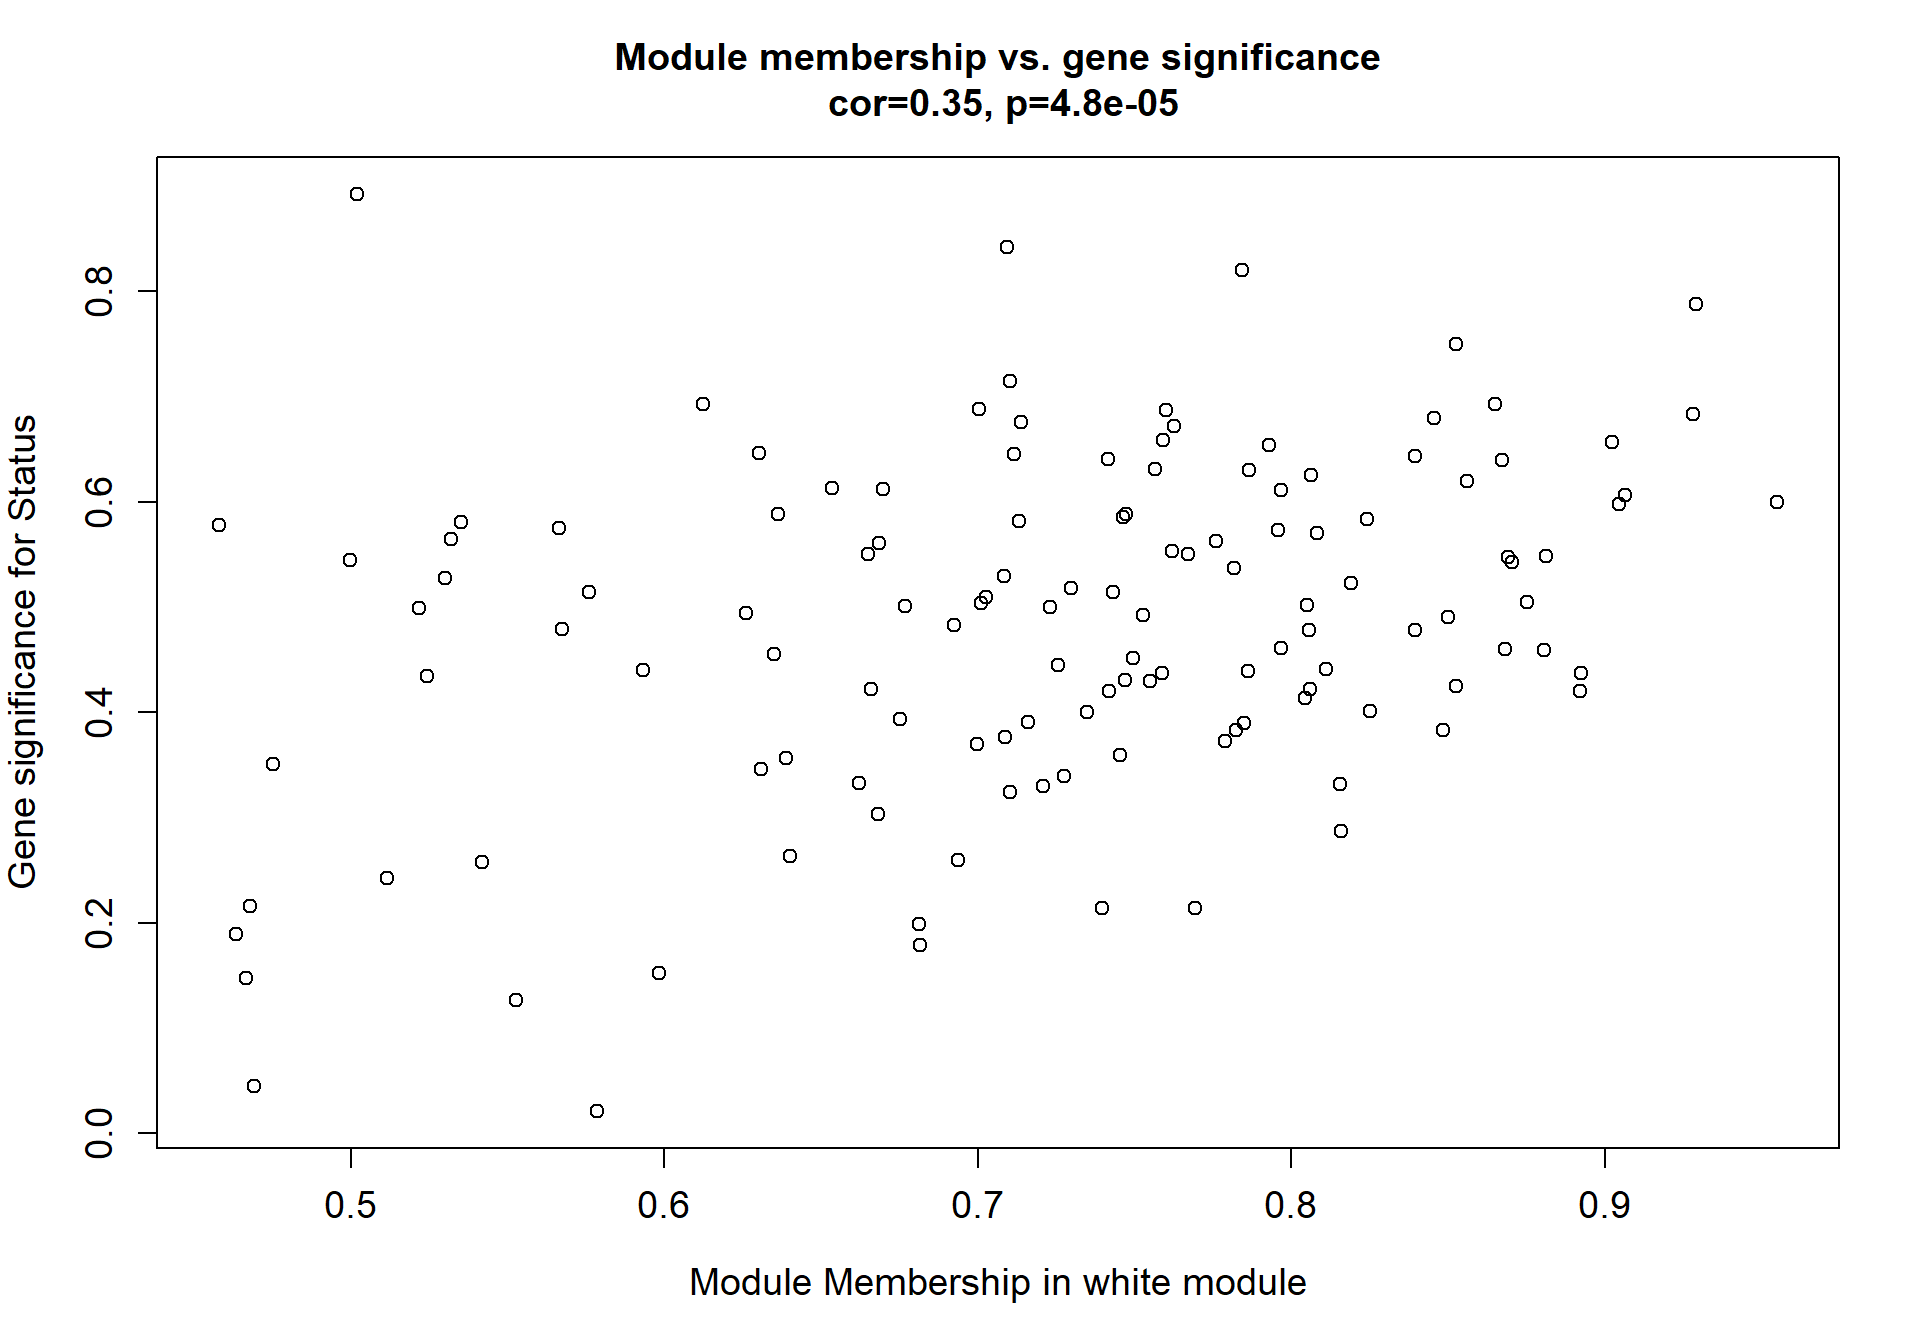
5.1.1.1 Gene Ontology
| ID | Description | GeneRatio | BgRatio | pvalue | p.adjust | qvalue | geneID | Count |
|---|---|---|---|---|---|---|---|---|
| GO:0006388 | tRNA splicing, via endonucleolytic cleavage and ligation | 3/104 | 15/12249 | 0.0002512 | 0.1233371 | 0.1197807 | CLP1/CPSF4/RTCB | 3 |
| GO:0006270 | DNA replication initiation | 3/104 | 28/12249 | 0.0016693 | 0.2736082 | 0.2657187 | MCM3/MCM5/ORC1 | 3 |
| GO:0032922 | circadian regulation of gene expression | 4/104 | 70/12249 | 0.0029266 | 0.2736082 | 0.2657187 | DRD3/LOC113996216/LOC113999640/USP2 | 4 |
| GO:0006094 | gluconeogenesis | 3/104 | 35/12249 | 0.0031947 | 0.2736082 | 0.2657187 | ENO1/MDH1/PGK1 | 3 |
| GO:0000727 | double-strand break repair via break-induced replication | 2/104 | 11/12249 | 0.0037356 | 0.2736082 | 0.2657187 | MCM3/MCM5 | 2 |
| GO:0045598 | regulation of fat cell differentiation | 2/104 | 11/12249 | 0.0037356 | 0.2736082 | 0.2657187 | LOC113996216/LOC113999640 | 2 |
| GO:0098609 | cell-cell adhesion | 5/104 | 124/12249 | 0.0040602 | 0.2736082 | 0.2657187 | ANXA2/FAT2/FBLIM1/LOC113988363/PDLIM1 | 5 |
| GO:0006953 | acute-phase response | 2/104 | 12/12249 | 0.0044580 | 0.2736082 | 0.2657187 | AHSG/IL6R | 2 |
| GO:0000956 | nuclear-transcribed mRNA catabolic process | 2/104 | 13/12249 | 0.0052395 | 0.2858411 | 0.2775989 | LOC113987020/XRN2 | 2 |
| GO:1903146 | regulation of autophagy of mitochondrion | 2/104 | 15/12249 | 0.0069756 | 0.3425008 | 0.3326248 | ATP13A2/PINK1 | 2 |
## preparing gene to GO mapping data...## preparing IC data...## Warning in if (class(try(col2rgb(palette), silent = TRUE)) == "try-error")
## stop("color palette is not correct"): the condition has length > 1 and only the
## first element will be used
6 Medial Preoptic Area (POM)
Note that the PFT2 POM sample was removed from this analysis as it was previously found to be an outlier.
## [1] 15315## Warning in DESeqDataSet(se, design = design, ignoreRank): some variables in
## design formula are characters, converting to factors## estimating size factors## estimating dispersions## gene-wise dispersion estimates## mean-dispersion relationship## final dispersion estimates## fitting model and testing## -- replacing outliers and refitting for 28 genes
## -- DESeq argument 'minReplicatesForReplace' = 7
## -- original counts are preserved in counts(dds)## estimating dispersions## fitting model and testing## Power SFT.R.sq slope truncated.R.sq mean.k. median.k. max.k.
## 1 1 0.0199 20.40 0.939 7660.00 7660.00 7760.0
## 2 2 0.4150 -33.70 0.906 4170.00 4160.00 4490.0
## 3 3 0.4780 -16.50 0.936 2420.00 2410.00 2830.0
## 4 4 0.4710 -9.84 0.939 1490.00 1470.00 1900.0
## 5 5 0.4360 -6.51 0.928 951.00 934.00 1340.0
## 6 6 0.4420 -4.83 0.924 632.00 615.00 975.0
## 7 7 0.4810 -4.06 0.930 433.00 418.00 733.0
## 8 8 0.5500 -3.84 0.946 304.00 291.00 573.0
## 9 9 0.6080 -3.71 0.956 219.00 207.00 456.0
## 10 10 0.6650 -3.68 0.966 161.00 151.00 370.0
## 11 11 0.7080 -3.62 0.972 120.00 111.00 304.0
## 12 12 0.7390 -3.53 0.975 91.50 83.60 253.0
## 13 14 0.8040 -3.36 0.986 55.10 48.90 181.0
## 14 16 0.8520 -3.19 0.992 34.80 29.90 134.0
## 15 18 0.8910 -3.01 0.996 22.80 19.00 102.0
## 16 20 0.9160 -2.91 0.997 15.50 12.50 79.4
## 17 22 0.9350 -2.81 0.998 10.80 8.42 63.3
## 18 24 0.9490 -2.73 0.997 7.74 5.83 51.7
## 19 26 0.9530 -2.72 0.997 5.67 4.10 44.3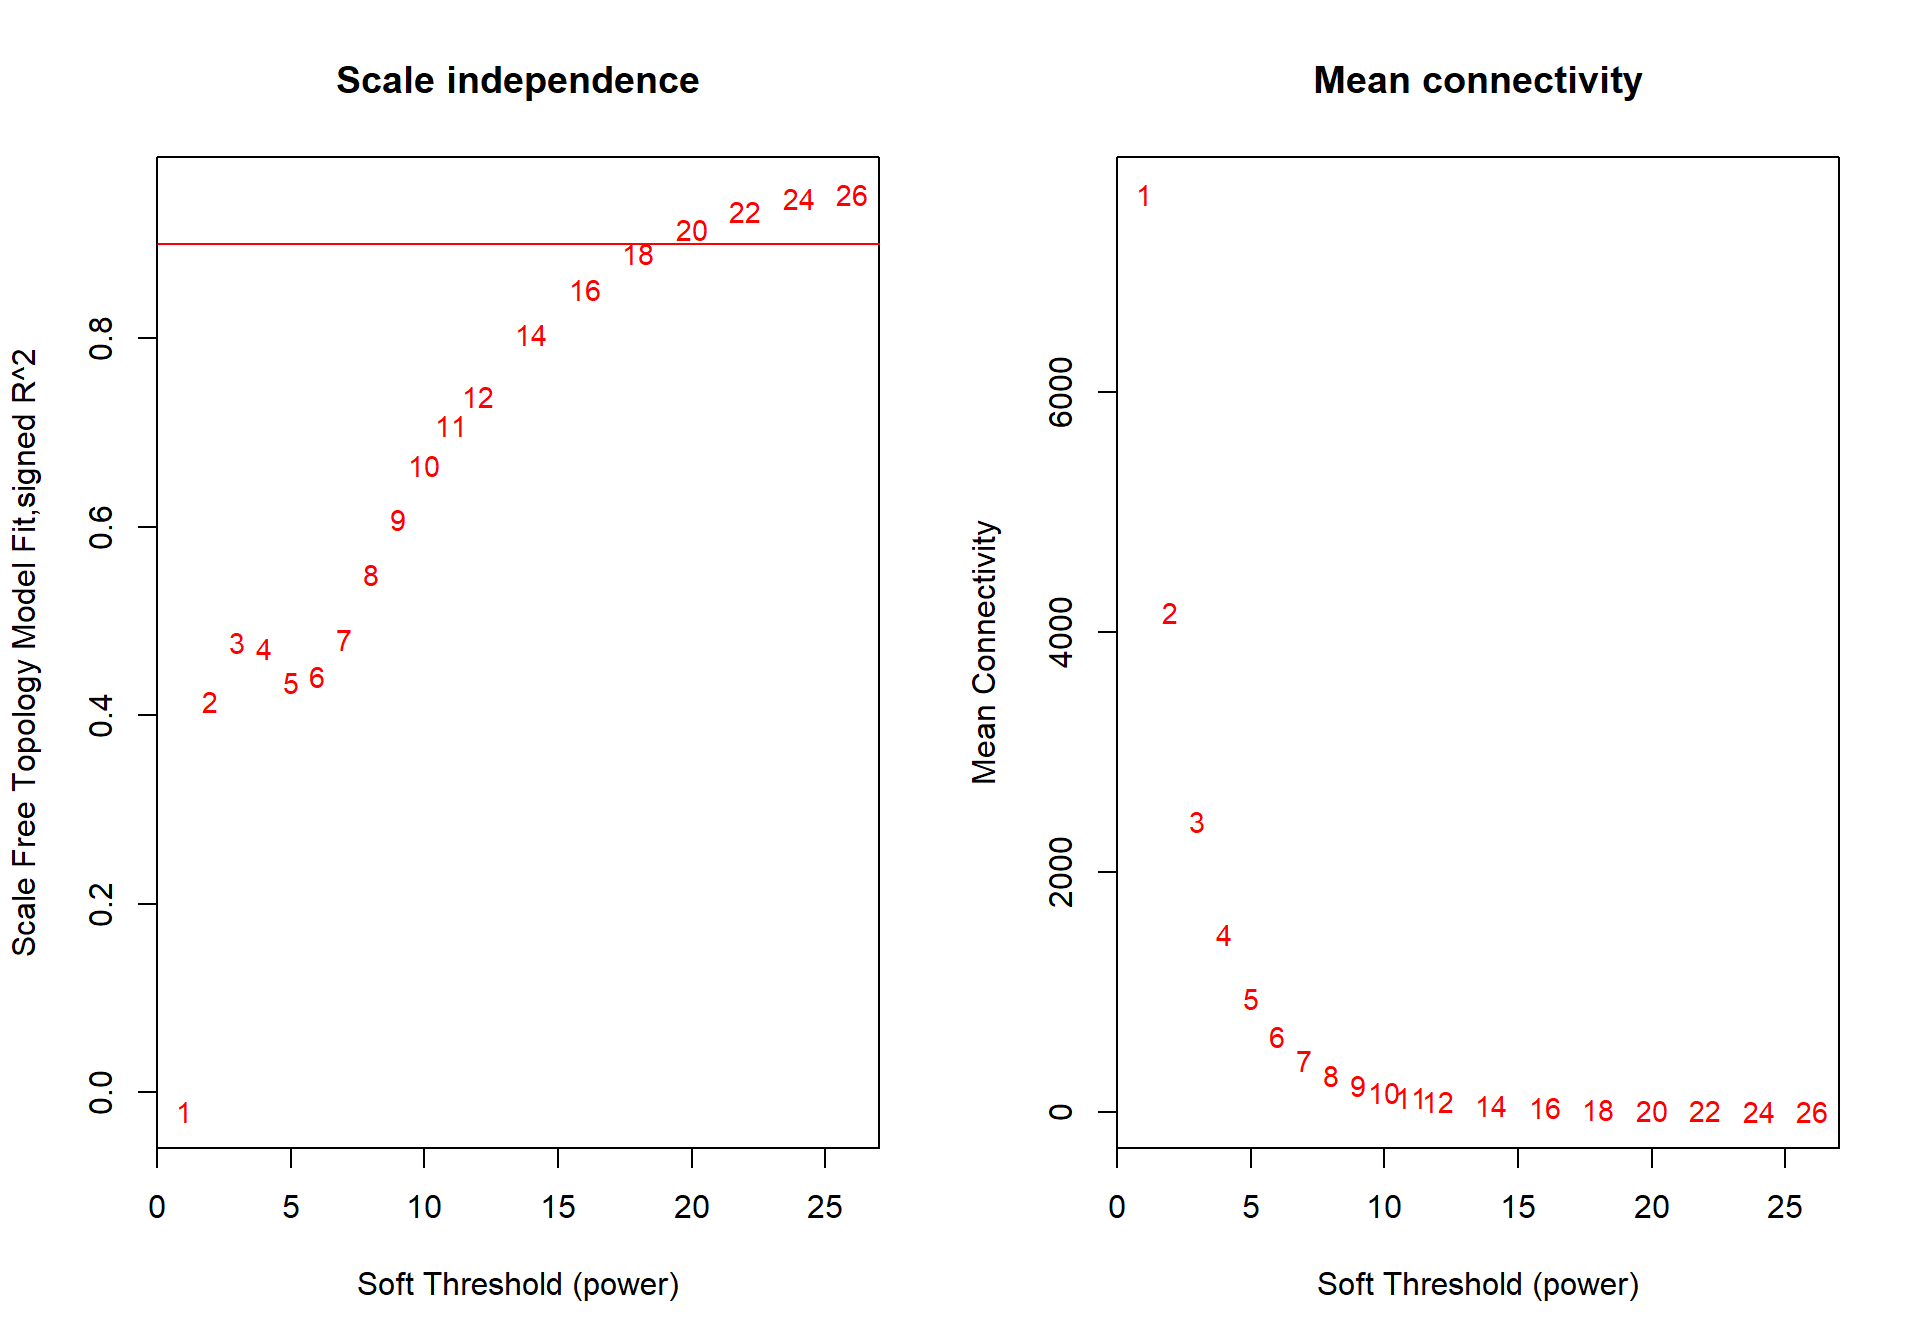
The soft-power selected for POM is 20.
| moduleColors | Freq |
|---|---|
| antiquewhite1 | 157 |
| bisque4 | 199 |
| black | 316 |
| blue2 | 769 |
| blue3 | 48 |
| blue4 | 164 |
| blueviolet | 60 |
| brown | 881 |
| brown1 | 47 |
| brown2 | 661 |
| chocolate4 | 144 |
| coral | 2067 |
| coral1 | 155 |
| coral3 | 185 |
| darkmagenta | 233 |
| darkolivegreen1 | 49 |
| darkolivegreen2 | 225 |
| darkorange | 674 |
| darkorange2 | 97 |
| darkred | 164 |
| darkseagreen1 | 41 |
| darkseagreen2 | 55 |
| darkseagreen3 | 66 |
| darkseagreen4 | 145 |
| darkslateblue | 380 |
| darkturquoise | 158 |
| darkviolet | 71 |
| deeppink1 | 47 |
| firebrick2 | 106 |
| firebrick3 | 153 |
| firebrick4 | 74 |
| floralwhite | 391 |
| green4 | 55 |
| honeydew | 66 |
| honeydew1 | 87 |
| indianred4 | 283 |
| lavenderblush | 43 |
| lavenderblush2 | 66 |
| lightblue3 | 51 |
| lightcoral | 433 |
| lightgreen | 177 |
| lightpink1 | 111 |
| lightpink2 | 108 |
| lightpink4 | 88 |
| lightslateblue | 62 |
| lightsteelblue | 1161 |
| lightsteelblue1 | 163 |
| magenta3 | 57 |
| maroon | 152 |
| mediumpurple1 | 62 |
| mediumpurple4 | 156 |
| moccasin | 44 |
| navajowhite | 334 |
| navajowhite1 | 203 |
| orange | 251 |
| orangered1 | 62 |
| pink3 | 52 |
| pink4 | 63 |
| plum1 | 107 |
| powderblue | 47 |
| purple | 1021 |
| salmon | 216 |
| salmon2 | 69 |
| sienna3 | 112 |
| skyblue | 134 |
| skyblue1 | 82 |
| skyblue4 | 109 |
| tan3 | 45 |
6.1 Interesting Modules
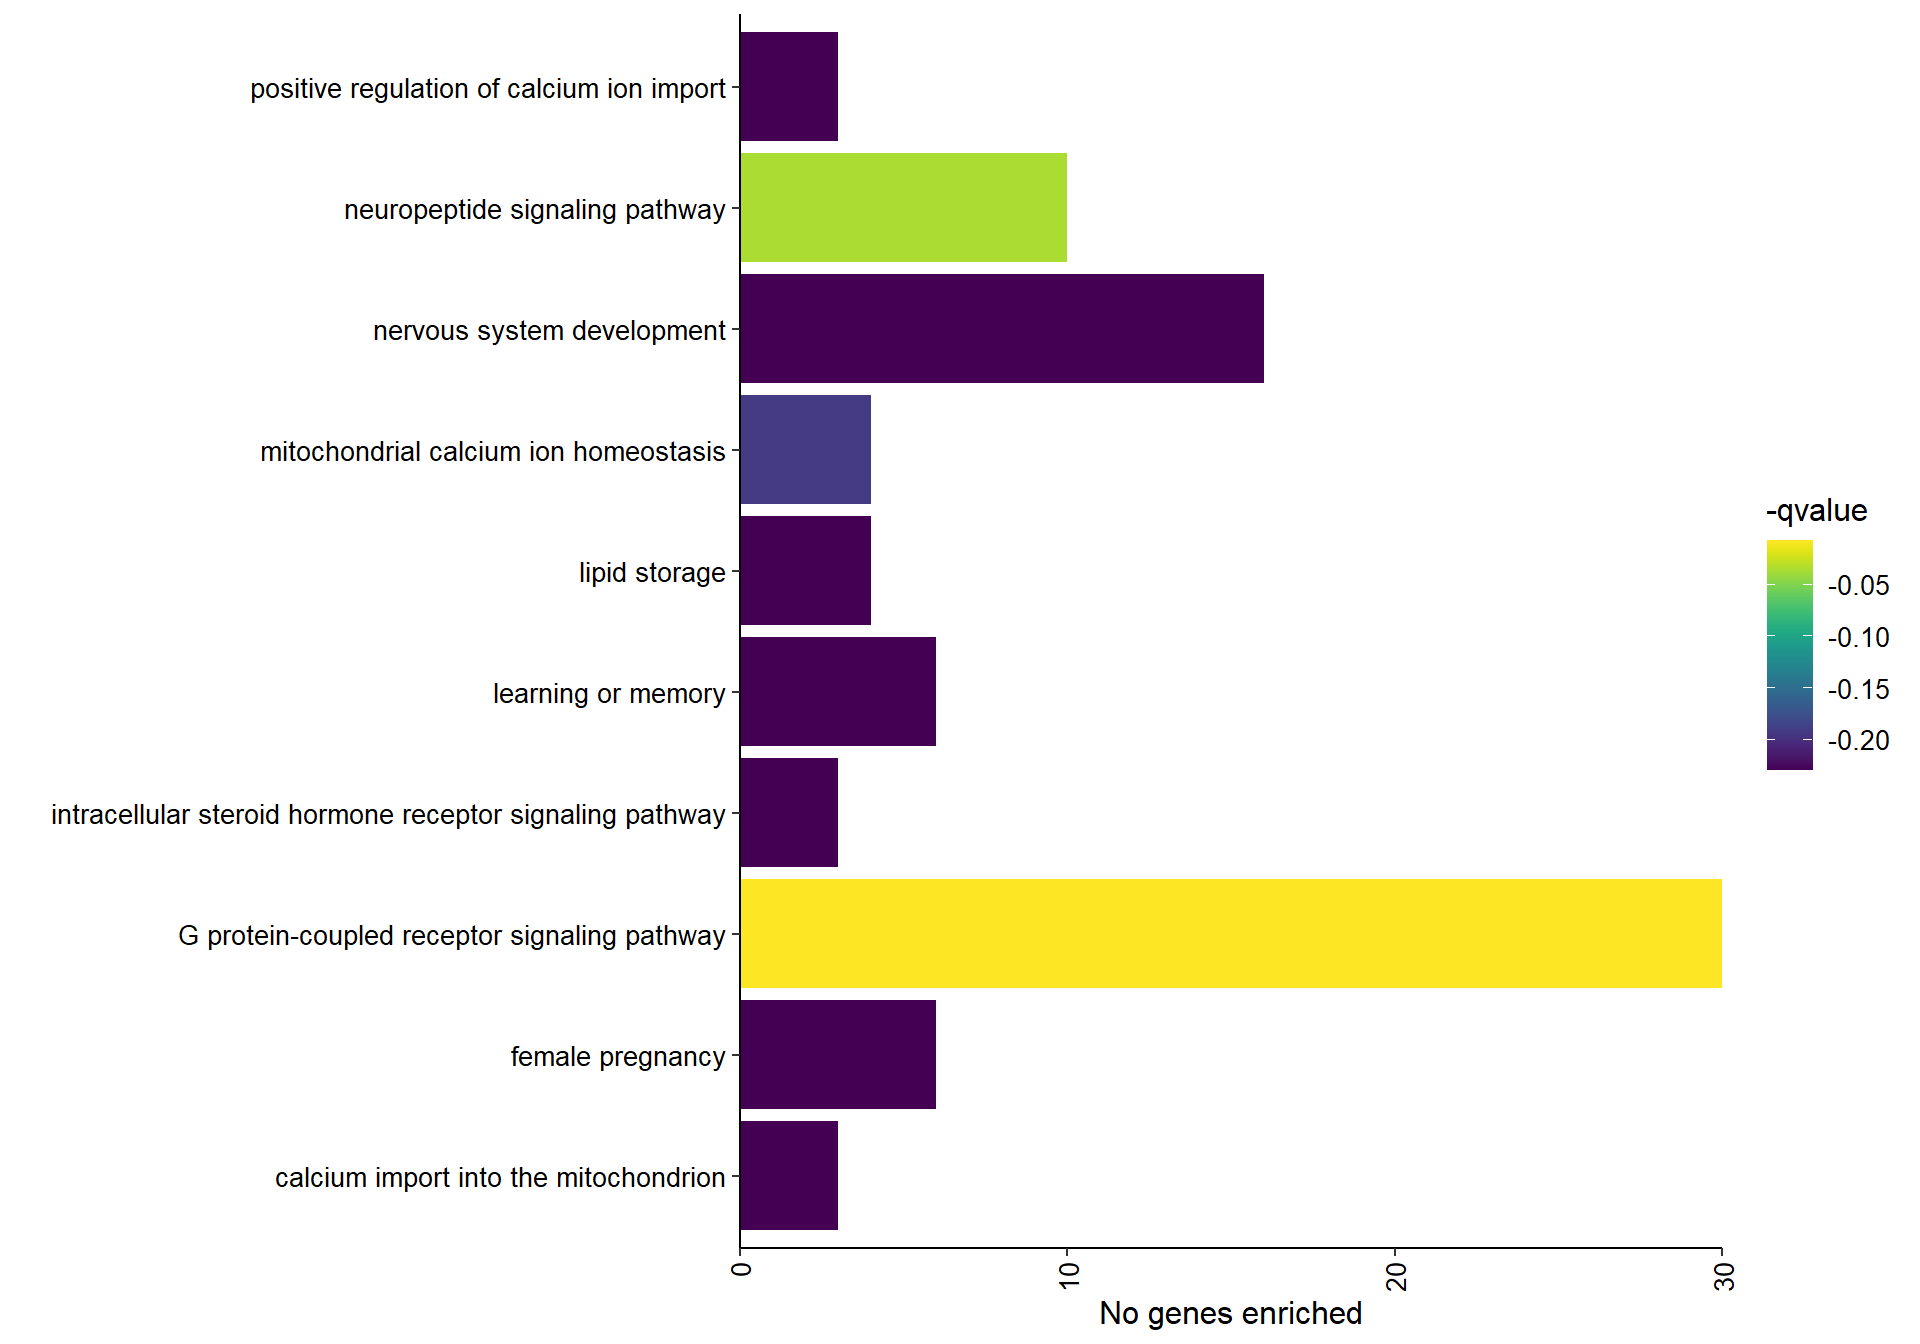
6.1.1 floralwhite module - Status/mean T
6.1.1.1 Gene Ontology
| ID | Description | GeneRatio | BgRatio | pvalue | p.adjust | qvalue | geneID | Count |
|---|---|---|---|---|---|---|---|---|
| GO:0007186 | G protein-coupled receptor signaling pathway | 30/309 | 495/12339 | 0.0000069 | 0.0074407 | 0.0071573 | CXCR2/FZD9/GAL/GALR1/GHRH/GNAI2/GNRH1/GPR21/GPR63/GRPR/HRH2/HTR5A/IAPP/JAK2/LHCGR/LOC113982386/LOC113993087/LOC113993299/LOC114002880/MCHR1/OPRL1/PDE3B/PRLH/QRFPR/RGS20/RORB/RXFP3/SST/SSTR2/UTS2B | 30 |
| GO:0007218 | neuropeptide signaling pathway | 10/309 | 88/12339 | 0.0000672 | 0.0362788 | 0.0348968 | GAL/GALR1/GRPR/LOC113993087/MCHR1/OPRL1/QRFPR/RXFP3/SCG5/SSTR2 | 10 |
| GO:0051560 | mitochondrial calcium ion homeostasis | 4/309 | 16/12339 | 0.0005532 | 0.1989591 | 0.1913796 | IMMT/MAIP1/MCUB/MICU3 | 4 |
| GO:0019915 | lipid storage | 4/309 | 18/12339 | 0.0008940 | 0.2384799 | 0.2293948 | CD36/LDAH/NRIP1/PNPLA2 | 4 |
| GO:0007611 | learning or memory | 6/309 | 50/12339 | 0.0014771 | 0.2384799 | 0.2293948 | CHRNA7/CRHBP/FZD9/GRPR/LOC113982386/PAFAH1B1 | 6 |
| GO:0030518 | intracellular steroid hormone receptor signaling pathway | 3/309 | 10/12339 | 0.0016376 | 0.2384799 | 0.2293948 | AR/NR3C1/PGR | 3 |
| GO:0036444 | calcium import into the mitochondrion | 3/309 | 10/12339 | 0.0016376 | 0.2384799 | 0.2293948 | MAIP1/MCUB/MICU3 | 3 |
| GO:0007399 | nervous system development | 16/309 | 280/12339 | 0.0018609 | 0.2384799 | 0.2293948 | ACTL6B/BPNT1/FGF13/FZD9/GDPD5/GFRA3/GPSM1/LOC113991778/LSAMP/NEURL1B/NRN1/NRN1L/OLFM1/PCSK2/PHF10/PLPPR1 | 16 |
| GO:0007565 | female pregnancy | 6/309 | 53/12339 | 0.0020045 | 0.2384799 | 0.2293948 | CORIN/CRHBP/GNRH1/IGFBP2/LOC113982386/PAPPA | 6 |
| GO:0090280 | positive regulation of calcium ion import | 3/309 | 11/12339 | 0.0022102 | 0.2384799 | 0.2293948 | LOC113982386/LOC114000001/STC1 | 3 |
## preparing gene to GO mapping data...## preparing IC data...## Warning in if (class(try(col2rgb(palette), silent = TRUE)) == "try-error")
## stop("color palette is not correct"): the condition has length > 1 and only the
## first element will be used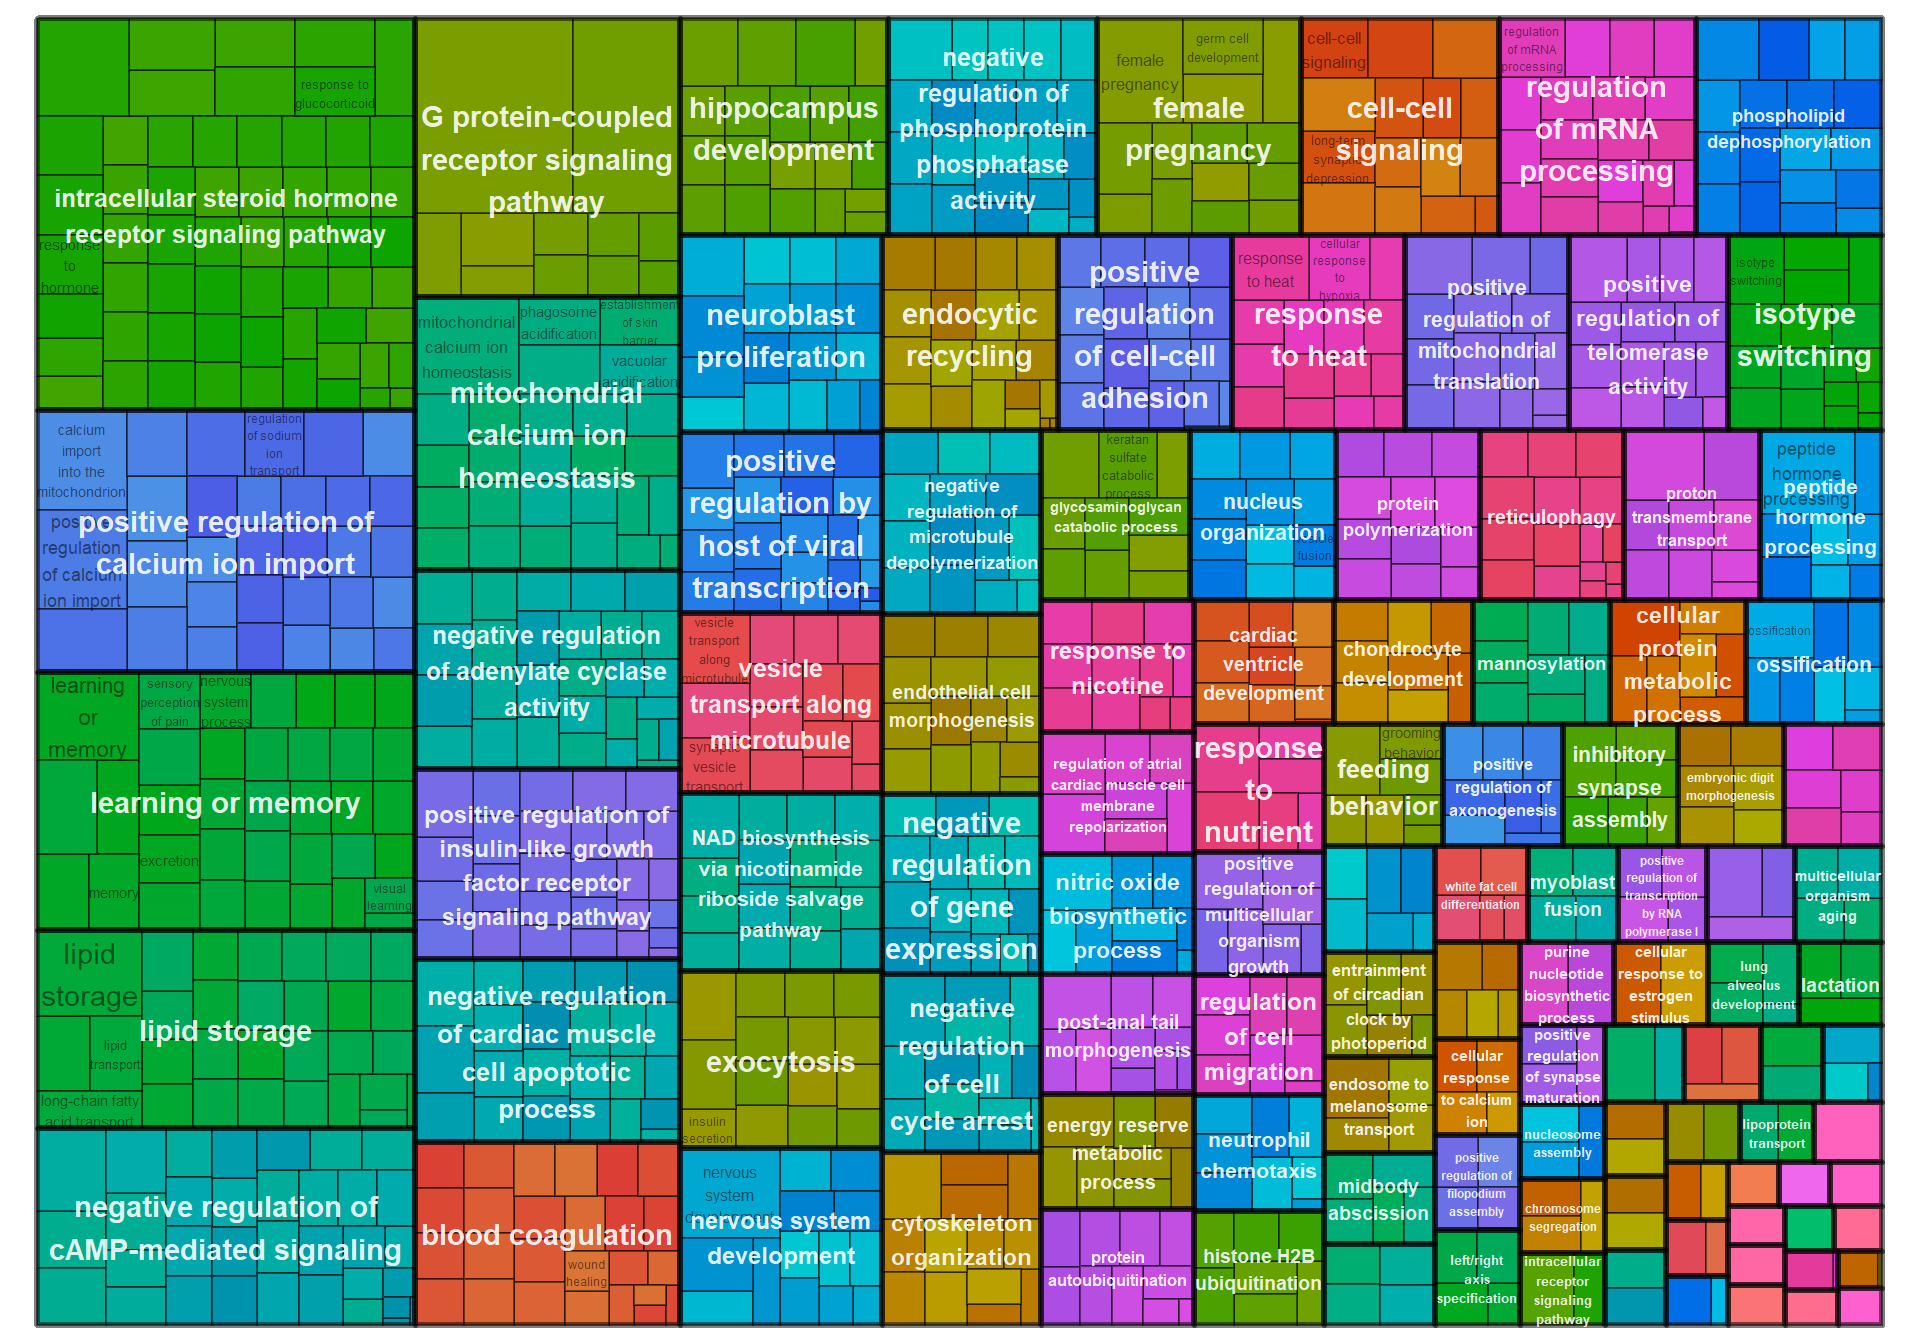
6.1.2 pink3 module - strength
6.1.2.1 Gene Ontology
| ID | Description | GeneRatio | BgRatio | pvalue | p.adjust | qvalue | geneID | Count |
|---|---|---|---|---|---|---|---|---|
| GO:0036444 | calcium import into the mitochondrion | 2/41 | 10/12339 | 0.0004767 | 0.0533864 | 0.0446343 | OPA1/SMDT1 | 2 |
| GO:0015693 | magnesium ion transport | 2/41 | 12/12339 | 0.0006962 | 0.0533864 | 0.0446343 | NIPAL3/TUSC3 | 2 |
| GO:1903830 | magnesium ion transmembrane transport | 2/41 | 13/12339 | 0.0008210 | 0.0533864 | 0.0446343 | NIPAL3/TUSC3 | 2 |
| GO:0048208 | COPII vesicle coating | 3/41 | 60/12339 | 0.0010217 | 0.0533864 | 0.0446343 | CD59/CTSC/PDCD6 | 3 |
| GO:0006094 | gluconeogenesis | 2/41 | 36/12339 | 0.0063185 | 0.1905773 | 0.1593344 | GOT1/PGAM1 | 2 |
| GO:0006110 | regulation of glycolytic process | 2/41 | 40/12339 | 0.0077576 | 0.1905773 | 0.1593344 | NUP35/PGAM1 | 2 |
| GO:0022900 | electron transport chain | 2/41 | 46/12339 | 0.0101654 | 0.1905773 | 0.1593344 | LOC114003129/NDUFAF2 | 2 |
| GO:0006487 | protein N-linked glycosylation | 2/41 | 48/12339 | 0.0110326 | 0.1905773 | 0.1593344 | DOLPP1/TUSC3 | 2 |
| GO:0032981 | mitochondrial respiratory chain complex I assembly | 2/41 | 49/12339 | 0.0114780 | 0.1905773 | 0.1593344 | NDUFAF2/NDUFB1 | 2 |
| GO:0036297 | interstrand cross-link repair | 2/41 | 50/12339 | 0.0119313 | 0.1905773 | 0.1593344 | FANCE/NEIL3 | 2 |
## preparing gene to GO mapping data...## preparing IC data...## Warning in if (class(try(col2rgb(palette), silent = TRUE)) == "try-error")
## stop("color palette is not correct"): the condition has length > 1 and only the
## first element will be used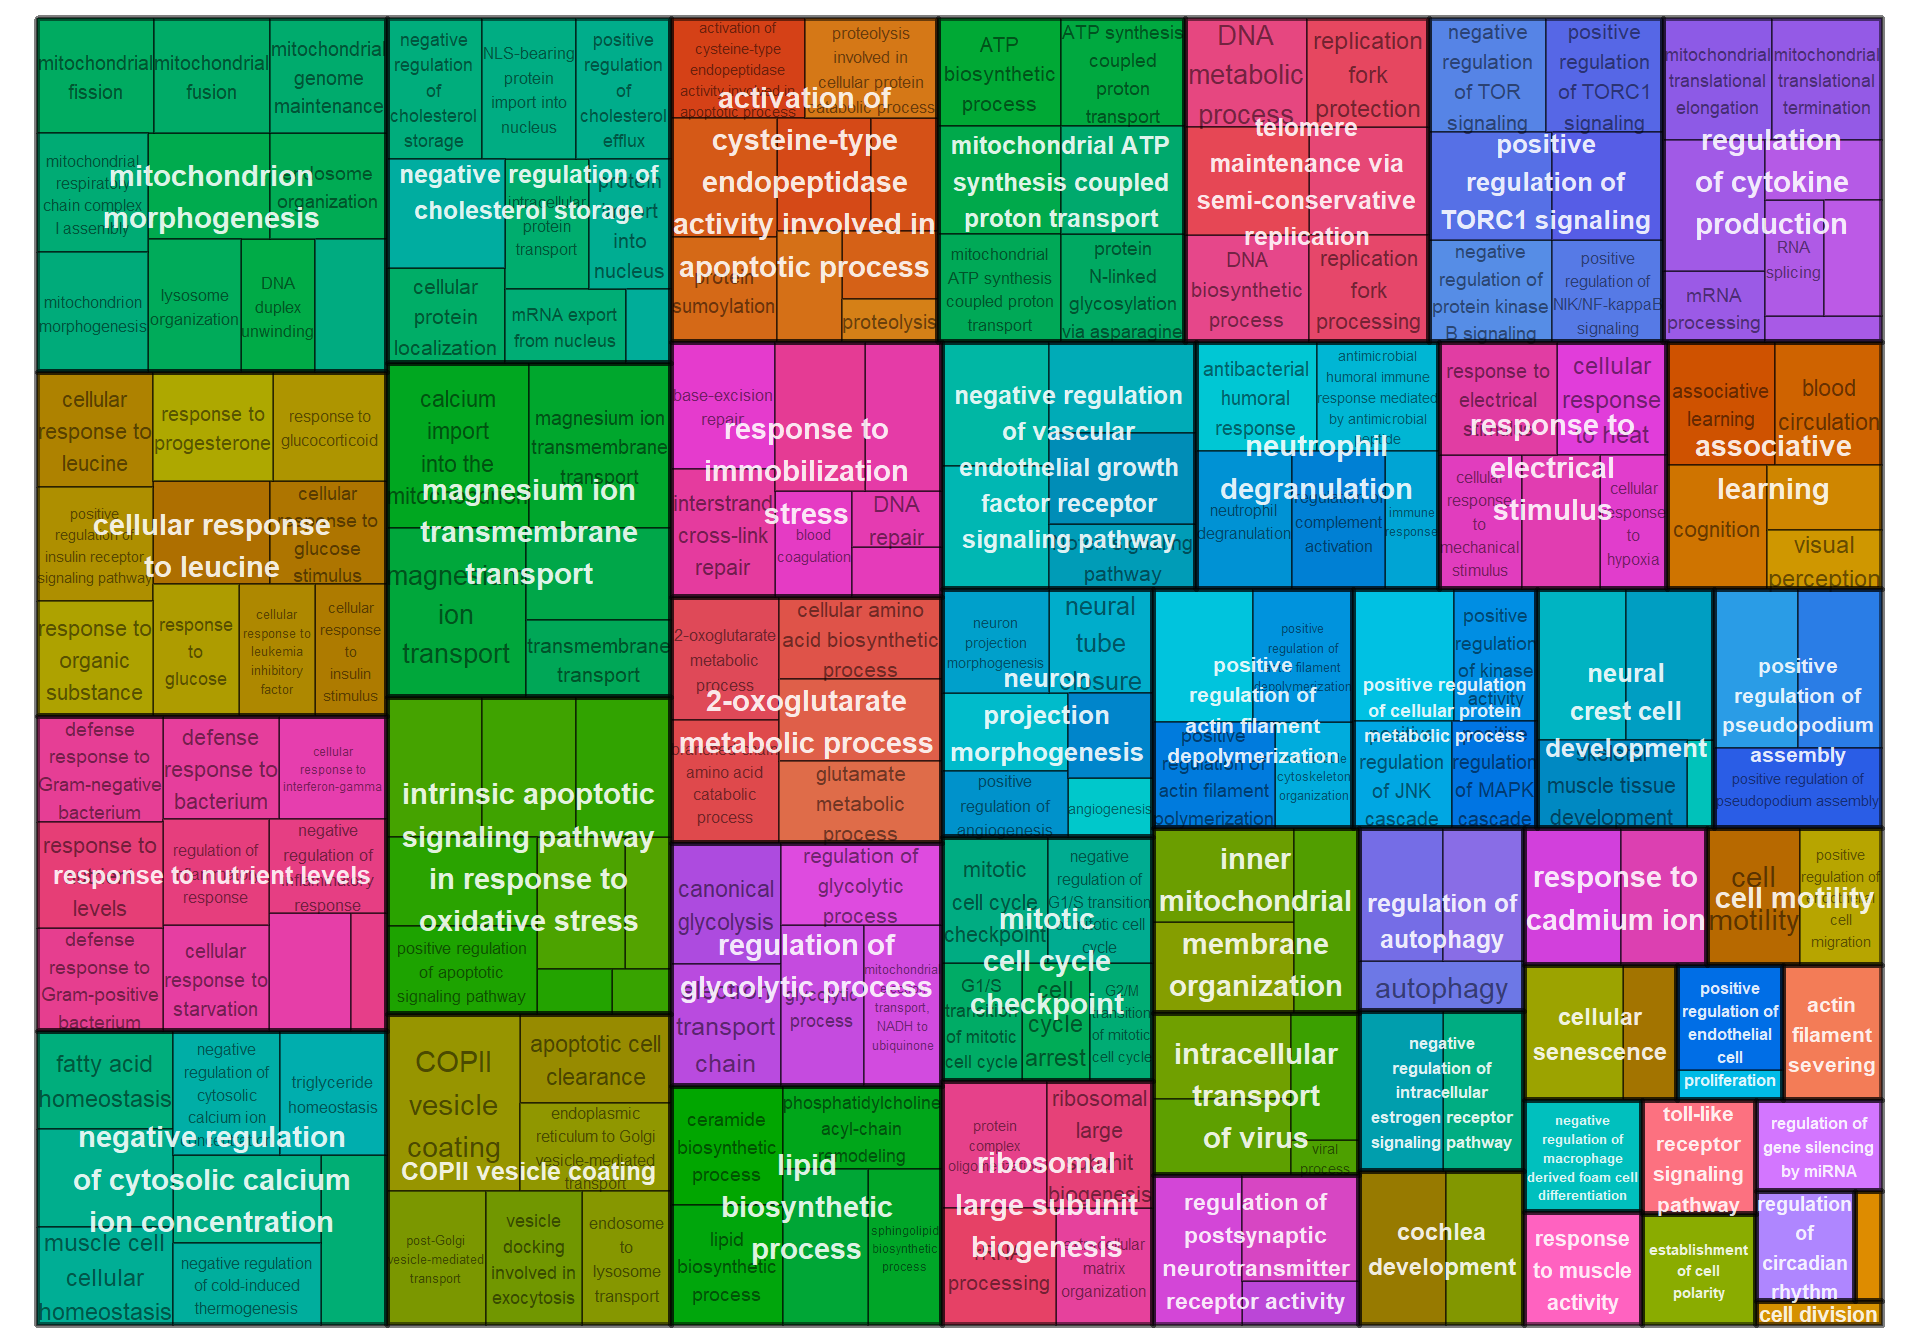
6.1.3 mediumpurple1 - mean testosterone
6.1.3.1 Gene Ontology
| ID | Description | GeneRatio | BgRatio | pvalue | p.adjust | qvalue | geneID | Count |
|---|---|---|---|---|---|---|---|---|
| GO:0007084 | mitotic nuclear envelope reassembly | 2/41 | 10/12339 | 0.0004767 | 0.0517006 | 0.0420245 | LMNA/PPP2R2A | 2 |
| GO:0033622 | integrin activation | 2/41 | 10/12339 | 0.0004767 | 0.0517006 | 0.0420245 | LOC113991759/TLN1 | 2 |
| GO:0036498 | IRE1-mediated unfolded protein response | 3/41 | 50/12339 | 0.0005988 | 0.0517006 | 0.0420245 | LMNA/LOC113991759/TLN1 | 3 |
| GO:0031398 | positive regulation of protein ubiquitination | 3/41 | 66/12339 | 0.0013476 | 0.0723435 | 0.0588039 | AXIN1/LOC113992269/TRAF6 | 3 |
| GO:0032147 | activation of protein kinase activity | 3/41 | 67/12339 | 0.0014075 | 0.0723435 | 0.0588039 | AXIN1/LOC113985569/TRAF6 | 3 |
| GO:2000060 | positive regulation of ubiquitin-dependent protein catabolic process | 2/41 | 19/12339 | 0.0017773 | 0.0723435 | 0.0588039 | AXIN1/LOC113992269 | 2 |
| GO:0006936 | muscle contraction | 3/41 | 81/12339 | 0.0024275 | 0.0723435 | 0.0588039 | LOC113991759/PXN/TLN1 | 3 |
| GO:0007160 | cell-matrix adhesion | 3/41 | 82/12339 | 0.0025139 | 0.0723435 | 0.0588039 | ADAMTS13/PXN/SNED1 | 3 |
| GO:0007229 | integrin-mediated signaling pathway | 3/41 | 82/12339 | 0.0025139 | 0.0723435 | 0.0588039 | ADAMTS13/LOC113991759/TLN1 | 3 |
| GO:0030866 | cortical actin cytoskeleton organization | 2/41 | 31/12339 | 0.0047128 | 0.1220611 | 0.0992165 | LOC113991759/TLN1 | 2 |
## preparing gene to GO mapping data...## preparing IC data...## Warning in if (class(try(col2rgb(palette), silent = TRUE)) == "try-error")
## stop("color palette is not correct"): the condition has length > 1 and only the
## first element will be used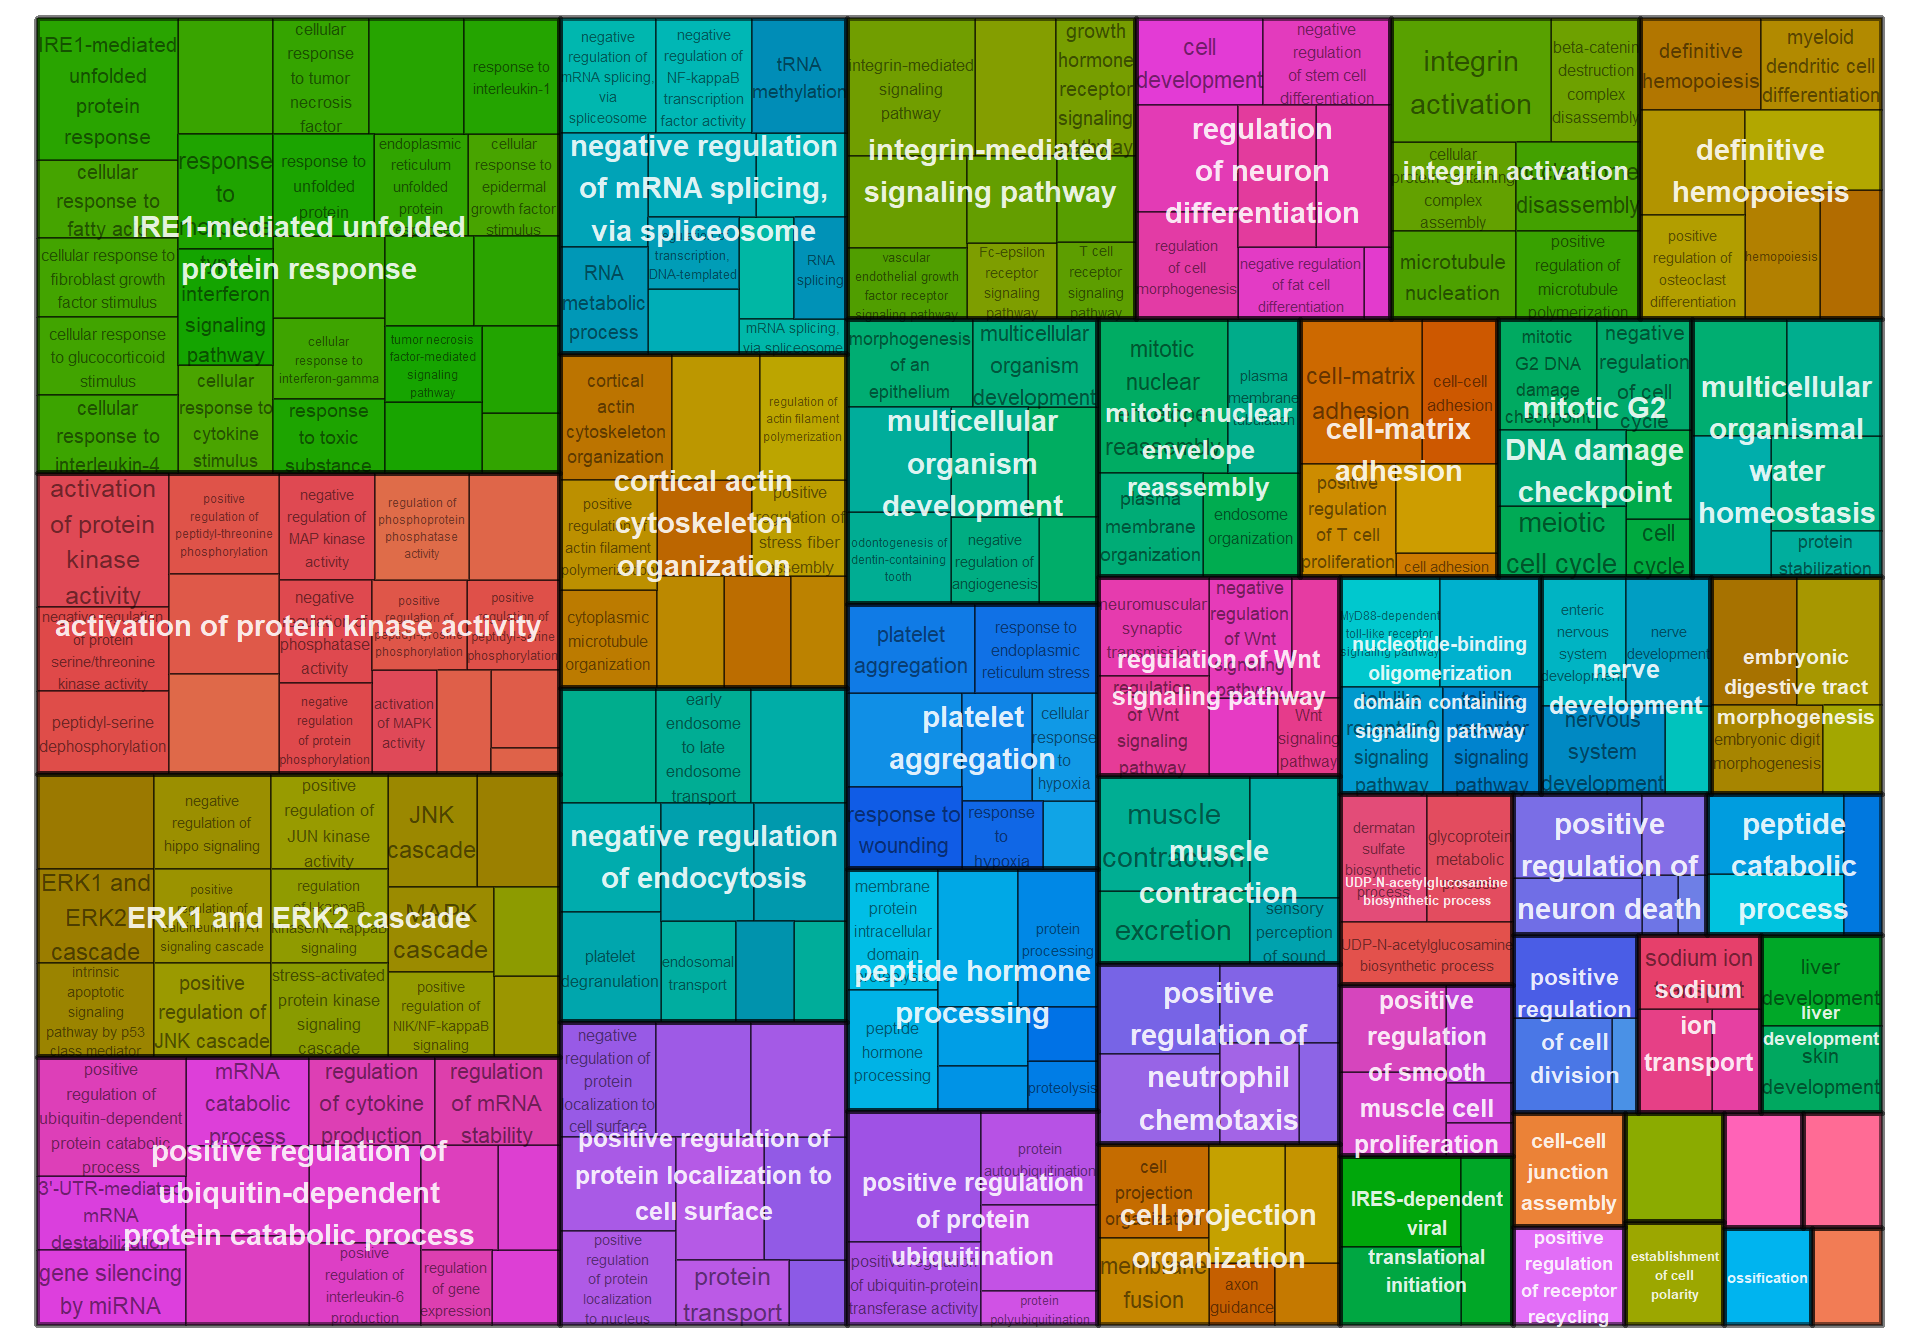
6.1.4 sienna3 - strength
6.1.4.1 Gene Ontology
| ID | Description | GeneRatio | BgRatio | pvalue | p.adjust | qvalue | geneID | Count |
|---|---|---|---|---|---|---|---|---|
| GO:0030433 | ubiquitin-dependent ERAD pathway | 4/92 | 58/12339 | 0.0009028 | 0.2416790 | 0.2368751 | DNAJB14/LOC113995895/RNF103/UBE2G2 | 4 |
| GO:0006891 | intra-Golgi vesicle-mediated transport | 3/92 | 28/12339 | 0.0011481 | 0.2416790 | 0.2368751 | GABARAPL2/GOSR1/NAPG | 3 |
| GO:0006885 | regulation of pH | 2/92 | 10/12339 | 0.0023802 | 0.2852676 | 0.2795972 | EDNRB/SLC26A4 | 2 |
| GO:0045600 | positive regulation of fat cell differentiation | 3/92 | 41/12339 | 0.0034838 | 0.2852676 | 0.2795972 | CREBL2/LOC113993849/SYAP1 | 3 |
| GO:0031573 | intra-S DNA damage checkpoint | 2/92 | 13/12339 | 0.0040661 | 0.2852676 | 0.2795972 | ATF2/EME1 | 2 |
| GO:0006112 | energy reserve metabolic process | 2/92 | 15/12339 | 0.0054208 | 0.2852676 | 0.2795972 | GNAS/KL | 2 |
| GO:0031396 | regulation of protein ubiquitination | 2/92 | 15/12339 | 0.0054208 | 0.2852676 | 0.2795972 | DCUN1D1/PINK1 | 2 |
| GO:0033146 | regulation of intracellular estrogen receptor signaling pathway | 2/92 | 15/12339 | 0.0054208 | 0.2852676 | 0.2795972 | LOC113993849/UFSP2 | 2 |
| GO:0045071 | negative regulation of viral genome replication | 2/92 | 17/12339 | 0.0069536 | 0.3252720 | 0.3188064 | BTBD17/EIF2AK2 | 2 |
| GO:0051443 | positive regulation of ubiquitin-protein transferase activity | 2/92 | 18/12339 | 0.0077850 | 0.3277496 | 0.3212347 | DCUN1D1/PINK1 | 2 |
## preparing gene to GO mapping data...## preparing IC data...## Warning in if (class(try(col2rgb(palette), silent = TRUE)) == "try-error")
## stop("color palette is not correct"): the condition has length > 1 and only the
## first element will be used
7 Dorsomedial Intercollicular Nucleus (ICo)
## [1] 15071## Warning in DESeqDataSet(se, design = design, ignoreRank): some variables in
## design formula are characters, converting to factors## estimating size factors## estimating dispersions## gene-wise dispersion estimates## mean-dispersion relationship## final dispersion estimates## fitting model and testing## Power SFT.R.sq slope truncated.R.sq mean.k. median.k. max.k.
## 1 1 0.0312 25.70 0.970 7540.0 7540.0 7670
## 2 2 0.0490 -4.86 0.903 4250.0 4230.0 4730
## 3 3 0.1430 -3.42 0.860 2600.0 2570.0 3280
## 4 4 0.2250 -2.48 0.856 1700.0 1660.0 2420
## 5 5 0.3260 -2.05 0.880 1160.0 1120.0 1860
## 6 6 0.4310 -1.98 0.902 830.0 788.0 1490
## 7 7 0.5200 -2.00 0.915 610.0 568.0 1230
## 8 8 0.5820 -2.02 0.918 460.0 420.0 1030
## 9 9 0.6320 -2.04 0.923 355.0 317.0 883
## 10 10 0.6730 -2.04 0.931 279.0 243.0 762
## 11 11 0.6950 -2.05 0.932 223.0 189.0 665
## 12 12 0.7230 -2.04 0.939 180.0 149.0 584
## 13 14 0.7460 -2.06 0.940 123.0 95.7 462
## 14 16 0.7750 -2.04 0.949 86.8 63.6 373
## 15 18 0.7800 -2.05 0.947 63.4 43.6 306
## 16 20 0.7980 -2.02 0.952 47.6 30.7 255
## 17 22 0.8110 -1.99 0.956 36.5 22.1 215
## 18 24 0.8190 -1.97 0.956 28.5 16.3 183
## 19 26 0.8340 -1.92 0.960 22.7 12.2 157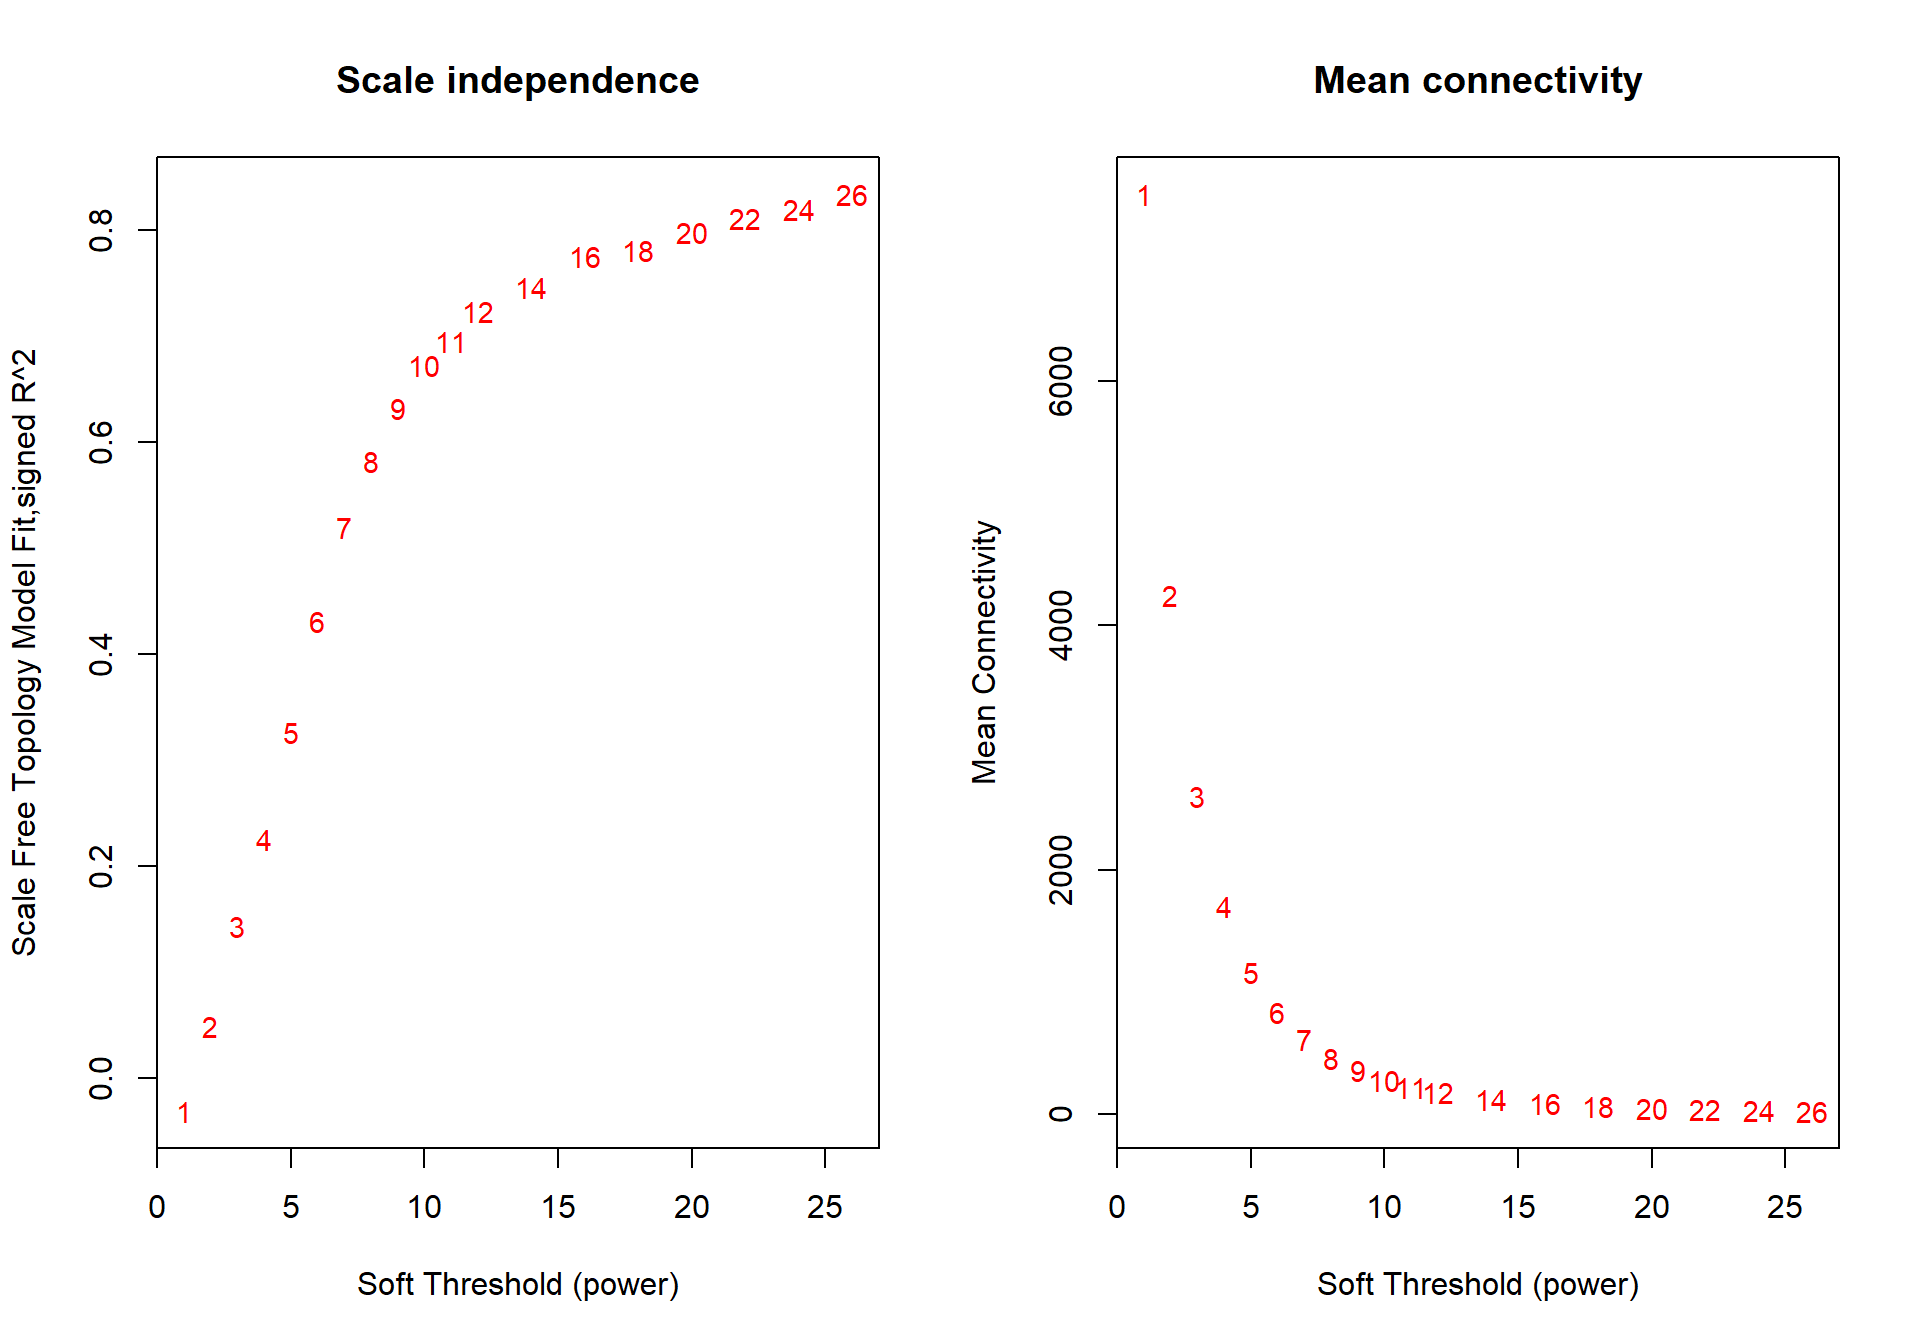
The soft-power selected for ICO is 18.
## [1] TRUE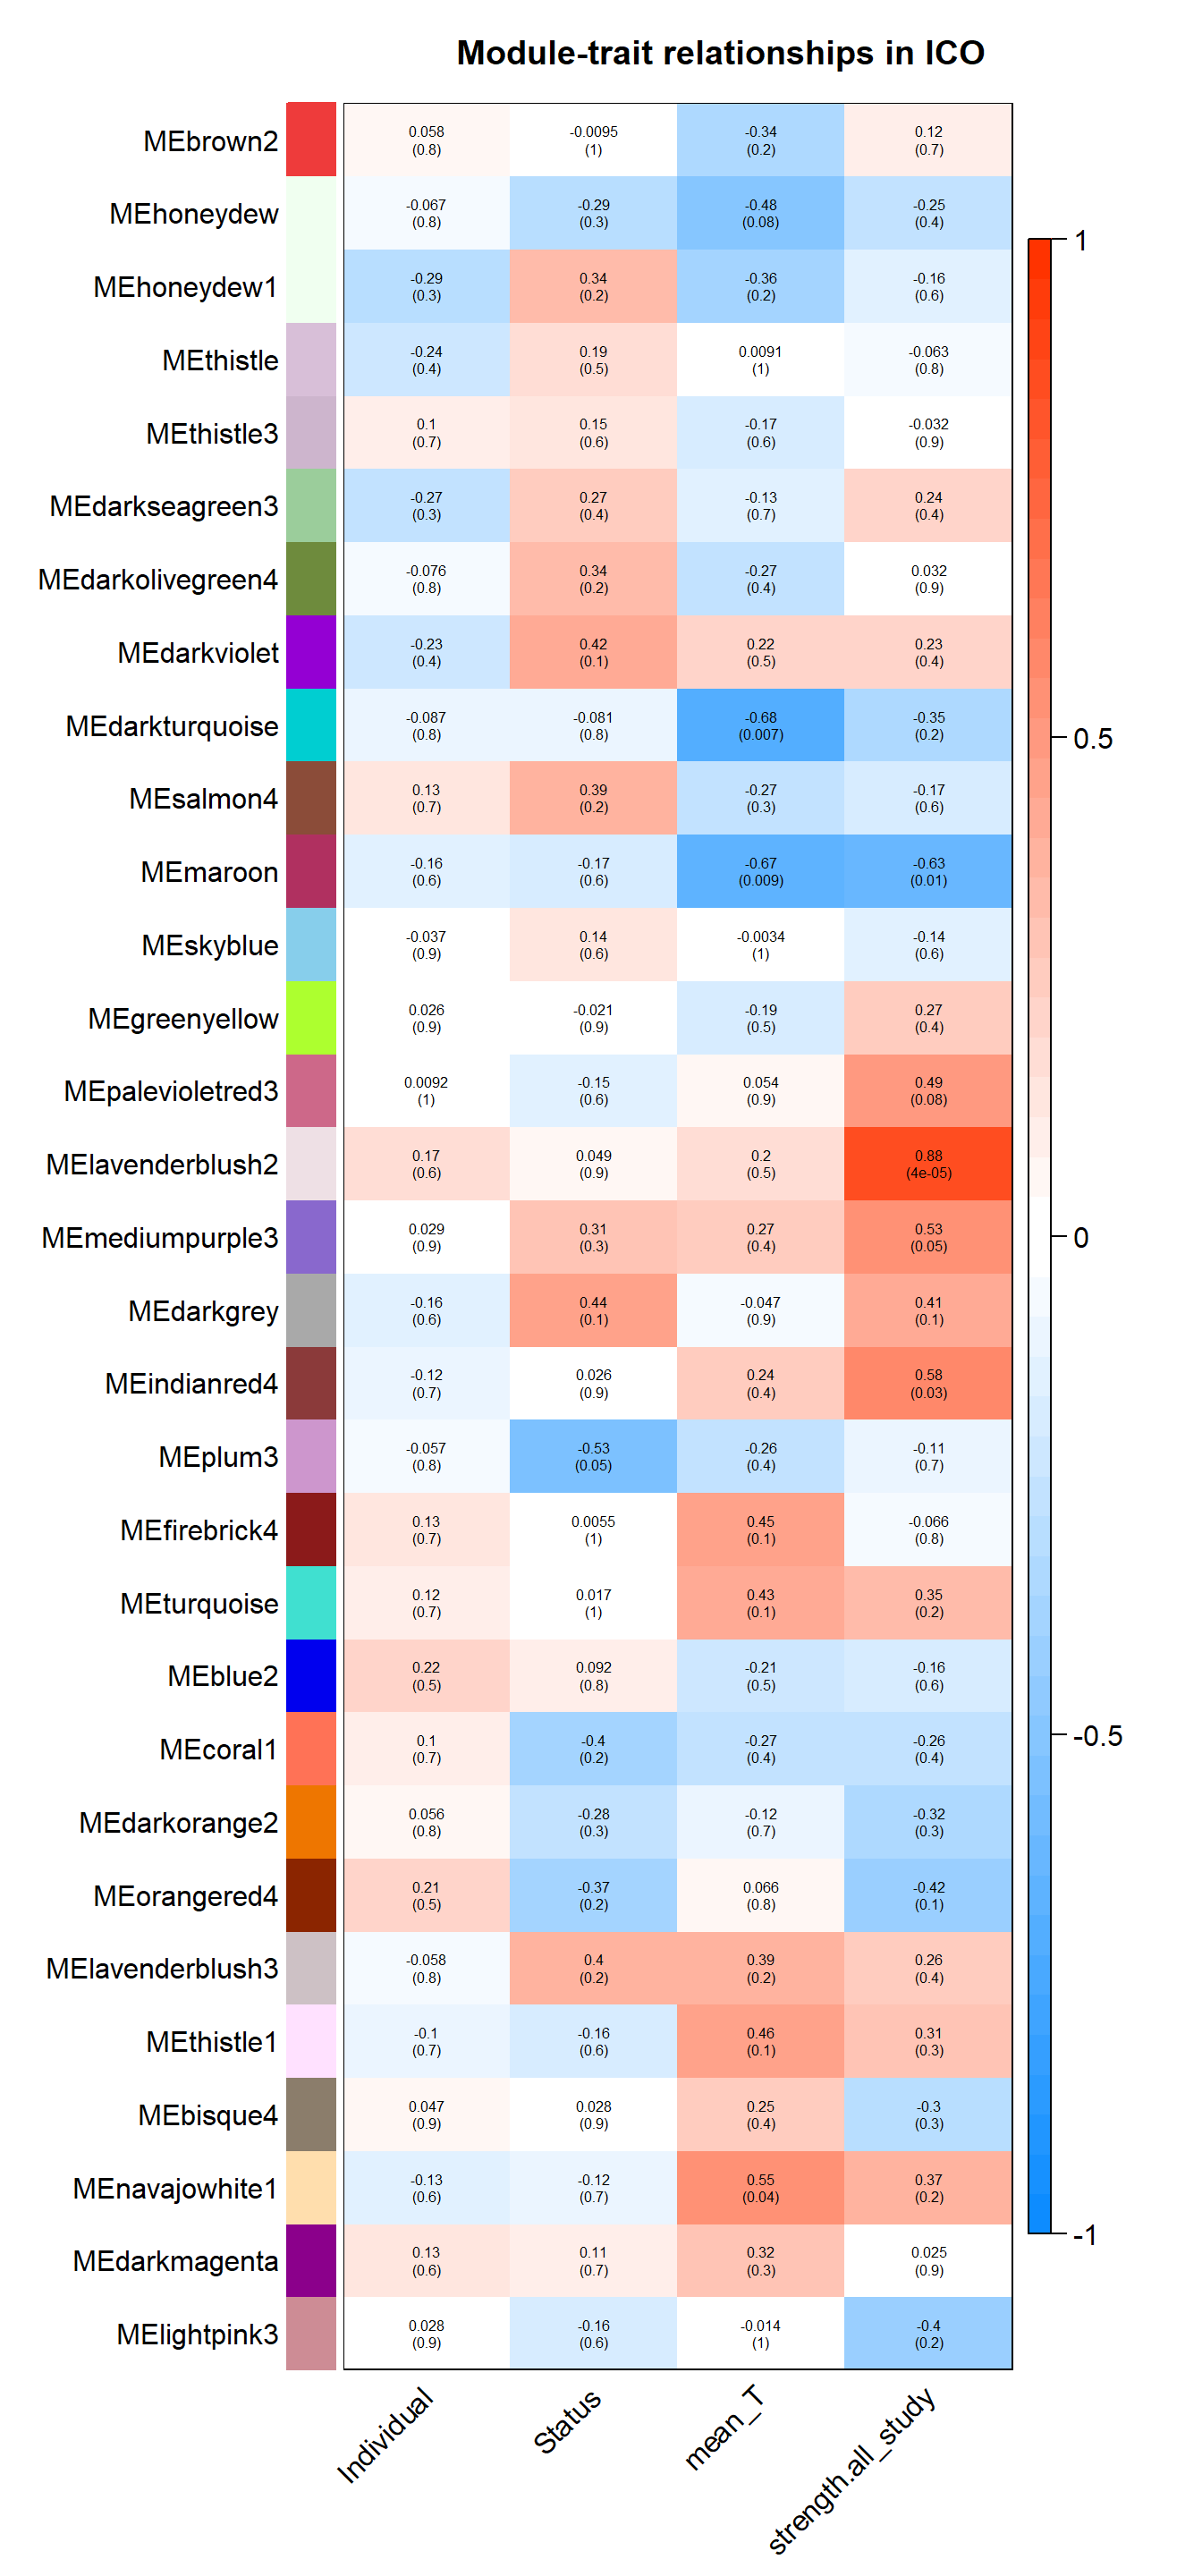
| moduleColors | Freq |
|---|---|
| bisque4 | 1297 |
| blue2 | 63 |
| brown2 | 618 |
| coral1 | 1201 |
| darkgrey | 1339 |
| darkmagenta | 490 |
| darkolivegreen4 | 68 |
| darkorange2 | 513 |
| darkseagreen3 | 2480 |
| darkturquoise | 363 |
| darkviolet | 631 |
| firebrick4 | 265 |
| greenyellow | 521 |
| honeydew | 45 |
| honeydew1 | 85 |
| indianred4 | 69 |
| lavenderblush2 | 47 |
| lavenderblush3 | 86 |
| lightpink3 | 49 |
| maroon | 237 |
| mediumpurple3 | 116 |
| navajowhite1 | 54 |
| orangered4 | 2718 |
| palevioletred3 | 90 |
| plum3 | 59 |
| salmon4 | 92 |
| skyblue | 169 |
| thistle | 57 |
| thistle1 | 93 |
| thistle3 | 57 |
| turquoise | 1097 |
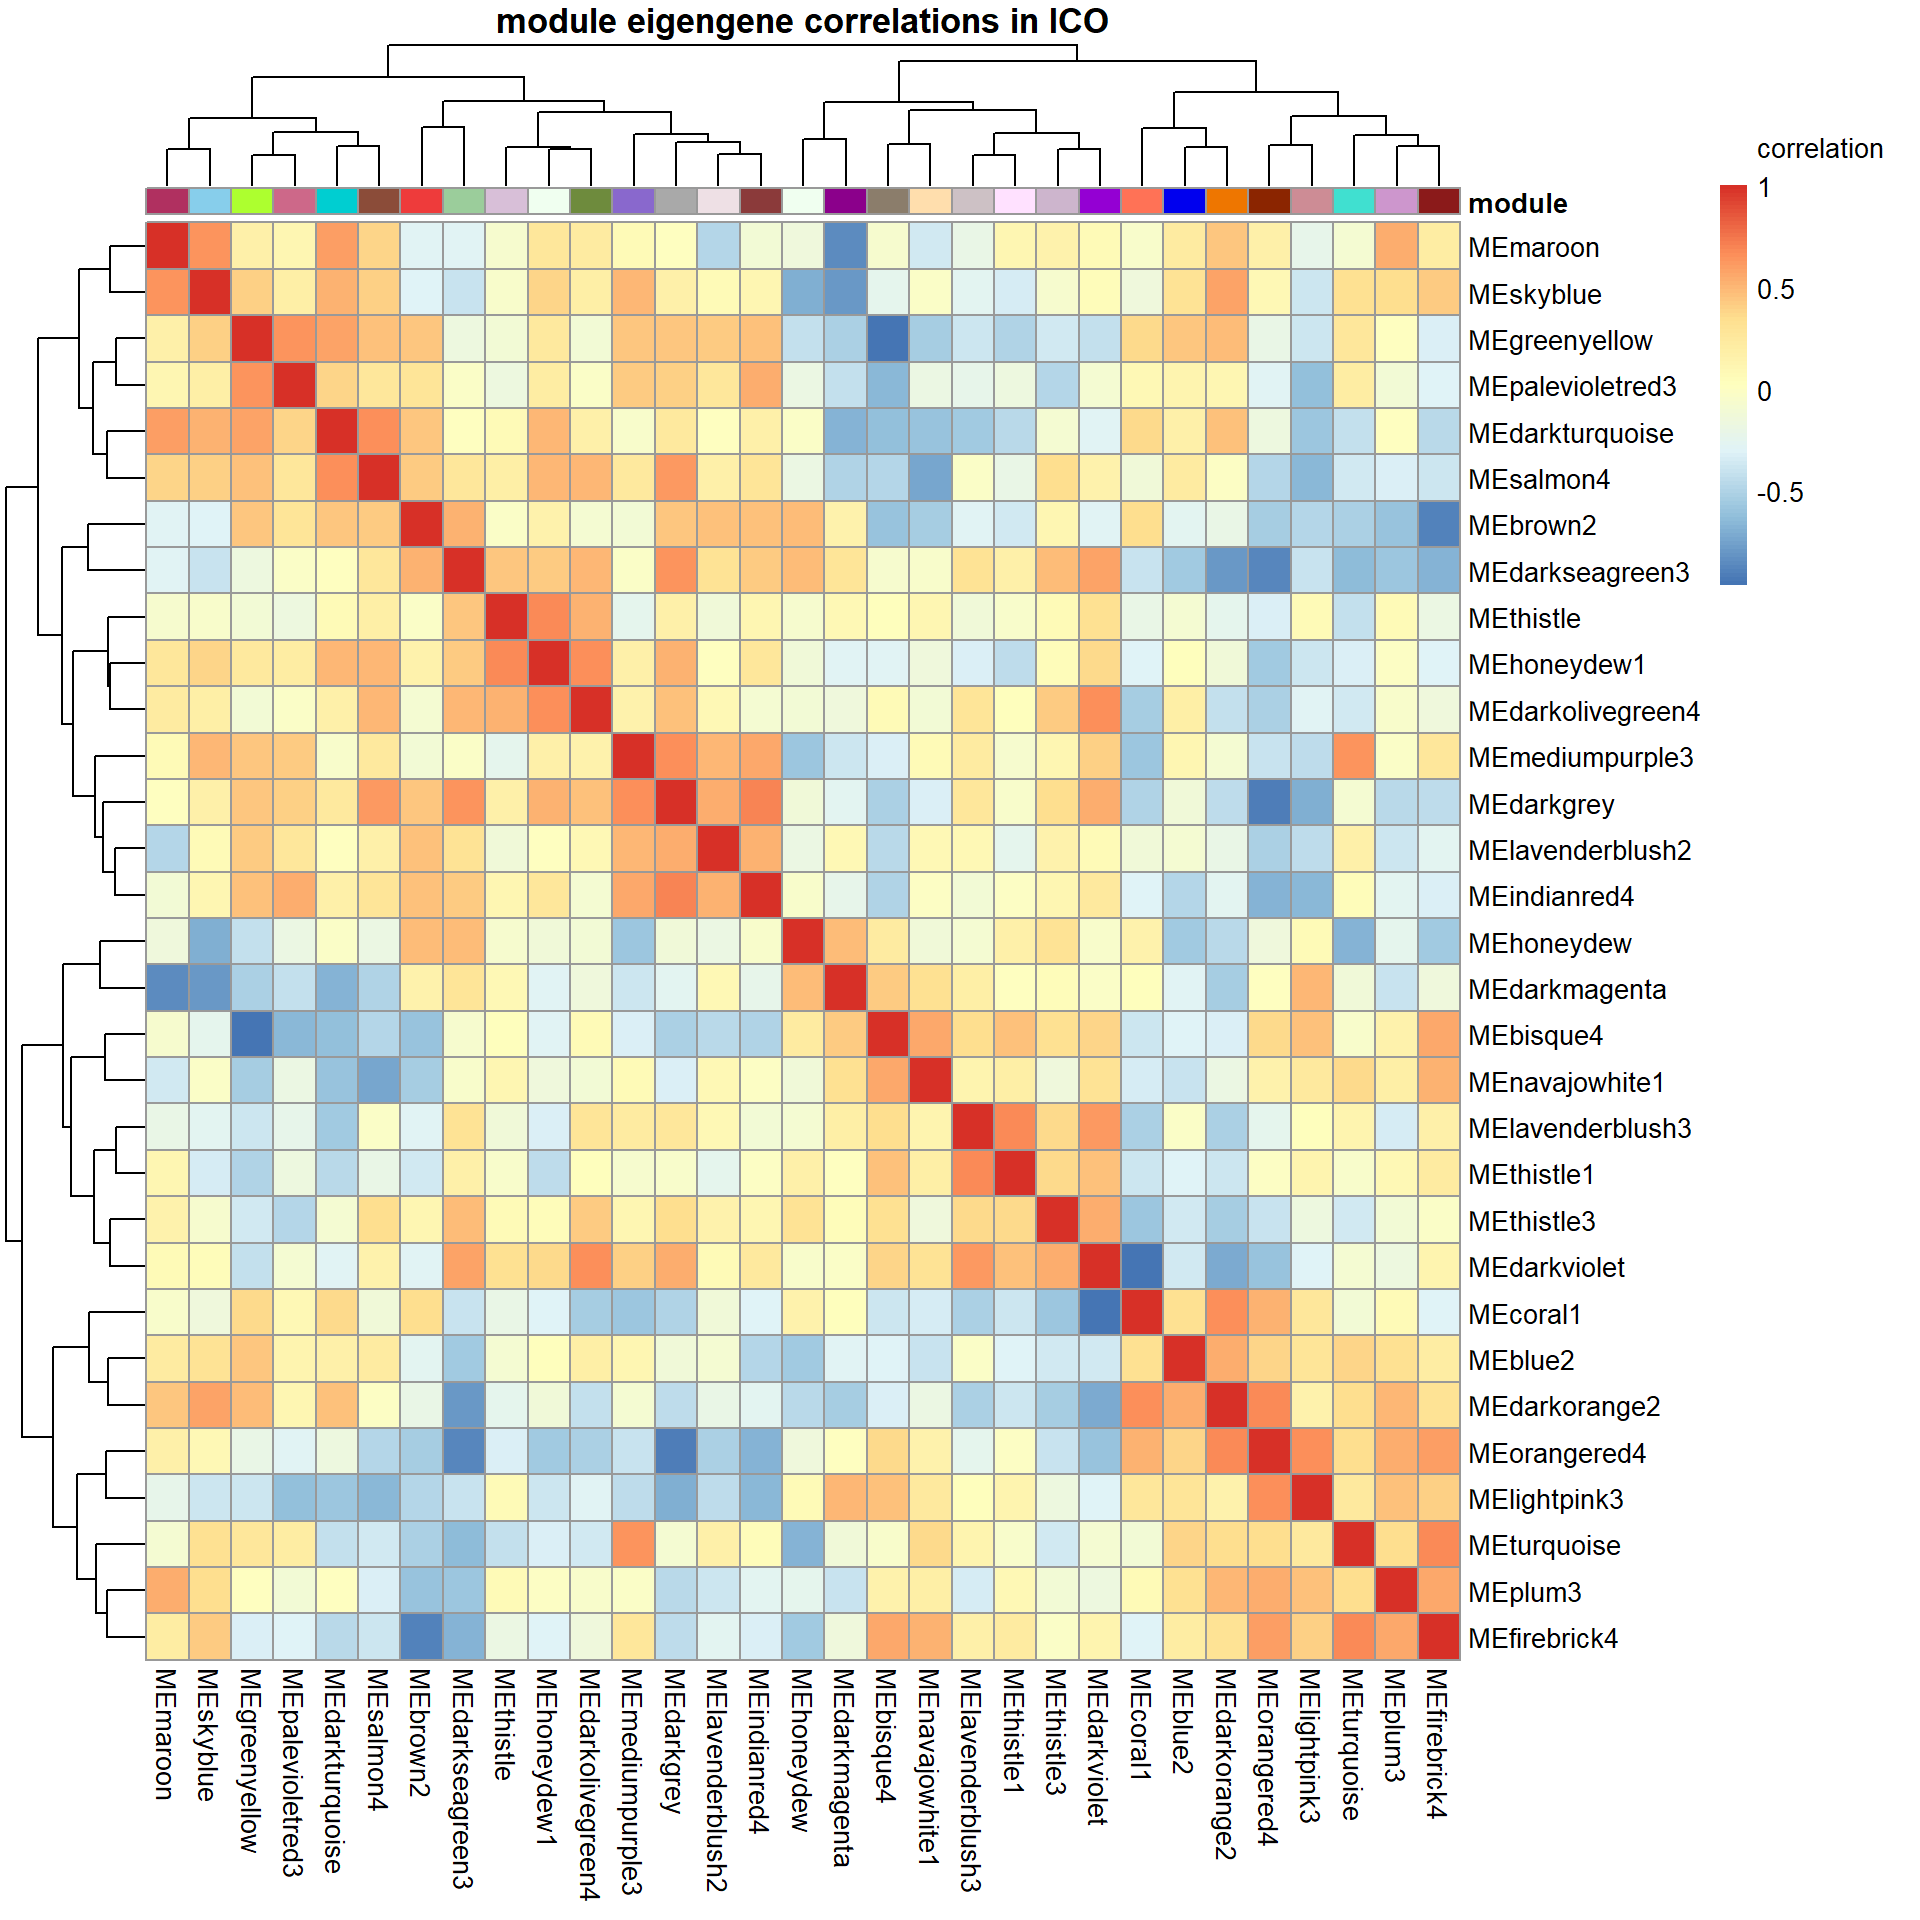
There appears to be no correlations between modules of interest.
7.1 Interesting Modules
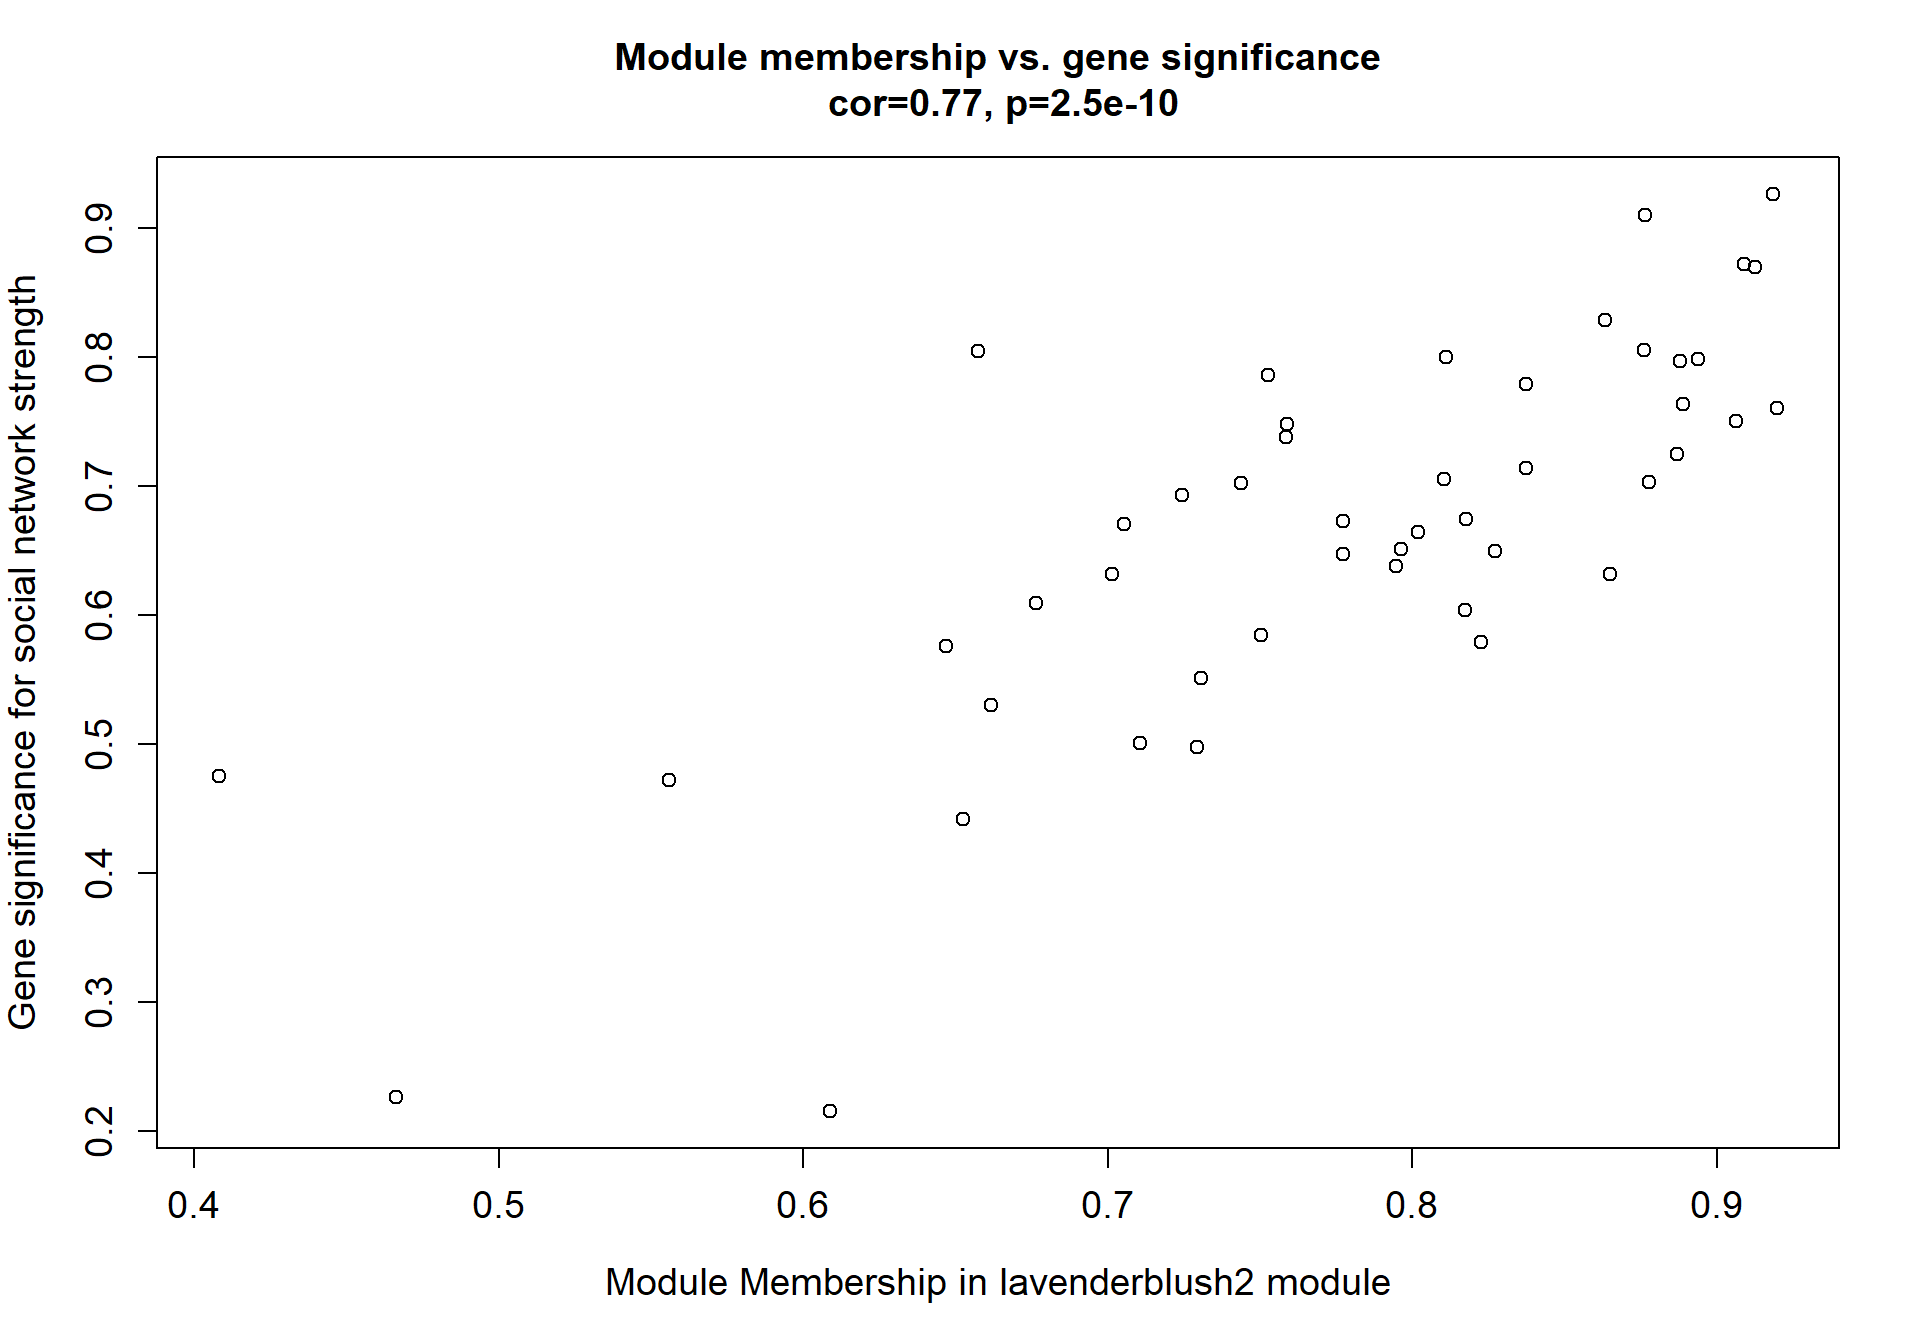
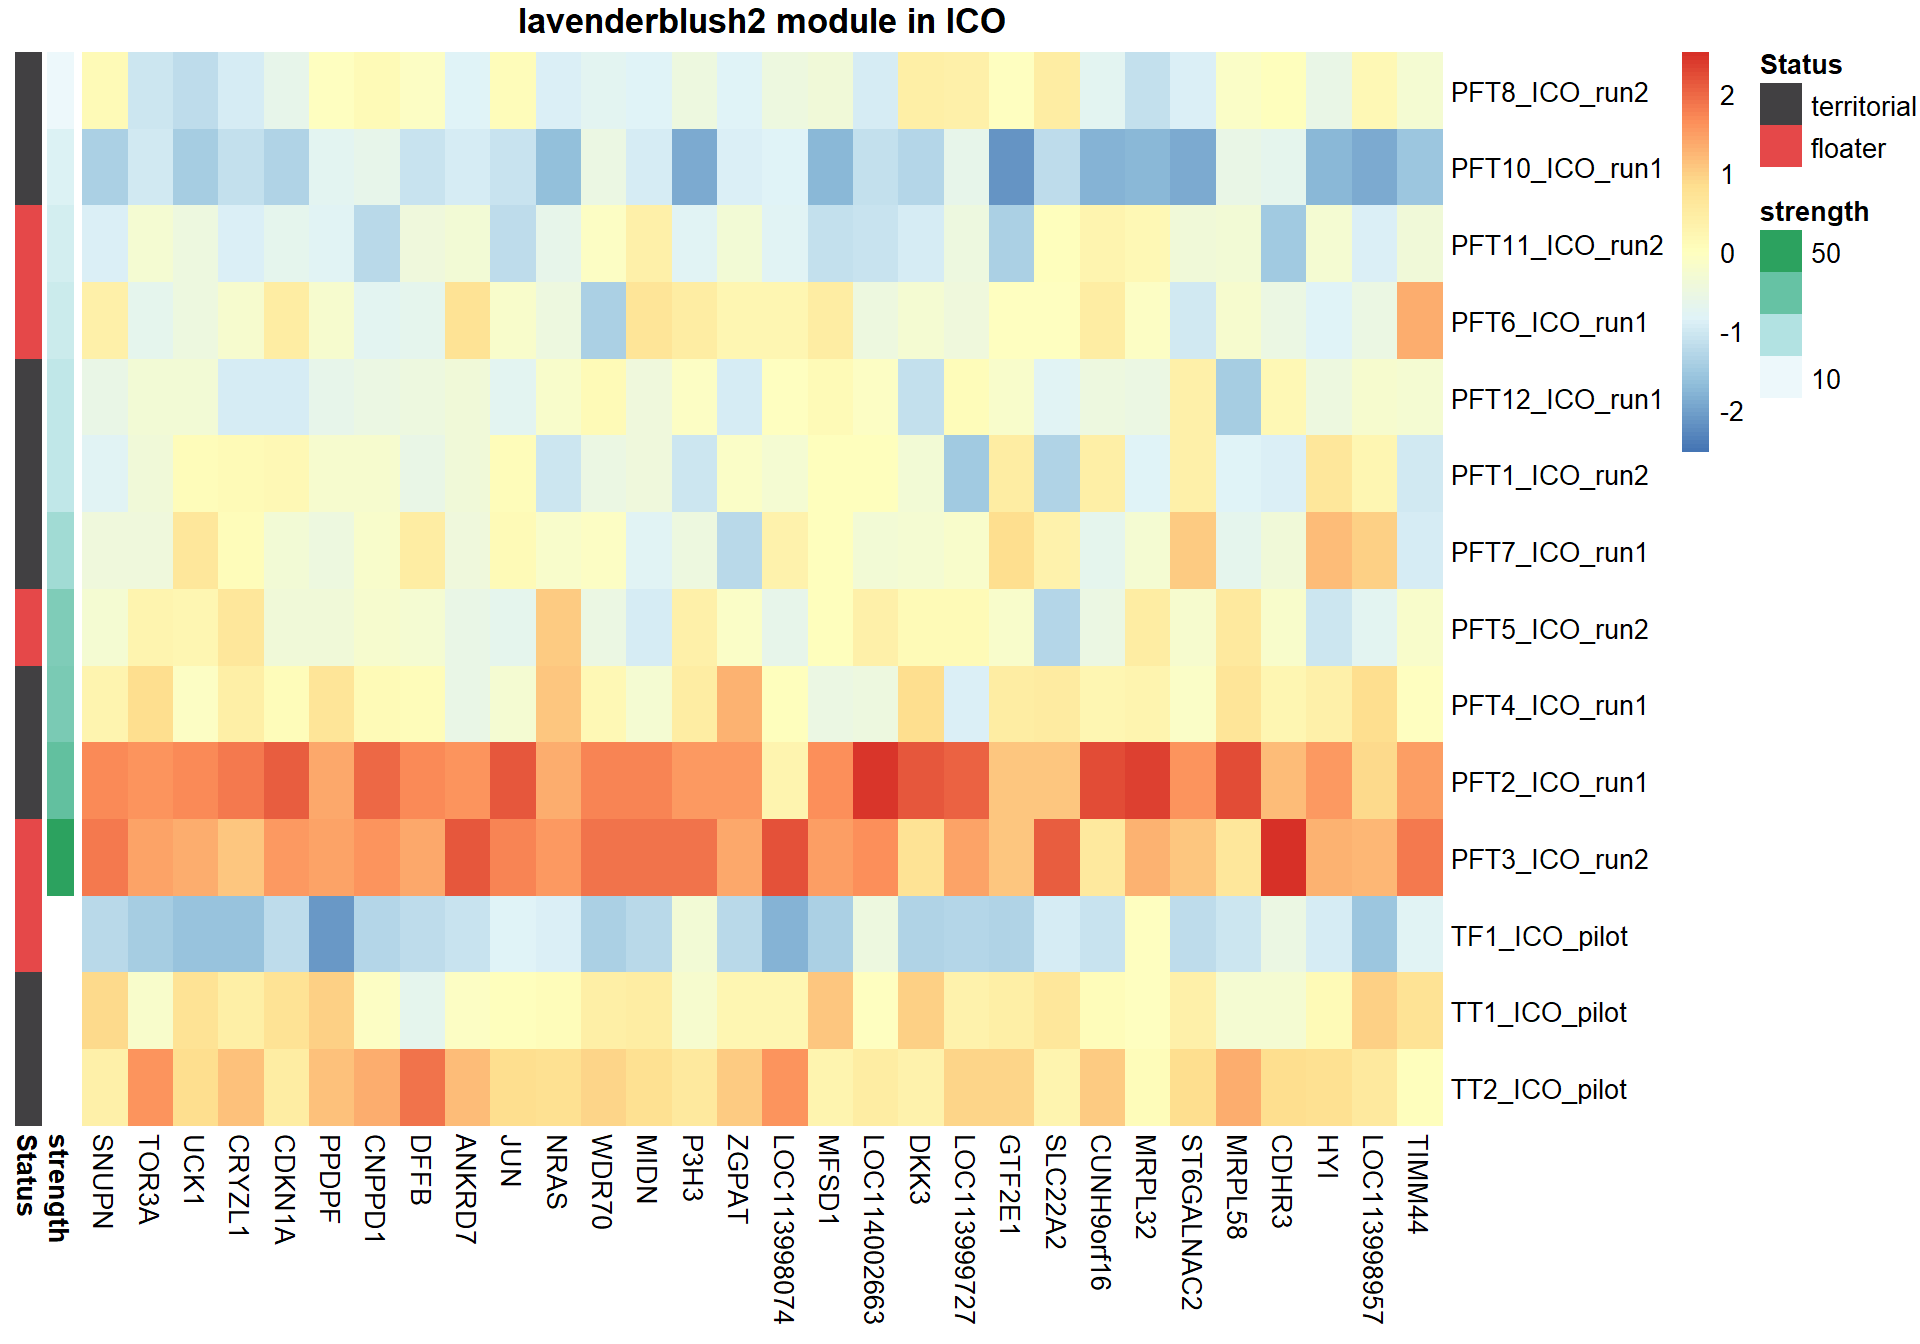
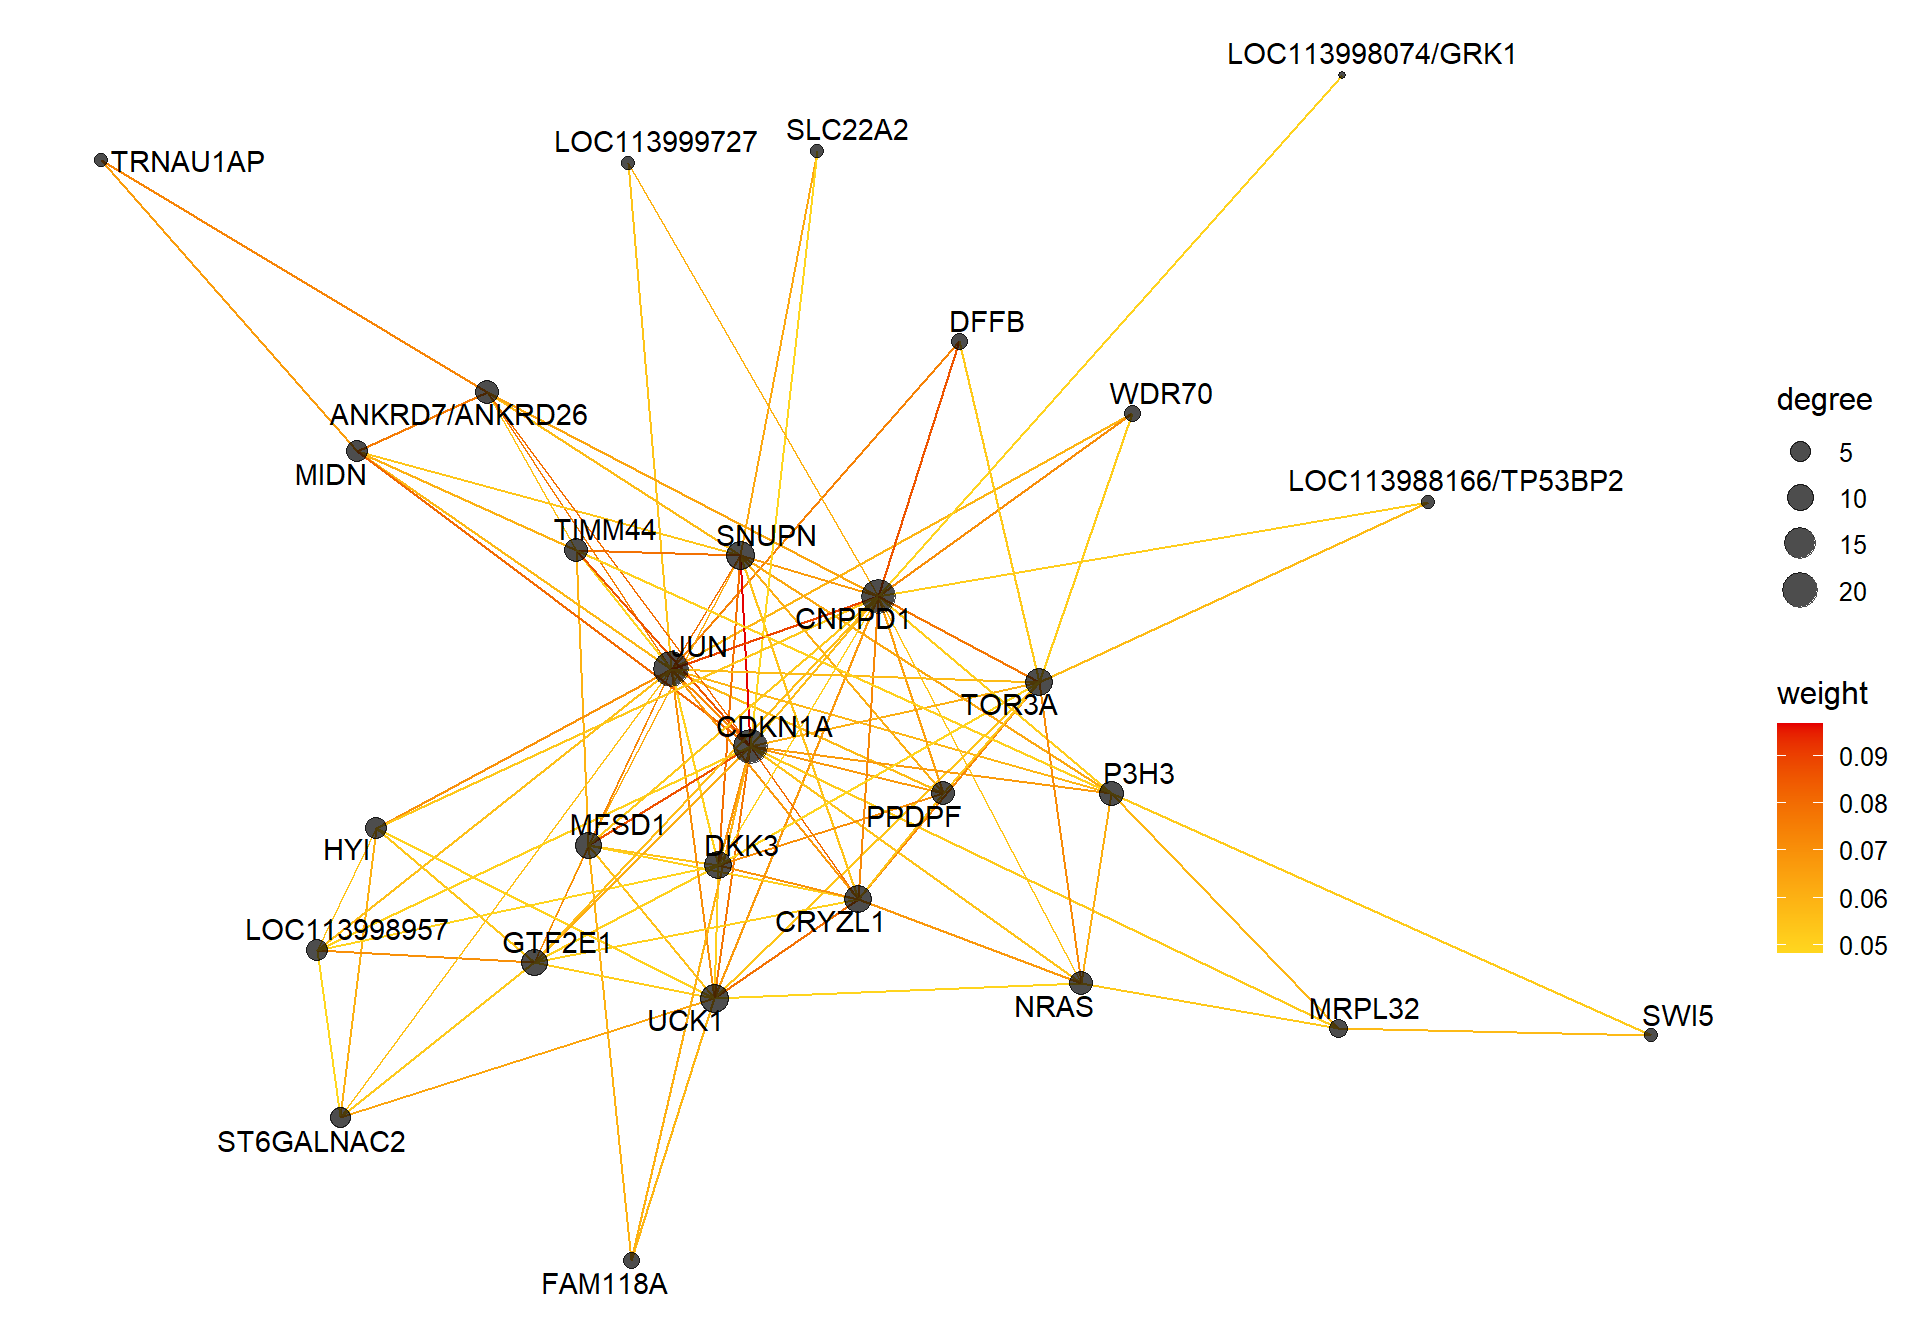
7.1.1 lavenderblush2 - strength
7.1.1.1 Gene Ontology
| ID | Description | GeneRatio | BgRatio | pvalue | p.adjust | qvalue | geneID | Count |
|---|---|---|---|---|---|---|---|---|
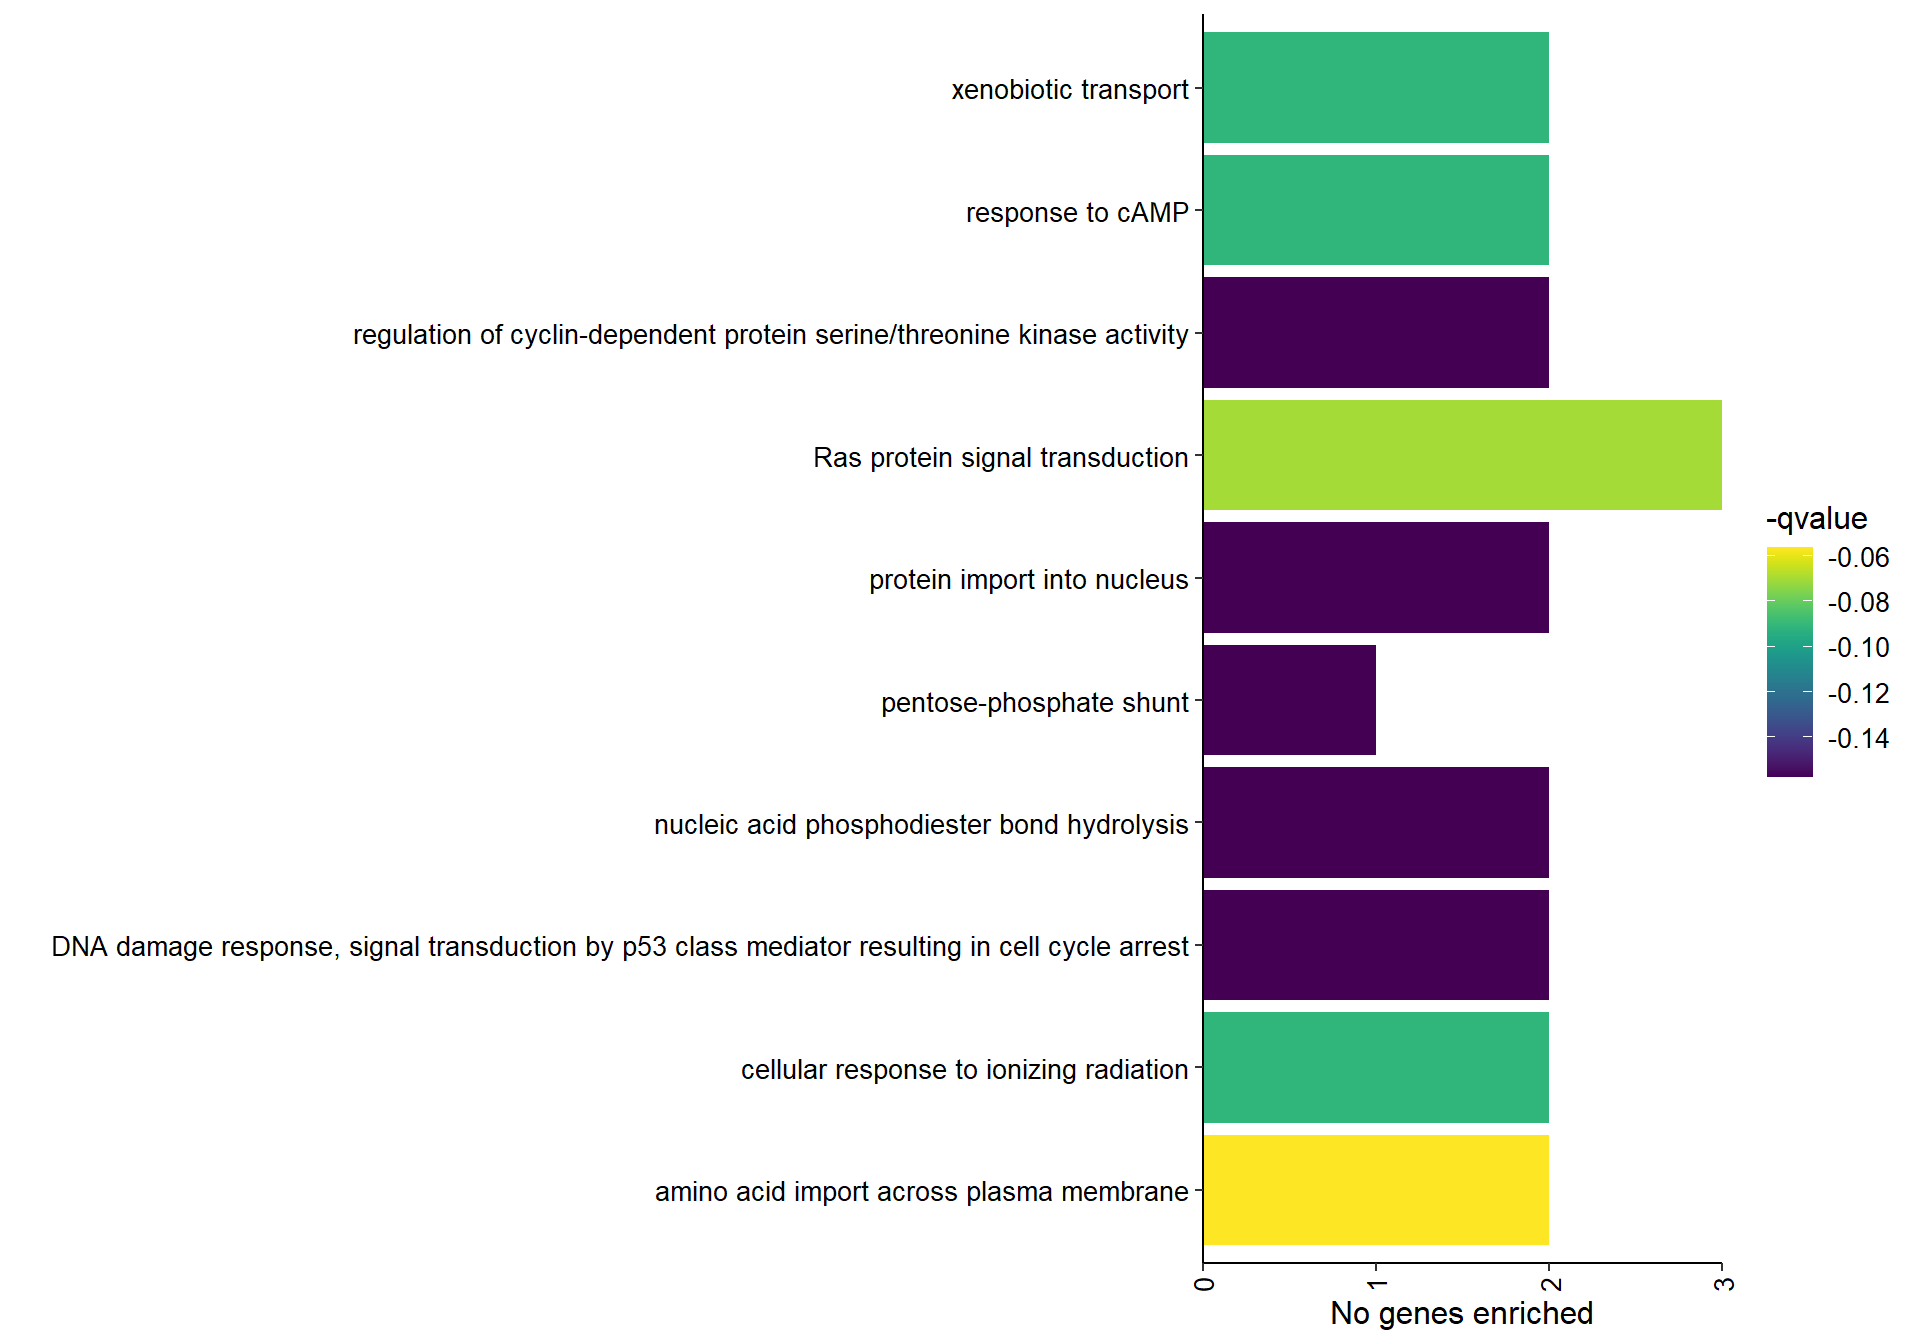
| GO:0089718 | amino acid import across plasma membrane | 2/37 | 10/12201 | 0.0003966 | 0.0662263 | 0.0563539 | LOC114001992/SLC22A2 | 2 |
| GO:0007265 | Ras protein signal transduction | 3/37 | 65/12201 | 0.0009853 | 0.0822706 | 0.0700065 | CDKN1A/JUN/NRAS | 3 |
| GO:0042908 | xenobiotic transport | 2/37 | 22/12201 | 0.0019896 | 0.1075022 | 0.0914768 | LOC114001992/SLC22A2 | 2 |
| GO:0051591 | response to cAMP | 2/37 | 28/12201 | 0.0032186 | 0.1075022 | 0.0914768 | JUN/LOC113993849 | 2 |
| GO:0071479 | cellular response to ionizing radiation | 2/37 | 28/12201 | 0.0032186 | 0.1075022 | 0.0914768 | CDKN1A/SWI5 | 2 |
| GO:0000079 | regulation of cyclin-dependent protein serine/threonine kinase activity | 2/37 | 43/12201 | 0.0074726 | 0.1853735 | 0.1577398 | CDKN1A/CNPPD1 | 2 |
| GO:0006977 | DNA damage response, signal transduction by p53 class mediator resulting in cell cycle arrest | 2/37 | 47/12201 | 0.0088778 | 0.1853735 | 0.1577398 | CDKN1A/LOC113993849 | 2 |
| GO:0090305 | nucleic acid phosphodiester bond hydrolysis | 2/37 | 52/12201 | 0.0107870 | 0.1853735 | 0.1577398 | LOC113989190/ZRANB3 | 2 |
| GO:0006606 | protein import into nucleus | 2/37 | 65/12201 | 0.0165091 | 0.1853735 | 0.1577398 | CDKN1A/SNUPN | 2 |
| GO:0006098 | pentose-phosphate shunt | 1/37 | 10/12201 | 0.0299258 | 0.1853735 | 0.1577398 | RPIA | 1 |
## preparing gene to GO mapping data...## preparing IC data...## Warning in if (class(try(col2rgb(palette), silent = TRUE)) == "try-error")
## stop("color palette is not correct"): the condition has length > 1 and only the
## first element will be used
7.1.2 darkturquoise - mean testosterone
7.1.2.1 Gene Ontology
| ID | Description | GeneRatio | BgRatio | pvalue | p.adjust | qvalue | geneID | Count |
|---|---|---|---|---|---|---|---|---|
| GO:0043392 | negative regulation of DNA binding | 4/289 | 21/12201 | 0.0013420 | 0.6394570 | 0.6393909 | CTNNBIP1/HDAC2/LOC113990539/NFKBIA | 4 |
| GO:0034765 | regulation of ion transmembrane transport | 8/289 | 93/12201 | 0.0016049 | 0.6394570 | 0.6393909 | GPR89B/KCNA6/KCNG3/KCNH8/KCNJ6/KCNJ8/LOC113993165/TMEM37 | 8 |
| GO:0036499 | PERK-mediated unfolded protein response | 3/289 | 11/12201 | 0.0018845 | 0.6394570 | 0.6393909 | ATF3/LOC113998959/LOC114003207 | 3 |
| GO:0007263 | nitric oxide mediated signal transduction | 3/289 | 14/12201 | 0.0039439 | 0.7171947 | 0.7171206 | CD36/NPY2R/RASD1 | 3 |
| GO:0030517 | negative regulation of axon extension | 3/289 | 14/12201 | 0.0039439 | 0.7171947 | 0.7171206 | KIAA0319/RNF6/RTN4R | 3 |
| GO:0006370 | 7-methylguanosine mRNA capping | 4/289 | 31/12201 | 0.0058603 | 0.7171947 | 0.7171206 | GTF2F2/LOC113983394/POLR2J/RNGTT | 4 |
| GO:0042246 | tissue regeneration | 3/289 | 17/12201 | 0.0069911 | 0.7171947 | 0.7171206 | GAP43/LOC113998959/LOC114003207 | 3 |
| GO:0043254 | regulation of protein-containing complex assembly | 3/289 | 17/12201 | 0.0069911 | 0.7171947 | 0.7171206 | CD36/HJURP/INSM1 | 3 |
| GO:0032355 | response to estradiol | 6/289 | 75/12201 | 0.0086076 | 0.7171947 | 0.7171206 | CASP8/DHH/EZH2/HPGD/MBD3/TXNIP | 6 |
| GO:0032496 | response to lipopolysaccharide | 7/289 | 100/12201 | 0.0095616 | 0.7171947 | 0.7171206 | CASP8/CSF2RB/DUSP10/HDAC2/HPGD/KCNJ8/LOC113998857 | 7 |
## preparing gene to GO mapping data...## preparing IC data...## Warning in if (class(try(col2rgb(palette), silent = TRUE)) == "try-error")
## stop("color palette is not correct"): the condition has length > 1 and only the
## first element will be used
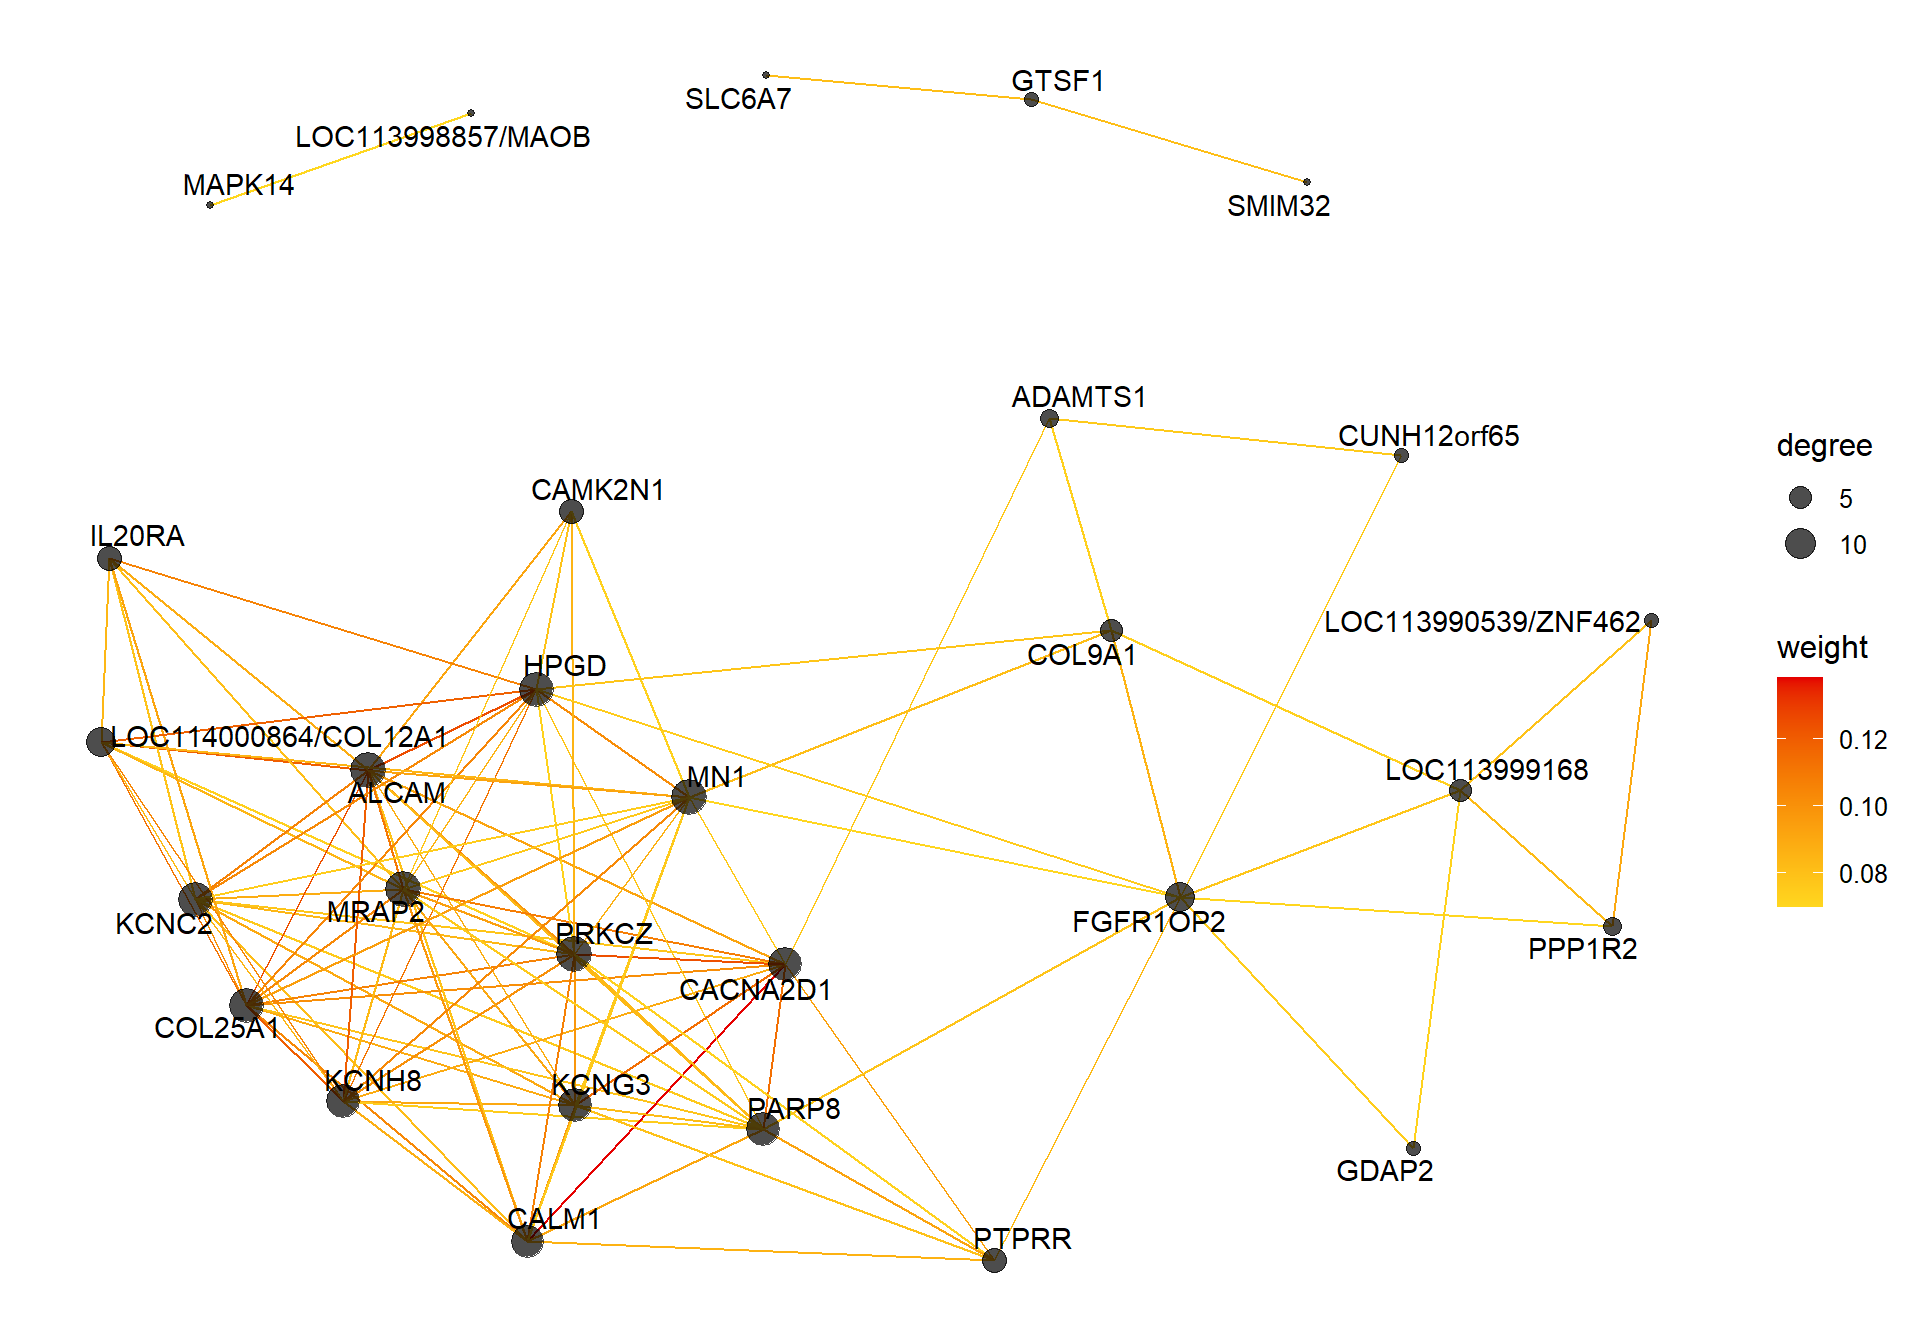
7.1.3 maroon - mean testosterone
7.1.3.1 Gene Ontology
| ID | Description | GeneRatio | BgRatio | pvalue | p.adjust | qvalue | geneID | Count |
|---|---|---|---|---|---|---|---|---|
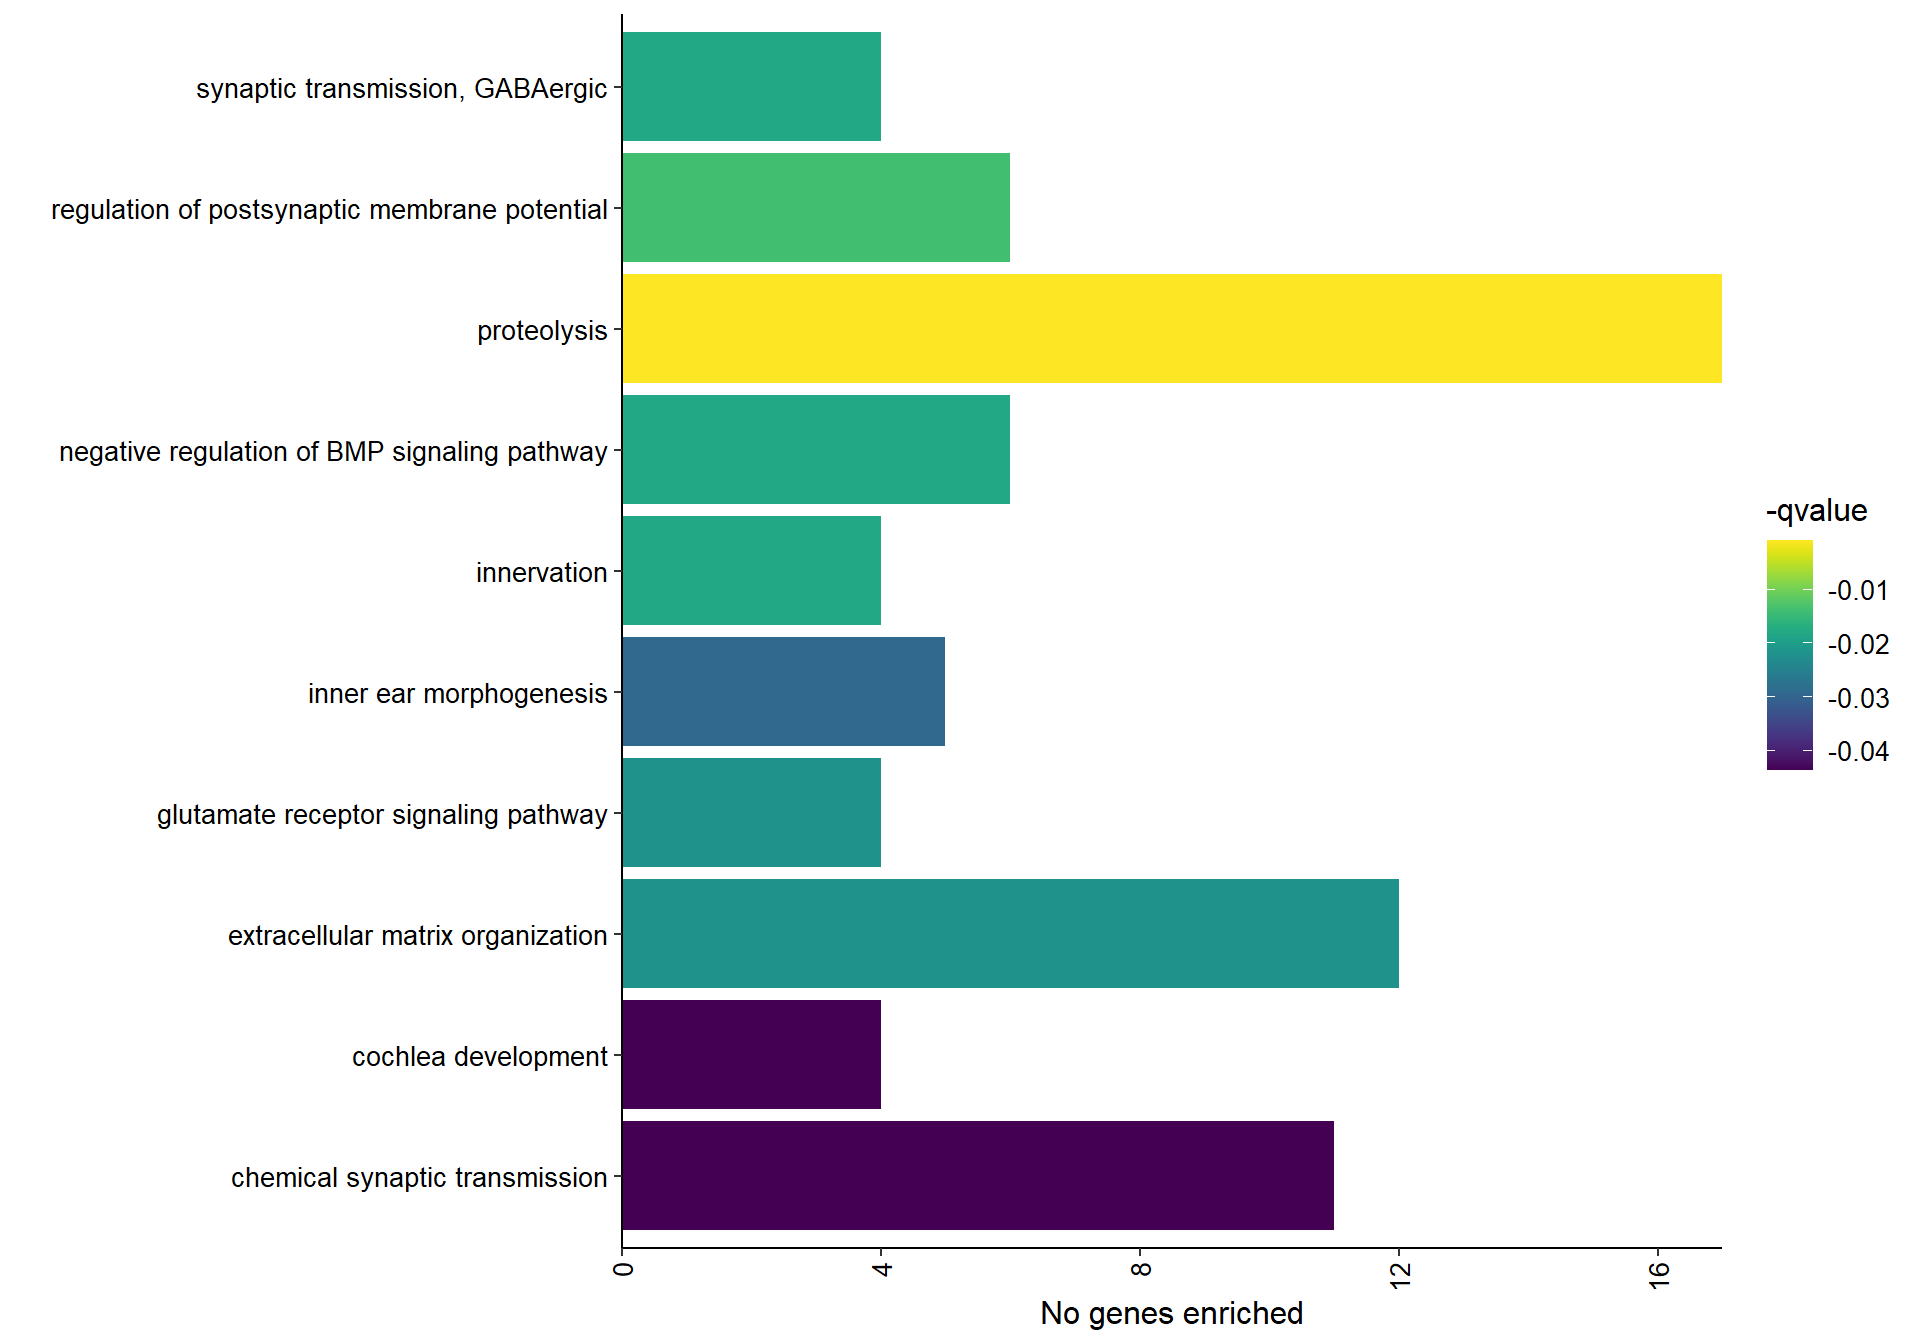
| GO:0006508 | proteolysis | 17/205 | 250/12201 | 0.0000011 | 0.0008534 | 0.0007831 | ACE/ADAM8/CAPN3/CAPN5/LGMN/LOC113983631/LOC114004136/MASP1/METAP1D/MMP2/MMP28/PAPLN/PM20D1/PRSS23/RHBDF1/TINAG/USP25 | 17 |
| GO:0060078 | regulation of postsynaptic membrane potential | 6/205 | 38/12201 | 0.0000369 | 0.0149480 | 0.0137169 | GABRA5/GABRA6/GABRB2/GRIK1/GRIN3A/LOC113990089 | 6 |
| GO:0060384 | innervation | 4/205 | 15/12201 | 0.0000914 | 0.0194990 | 0.0178931 | GABRA5/GABRB2/LRIG1/SULF2 | 4 |
| GO:0030514 | negative regulation of BMP signaling pathway | 6/205 | 45/12201 | 0.0000986 | 0.0194990 | 0.0178931 | BMPER/CTDSPL2/SFRP2/SKOR2/SOSTDC1/VWC2L | 6 |
| GO:0051932 | synaptic transmission, GABAergic | 4/205 | 16/12201 | 0.0001202 | 0.0194990 | 0.0178931 | GABRA5/GABRA6/GABRB2/LOC113990089 | 4 |
| GO:0007215 | glutamate receptor signaling pathway | 4/205 | 18/12201 | 0.0001969 | 0.0236565 | 0.0217083 | GRID2/GRIK1/GRIN2A/PLCB1 | 4 |
| GO:0030198 | extracellular matrix organization | 12/205 | 208/12201 | 0.0002042 | 0.0236565 | 0.0217083 | ADAMTS12/BCAN/COL6A1/EGFLAM/LAMA3/LOC113998335/MMP2/MMP28/NDNF/PAPLN/PTX3/VWA1 | 12 |
| GO:0042472 | inner ear morphogenesis | 5/205 | 36/12201 | 0.0003147 | 0.0318980 | 0.0292710 | GATA2/NTN1/OTX1/PAX2/SPRY2 | 5 |
| GO:0090102 | cochlea development | 4/205 | 23/12201 | 0.0005334 | 0.0475213 | 0.0436078 | GABRA5/GABRB2/GATA2/PAX2 | 4 |
| GO:0007268 | chemical synaptic transmission | 11/205 | 201/12201 | 0.0005860 | 0.0475213 | 0.0436078 | CACNB4/DTNA/GABRA5/GABRA6/GABRB2/GRIK1/GRIN2A/GRM4/LOC113990089/NPTX1/NTSR1 | 11 |
## preparing gene to GO mapping data...## preparing IC data...## Warning in if (class(try(col2rgb(palette), silent = TRUE)) == "try-error")
## stop("color palette is not correct"): the condition has length > 1 and only the
## first element will be used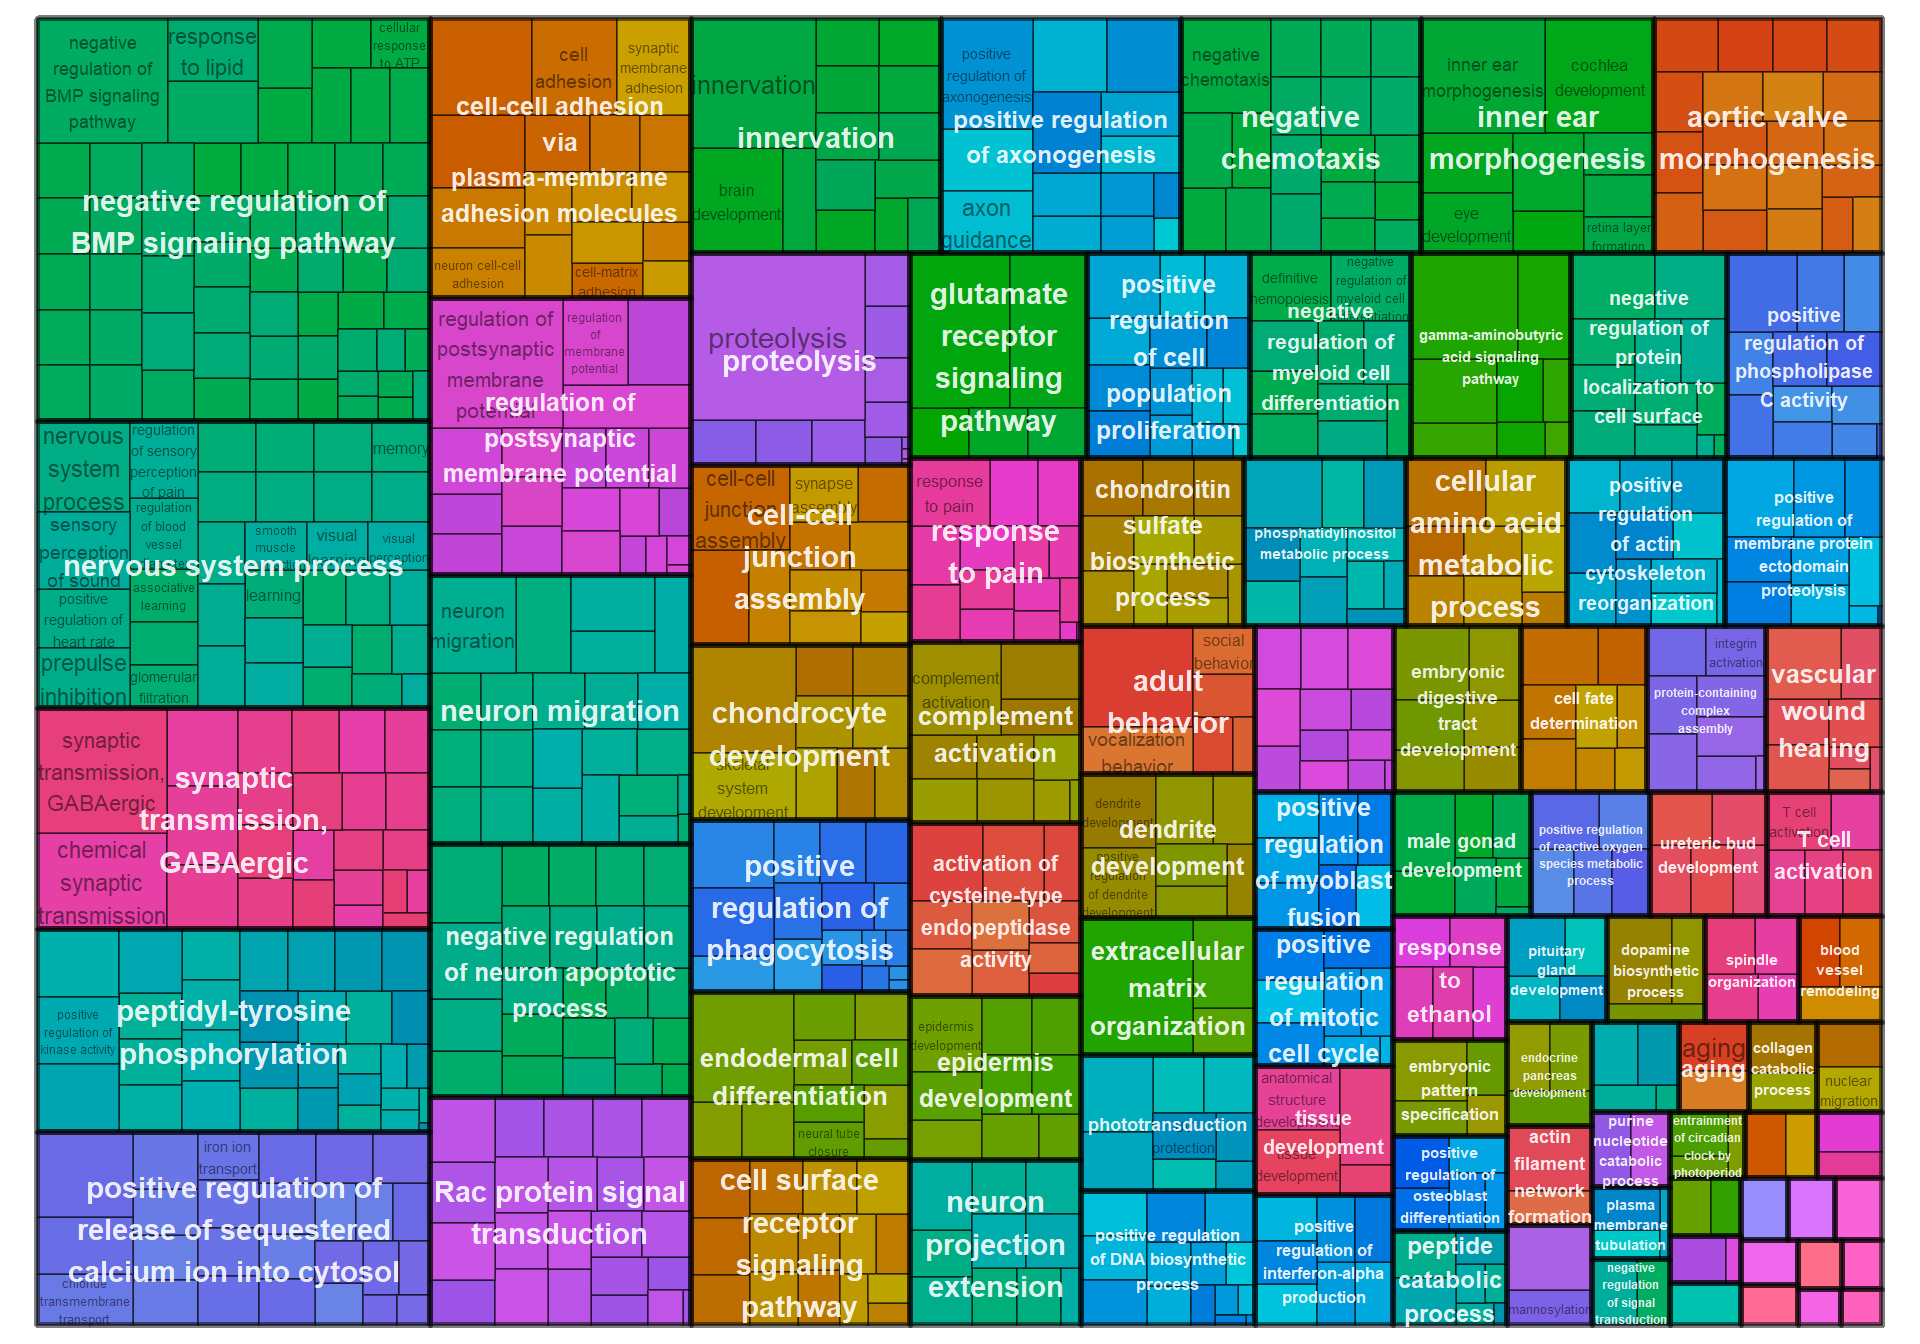
8 Midbrain Central Grey (GCt)
## [1] 15099## Warning in DESeqDataSet(se, design = design, ignoreRank): some variables in
## design formula are characters, converting to factors## estimating size factors## estimating dispersions## gene-wise dispersion estimates## mean-dispersion relationship## final dispersion estimates## fitting model and testing## -- replacing outliers and refitting for 11717 genes
## -- DESeq argument 'minReplicatesForReplace' = 7
## -- original counts are preserved in counts(dds)## estimating dispersions## fitting model and testing## Power SFT.R.sq slope truncated.R.sq mean.k. median.k. max.k.
## 1 1 0.00530 -12.10 0.974 7550.0 7550.0 7660
## 2 2 0.00467 -1.64 0.886 4270.0 4270.0 4610
## 3 3 0.11400 -3.30 0.881 2630.0 2630.0 3140
## 4 4 0.15500 -2.43 0.877 1730.0 1720.0 2300
## 5 5 0.21600 -2.10 0.884 1190.0 1180.0 1760
## 6 6 0.29000 -1.97 0.894 852.0 837.0 1400
## 7 7 0.36600 -1.90 0.905 630.0 612.0 1140
## 8 8 0.43600 -1.87 0.916 478.0 458.0 947
## 9 9 0.50200 -1.89 0.922 371.0 350.0 802
## 10 10 0.55800 -1.91 0.929 293.0 272.0 688
## 11 11 0.60100 -1.92 0.934 235.0 214.0 597
## 12 12 0.63700 -1.95 0.938 191.0 171.0 524
## 13 14 0.69900 -1.97 0.951 131.0 112.0 412
## 14 16 0.72900 -2.03 0.954 93.7 76.7 336
## 15 18 0.74400 -2.10 0.952 69.0 54.0 281
## 16 20 0.76500 -2.14 0.960 52.1 39.0 238
## 17 22 0.77000 -2.18 0.960 40.3 28.6 204
## 18 24 0.78400 -2.20 0.966 31.7 21.5 177
## 19 26 0.79200 -2.21 0.970 25.3 16.4 154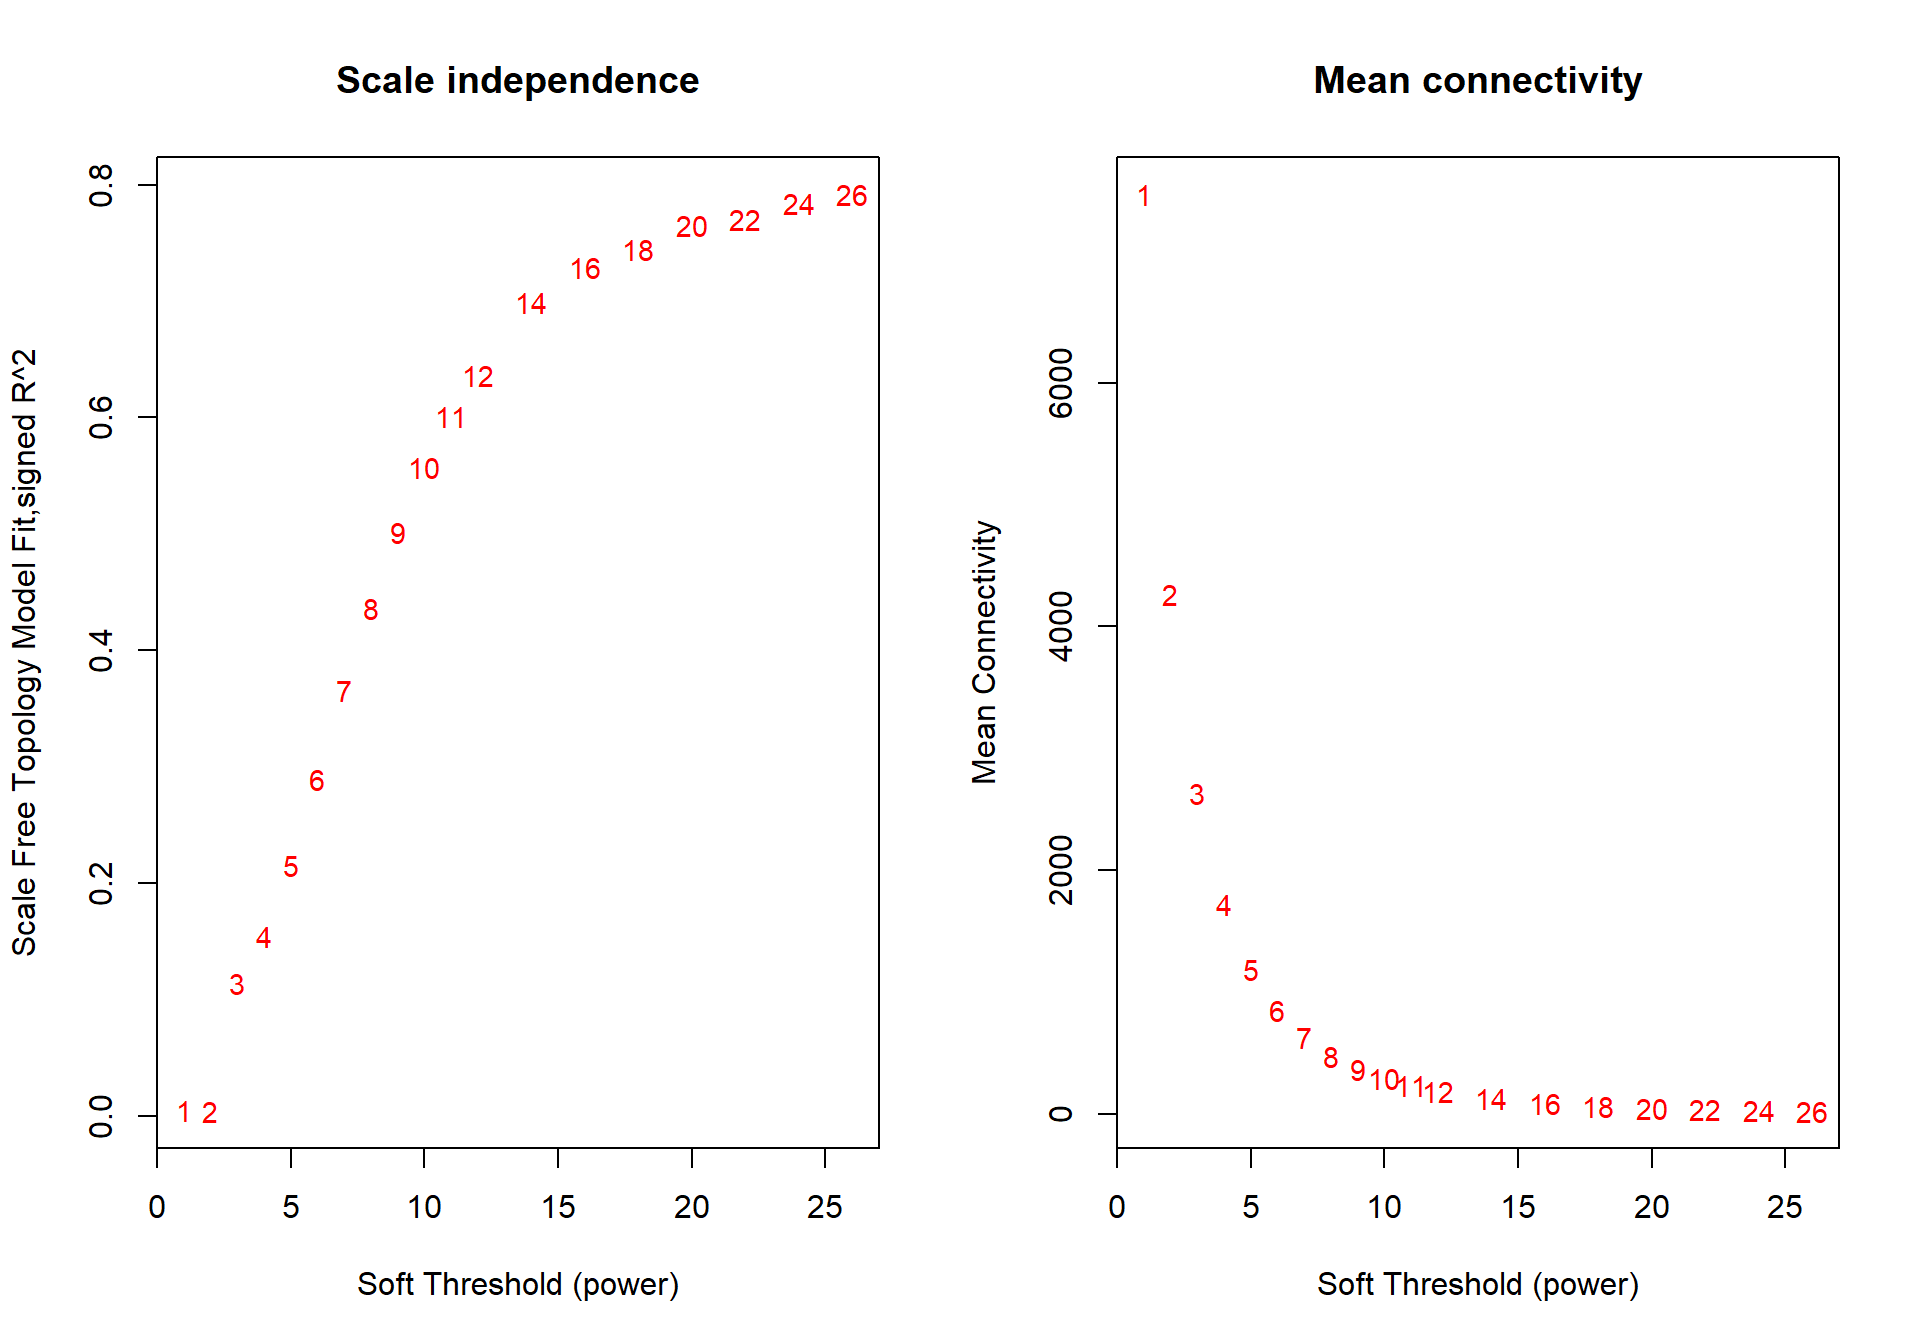
The soft-power selected for GCT is 18.
| moduleColors | Freq |
|---|---|
| antiquewhite1 | 34 |
| antiquewhite2 | 132 |
| antiquewhite4 | 95 |
| bisque4 | 2333 |
| black | 914 |
| brown2 | 156 |
| chocolate4 | 79 |
| coral | 113 |
| coral1 | 179 |
| coral3 | 360 |
| cyan | 1252 |
| darkgreen | 194 |
| darkgrey | 408 |
| darkolivegreen2 | 1719 |
| darkolivegreen4 | 1267 |
| darkseagreen2 | 40 |
| darkseagreen3 | 174 |
| deeppink | 1490 |
| firebrick3 | 53 |
| floralwhite | 582 |
| green4 | 40 |
| indianred3 | 53 |
| lightcoral | 83 |
| lightpink2 | 47 |
| lightpink3 | 70 |
| mediumpurple1 | 134 |
| mediumpurple2 | 155 |
| mediumpurple4 | 63 |
| navajowhite | 1335 |
| orangered3 | 274 |
| pink4 | 302 |
| plum | 89 |
| plum4 | 51 |
| saddlebrown | 161 |
| salmon2 | 72 |
| sienna4 | 60 |
| skyblue2 | 152 |
| skyblue4 | 62 |
| tan | 230 |
| yellow4 | 92 |
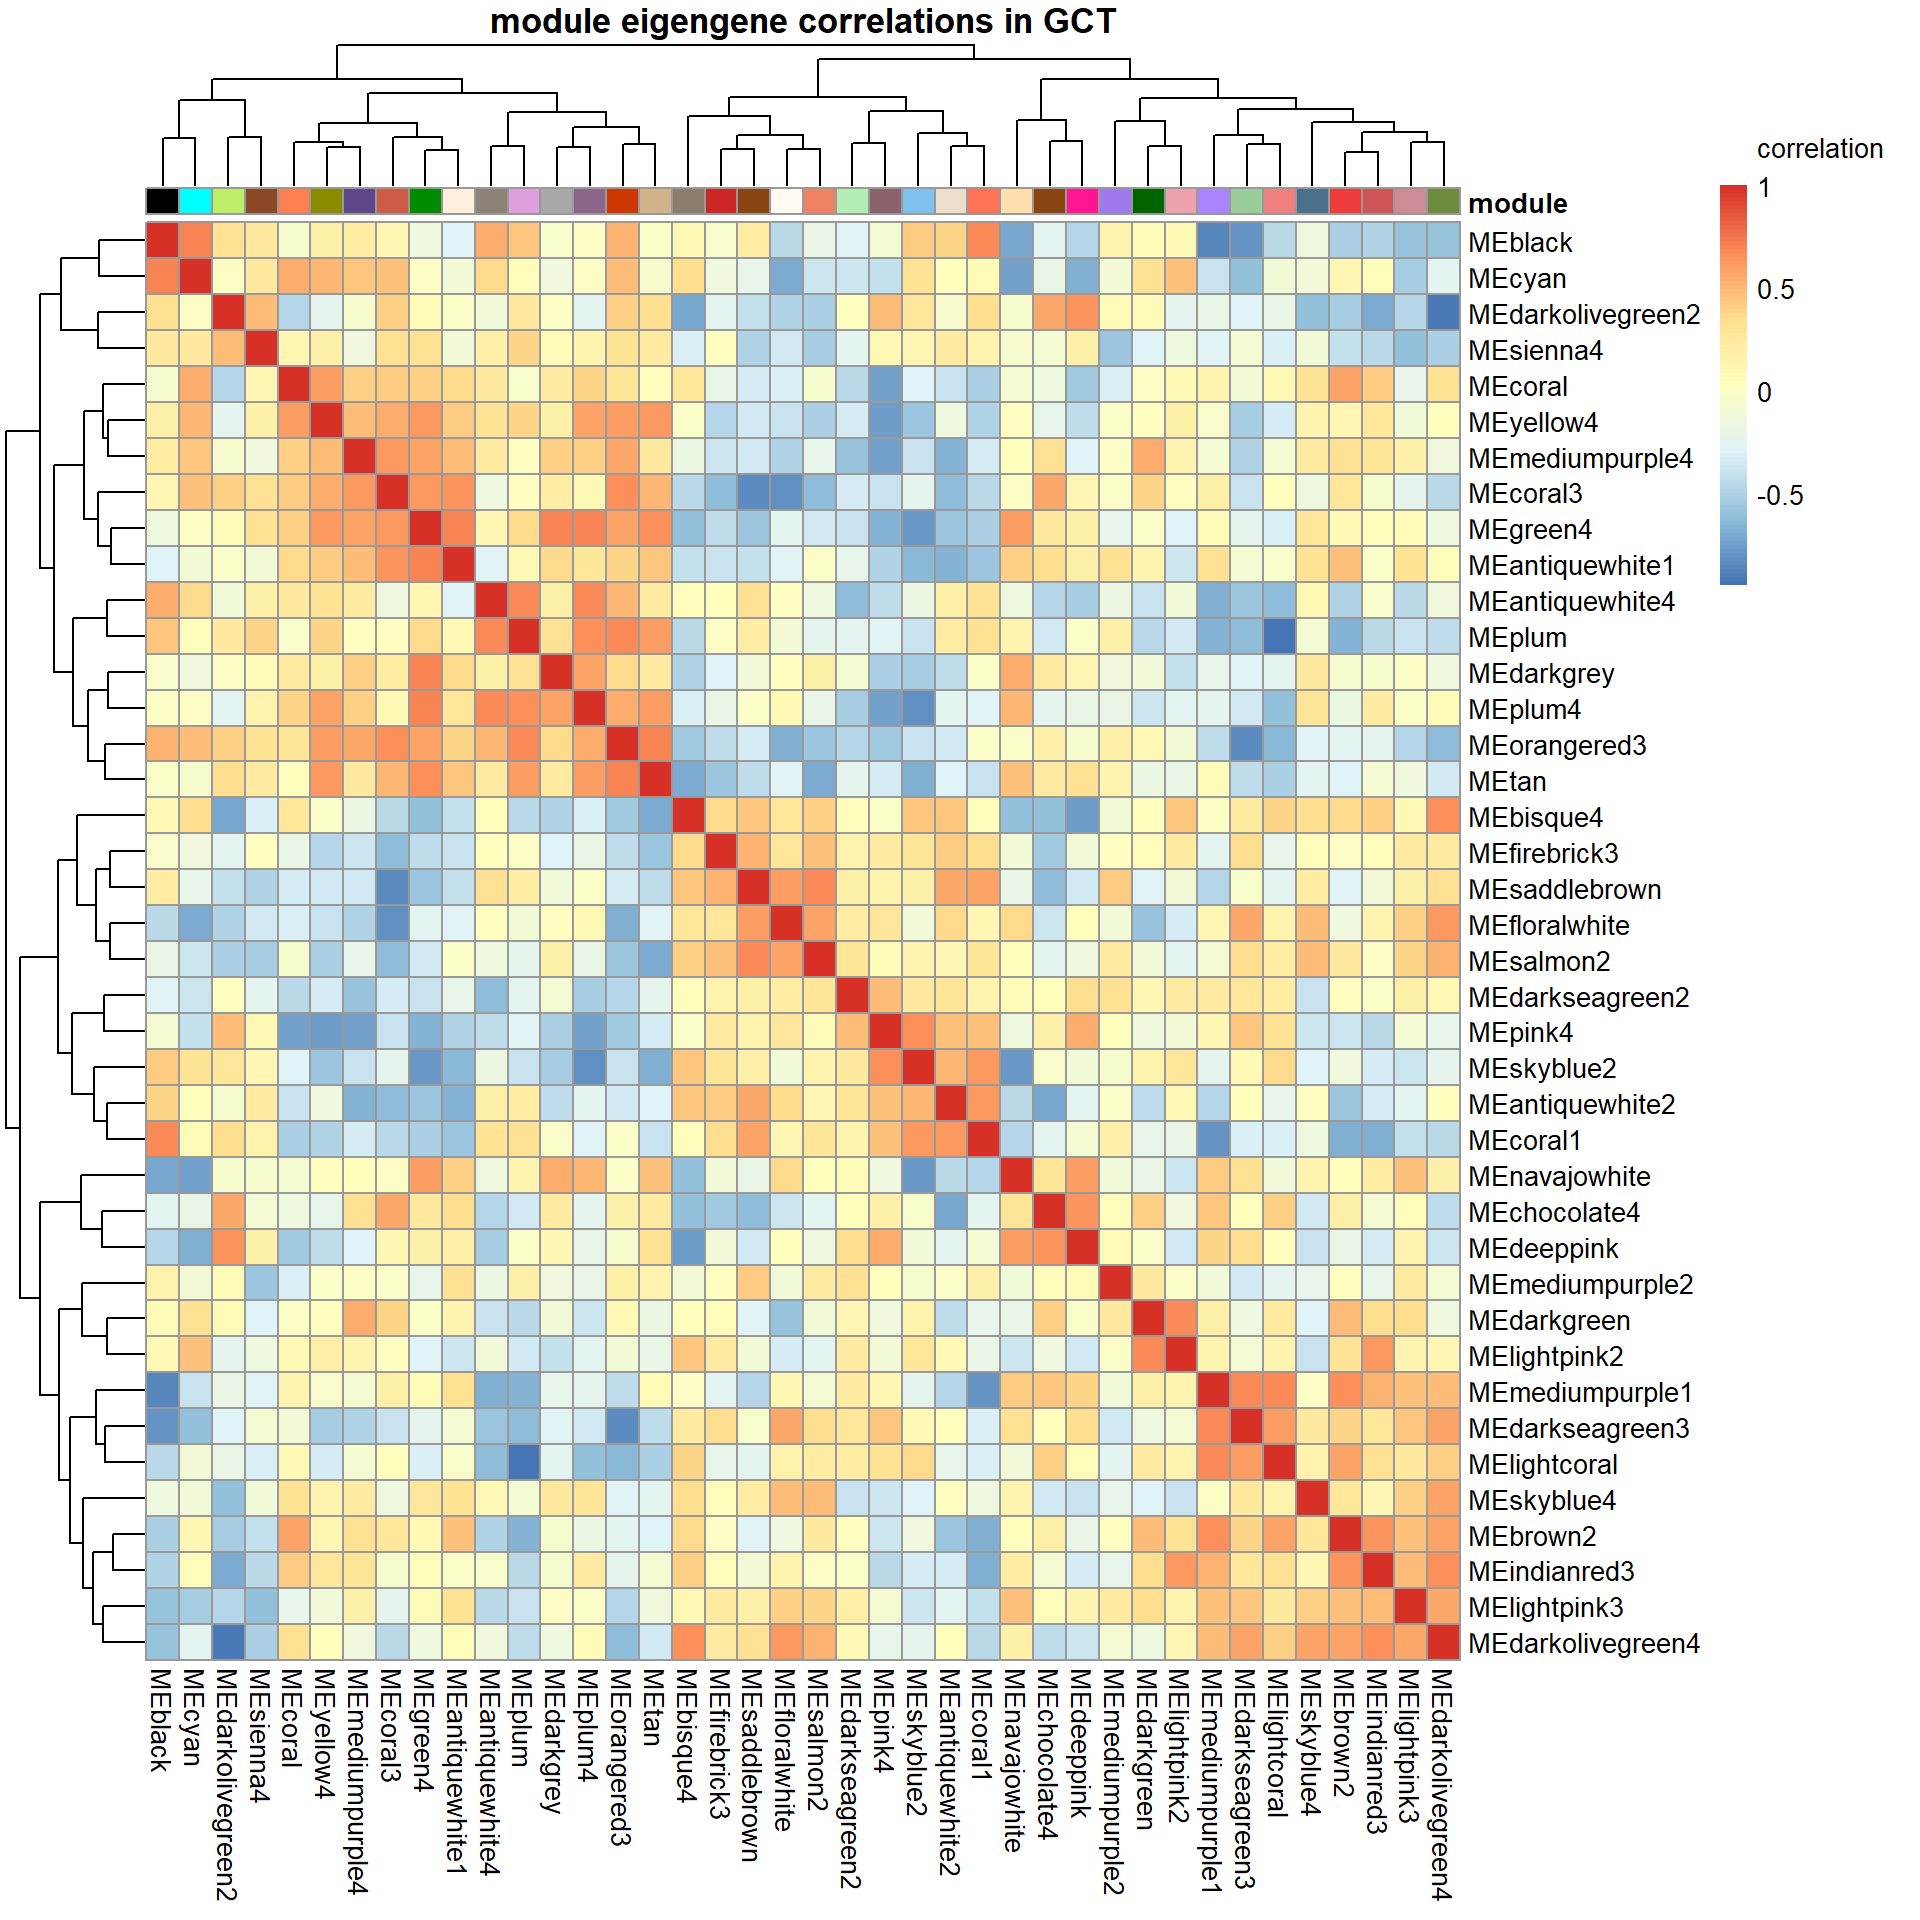
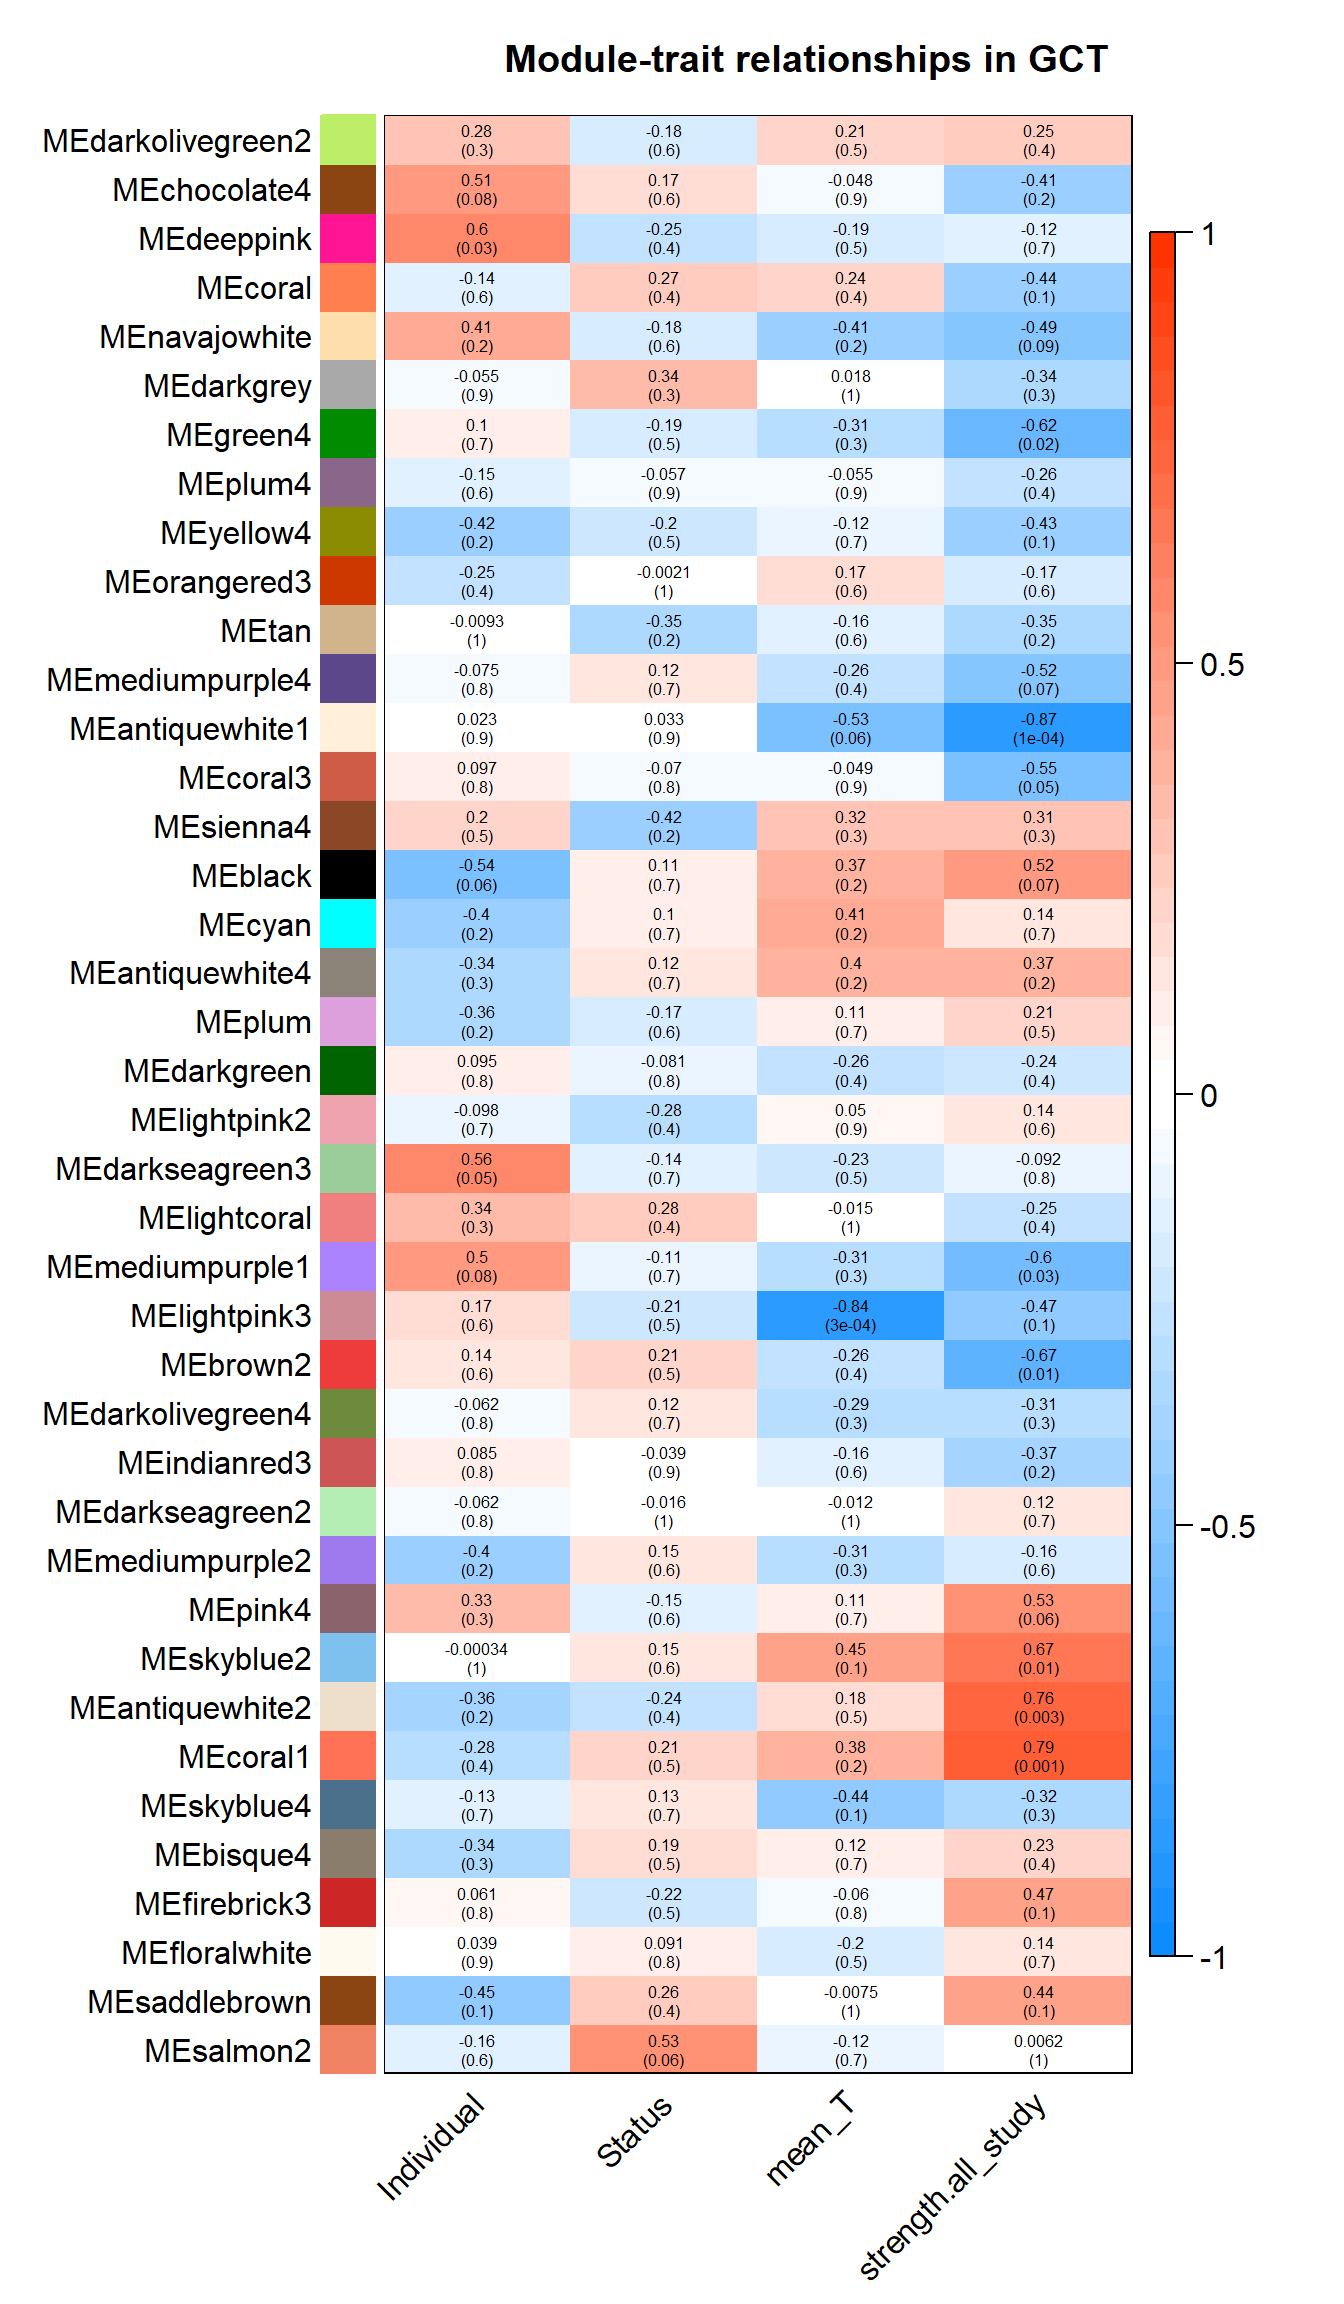
There appears to be a strong correlation between skyblue2 and green4, which are associated with strength.
8.1 Interesting Modules
8.1.1 skyblue2 - strength
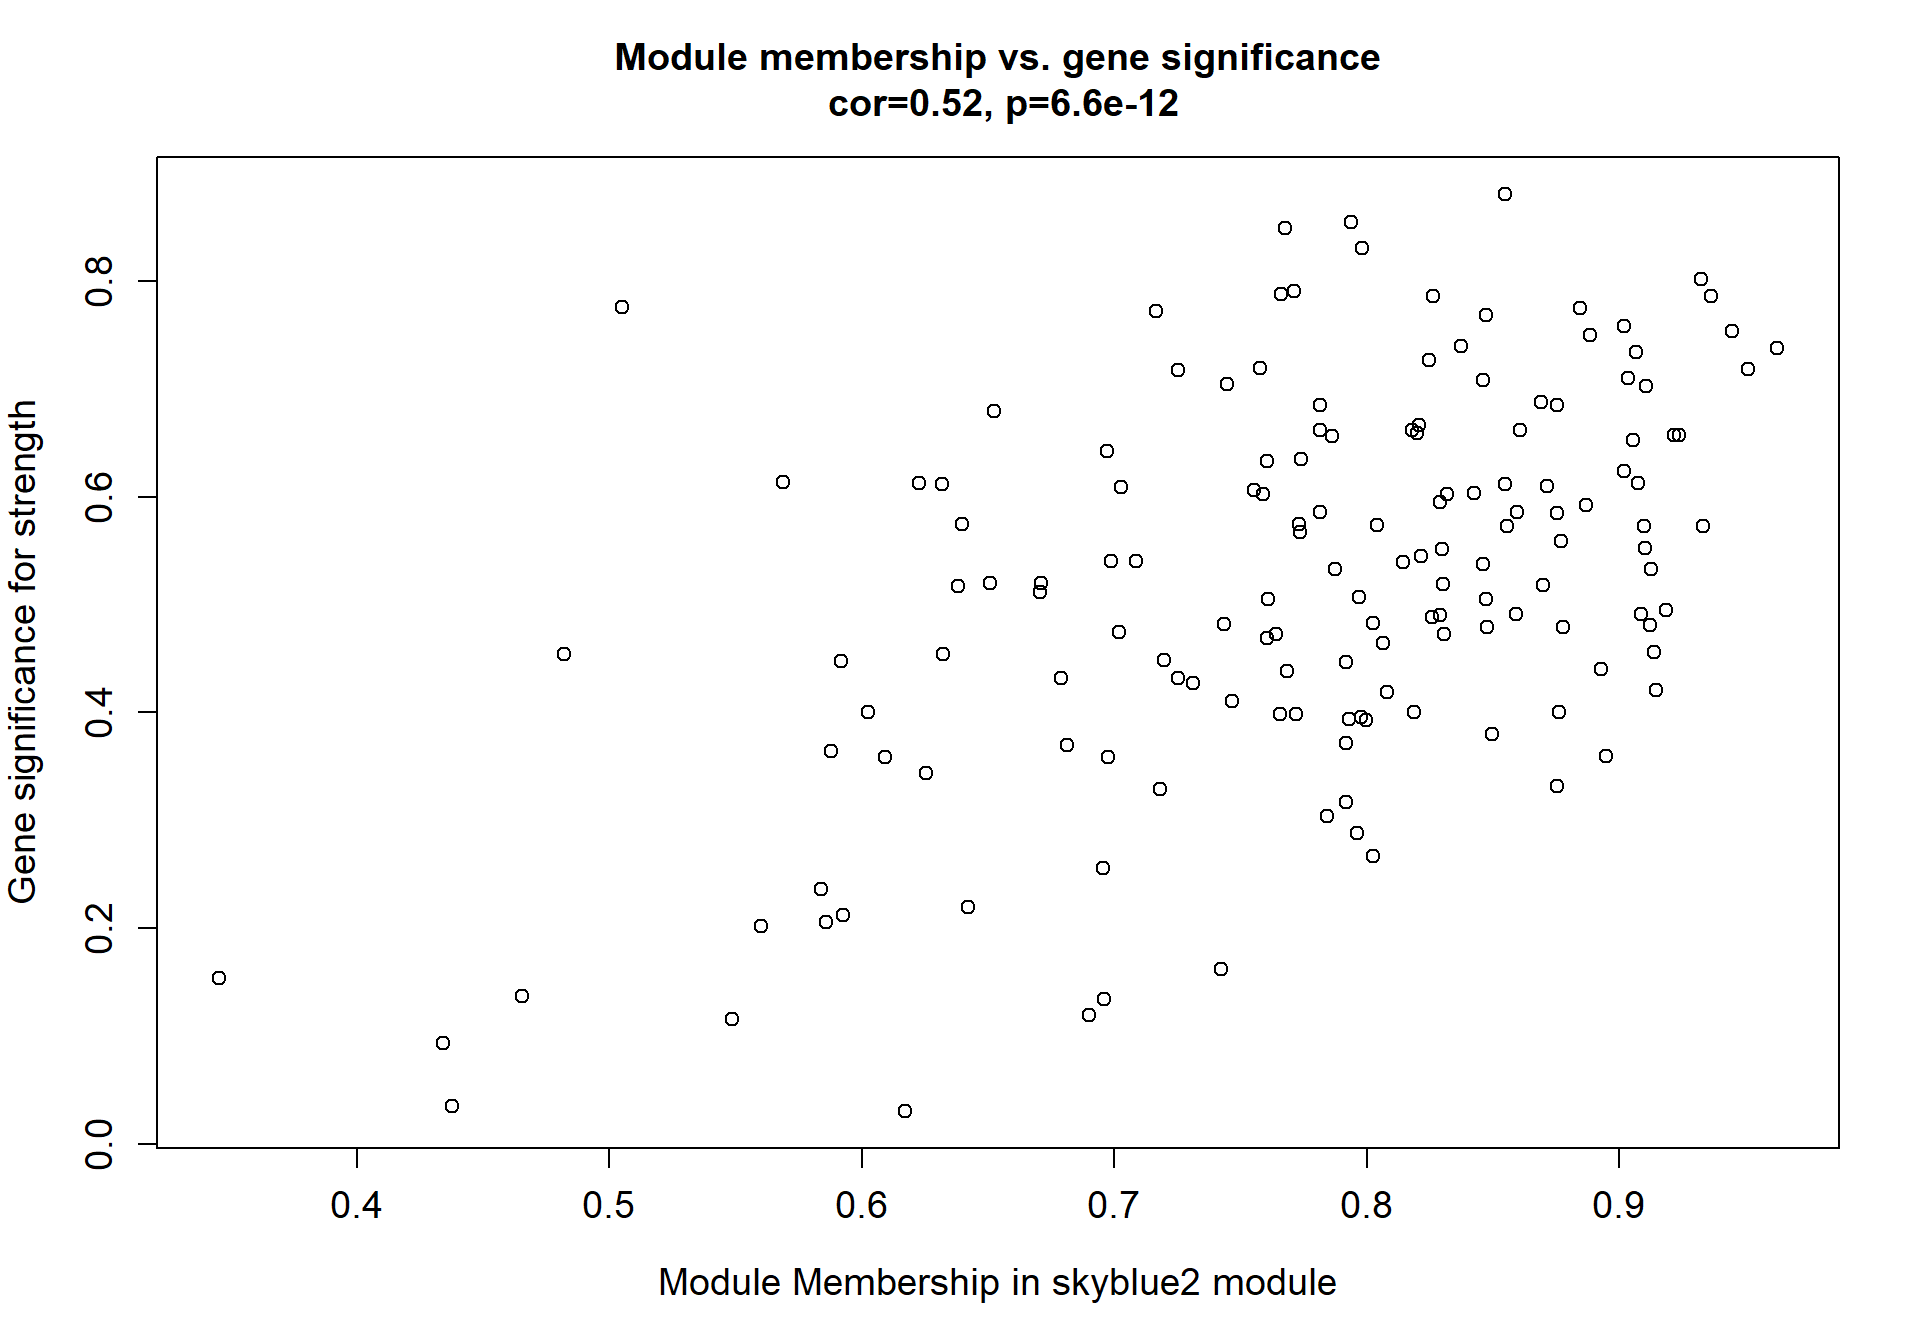
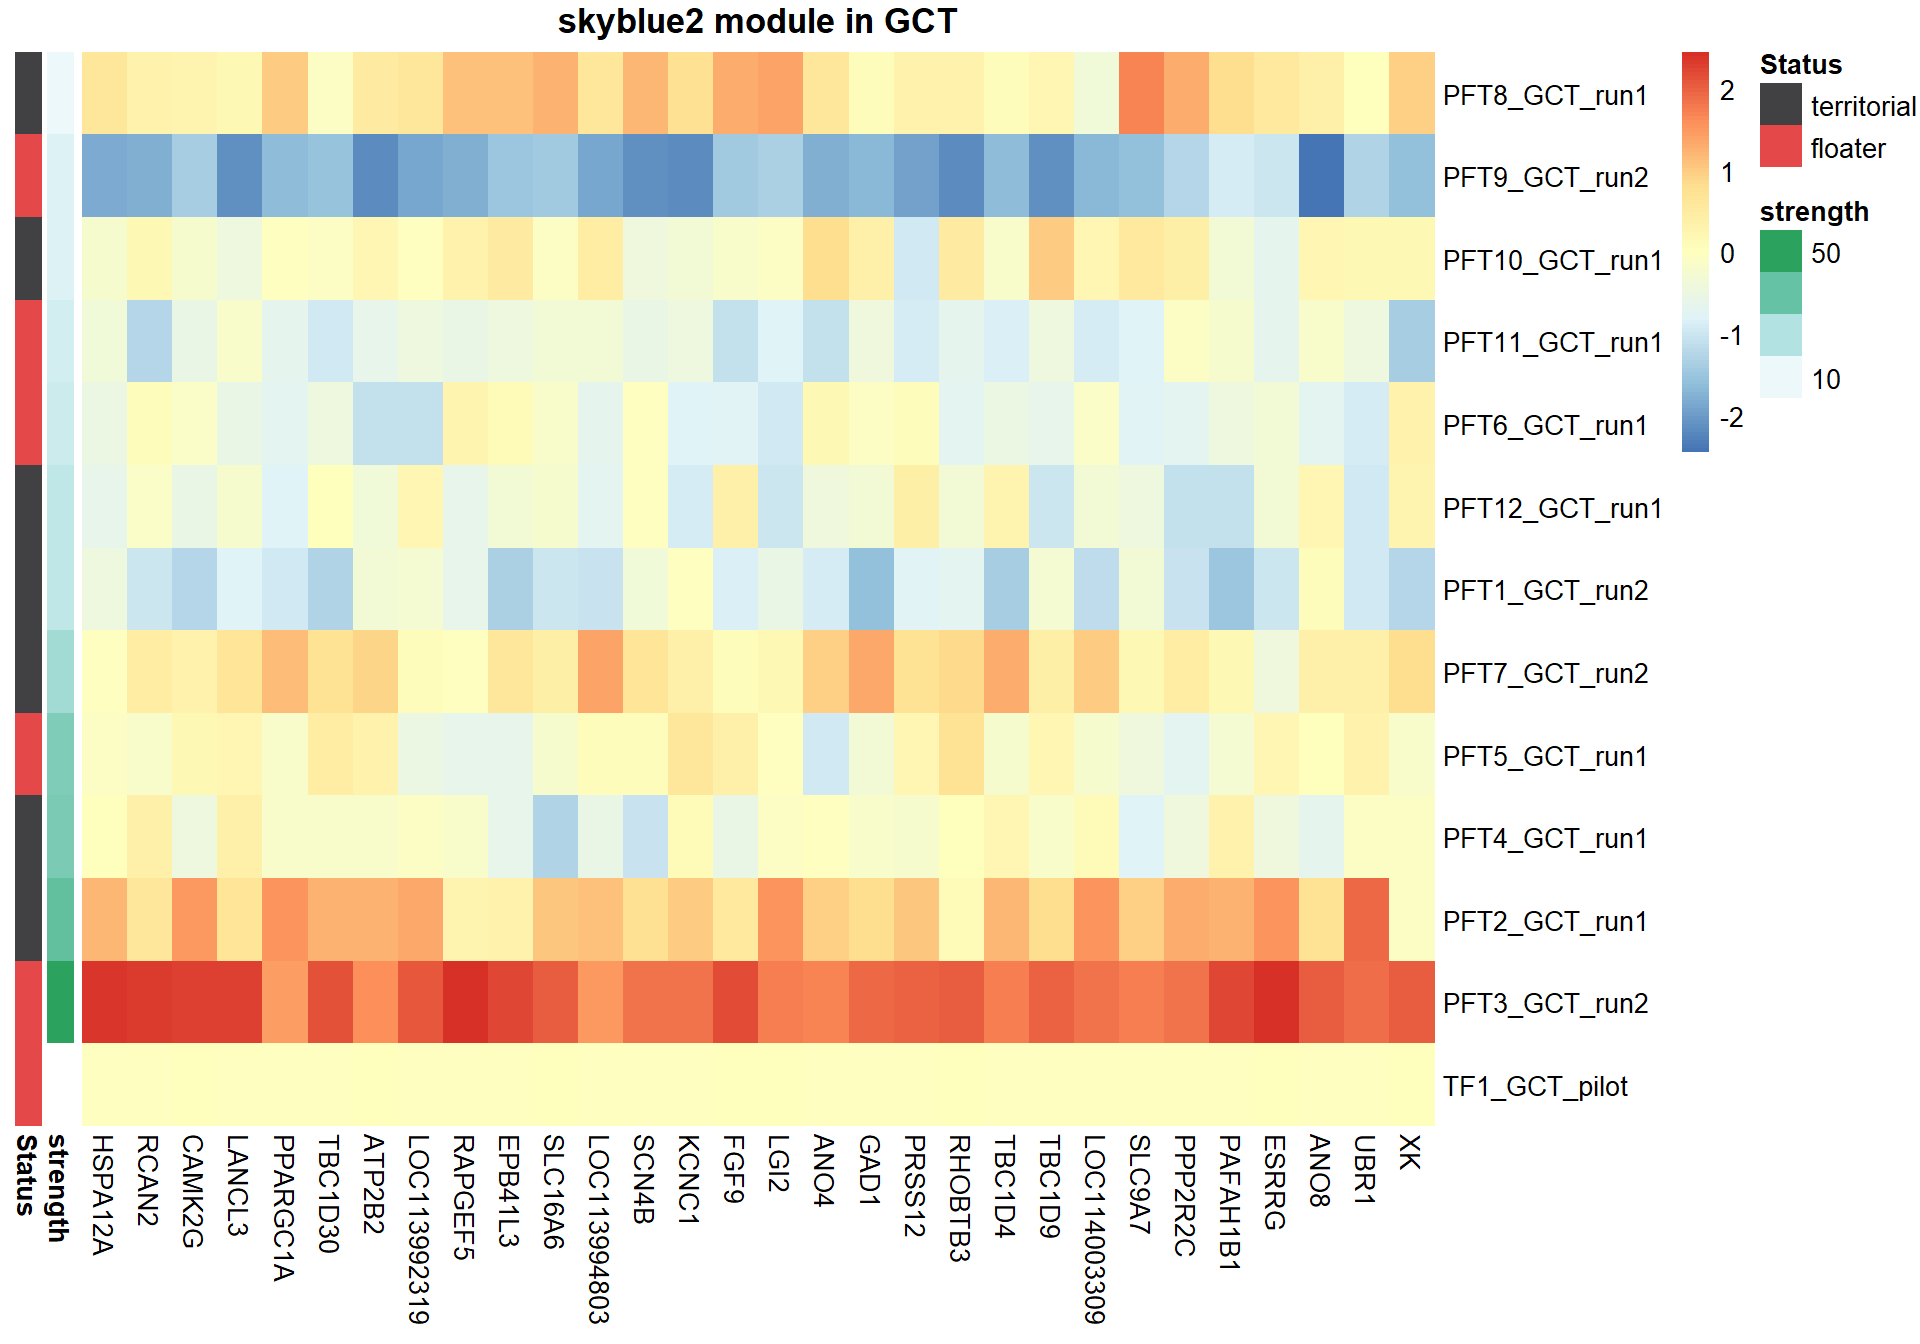
I’m not convinced. Let’s move on to correlations with stronger p-values
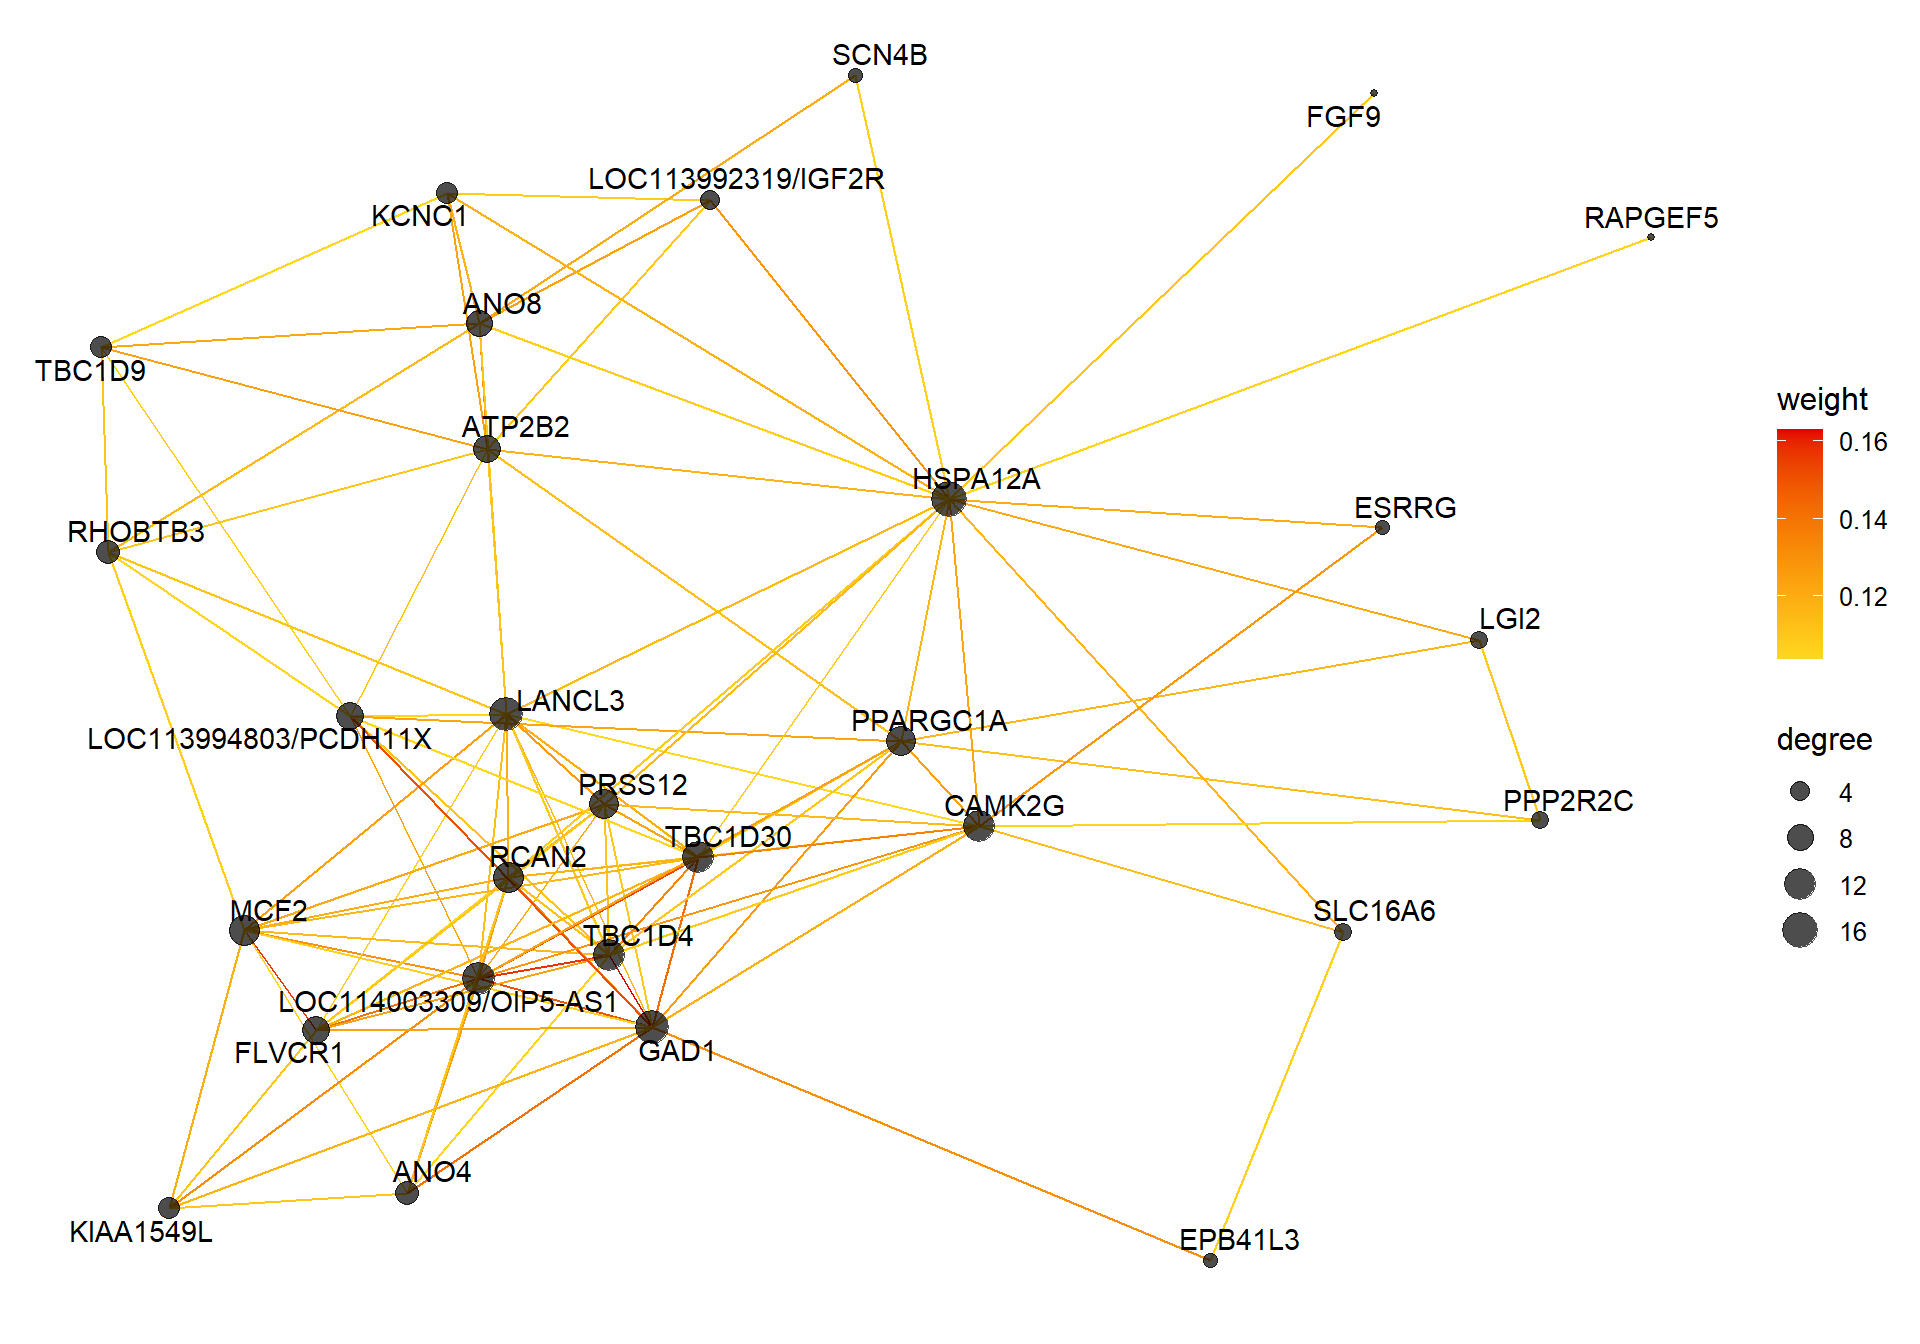
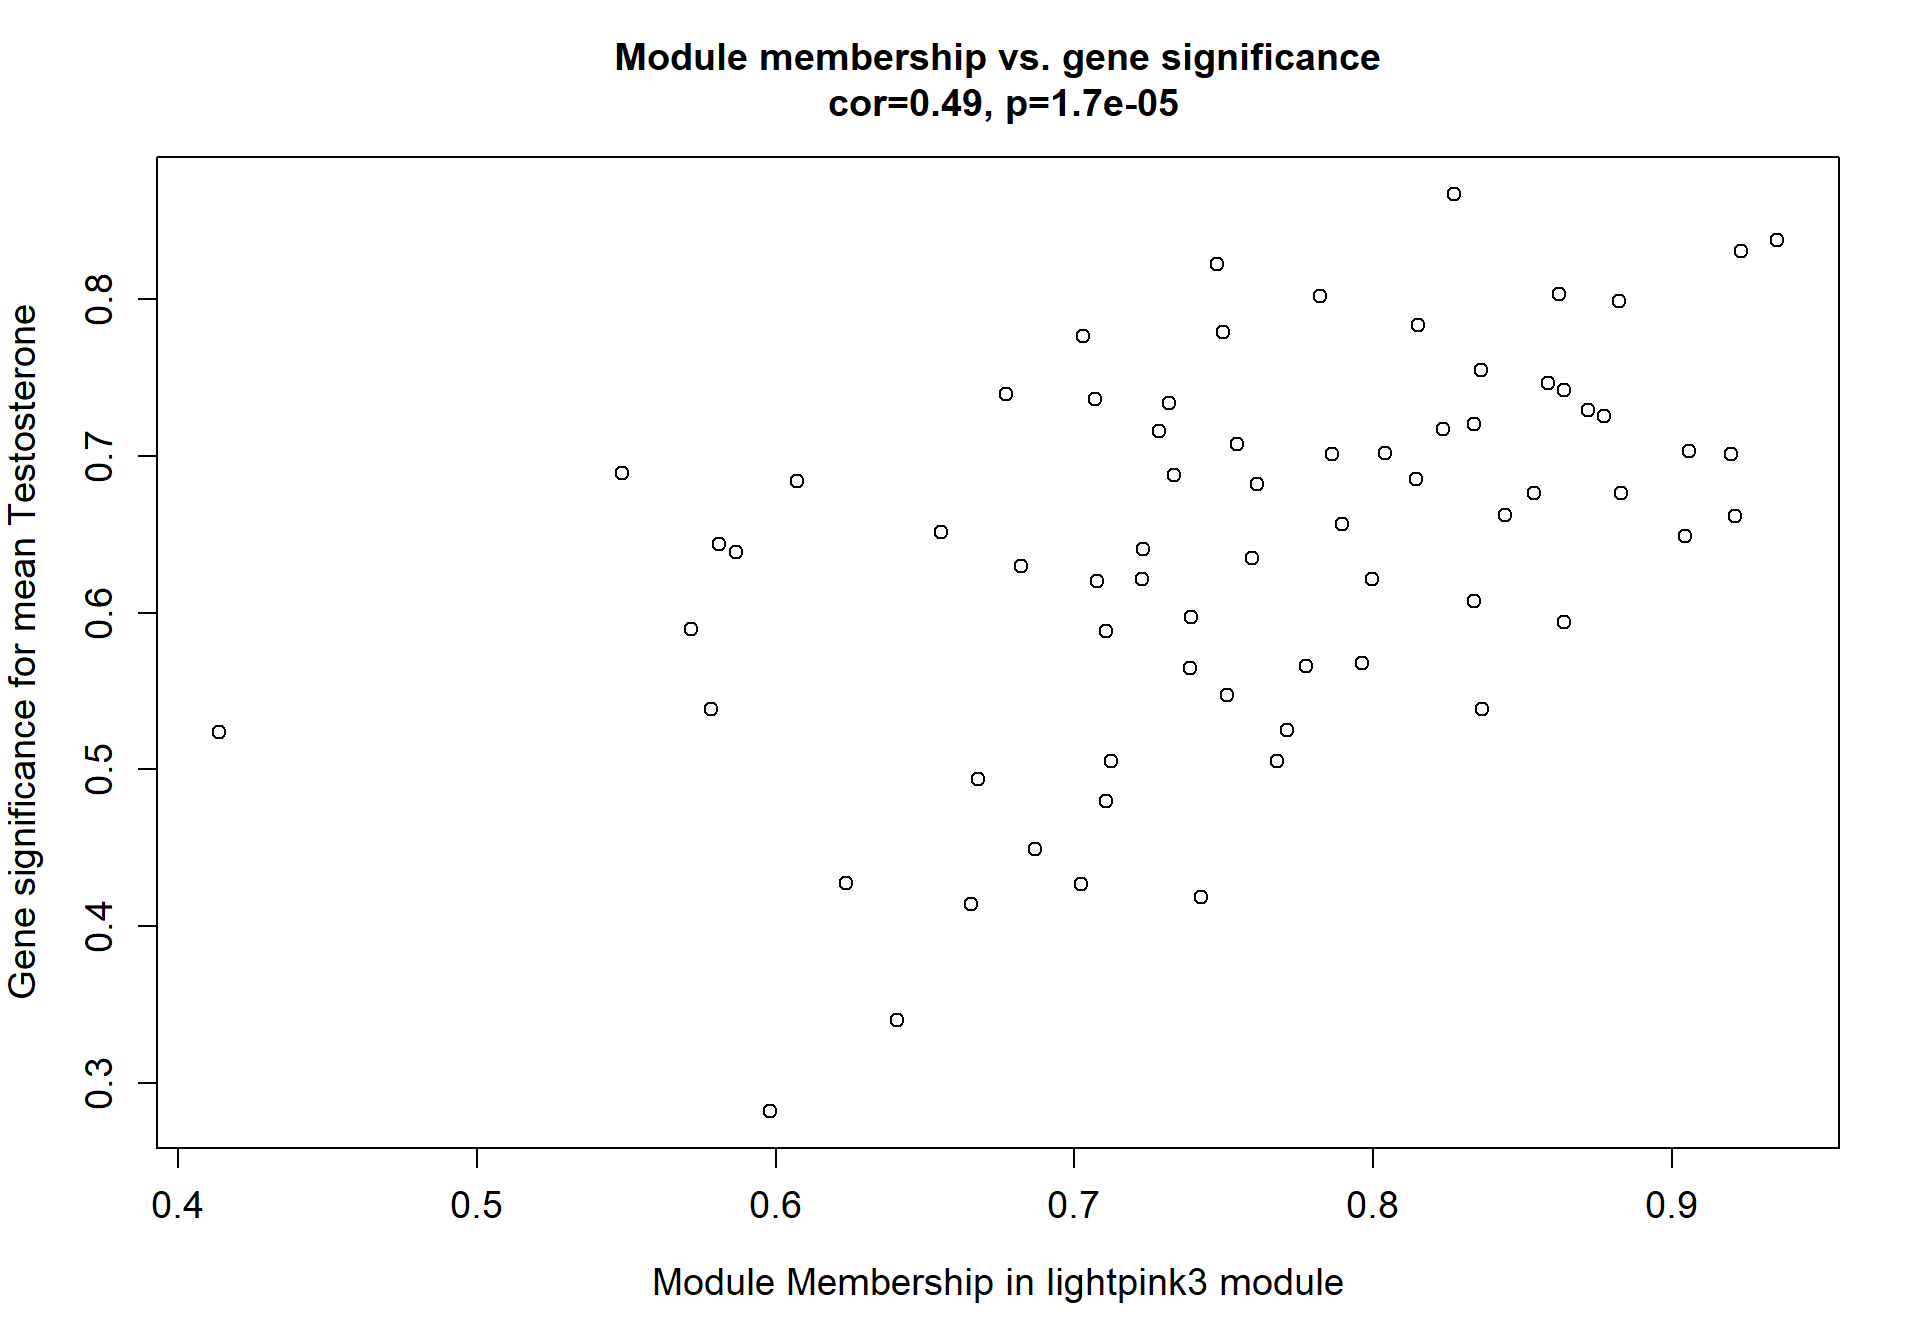
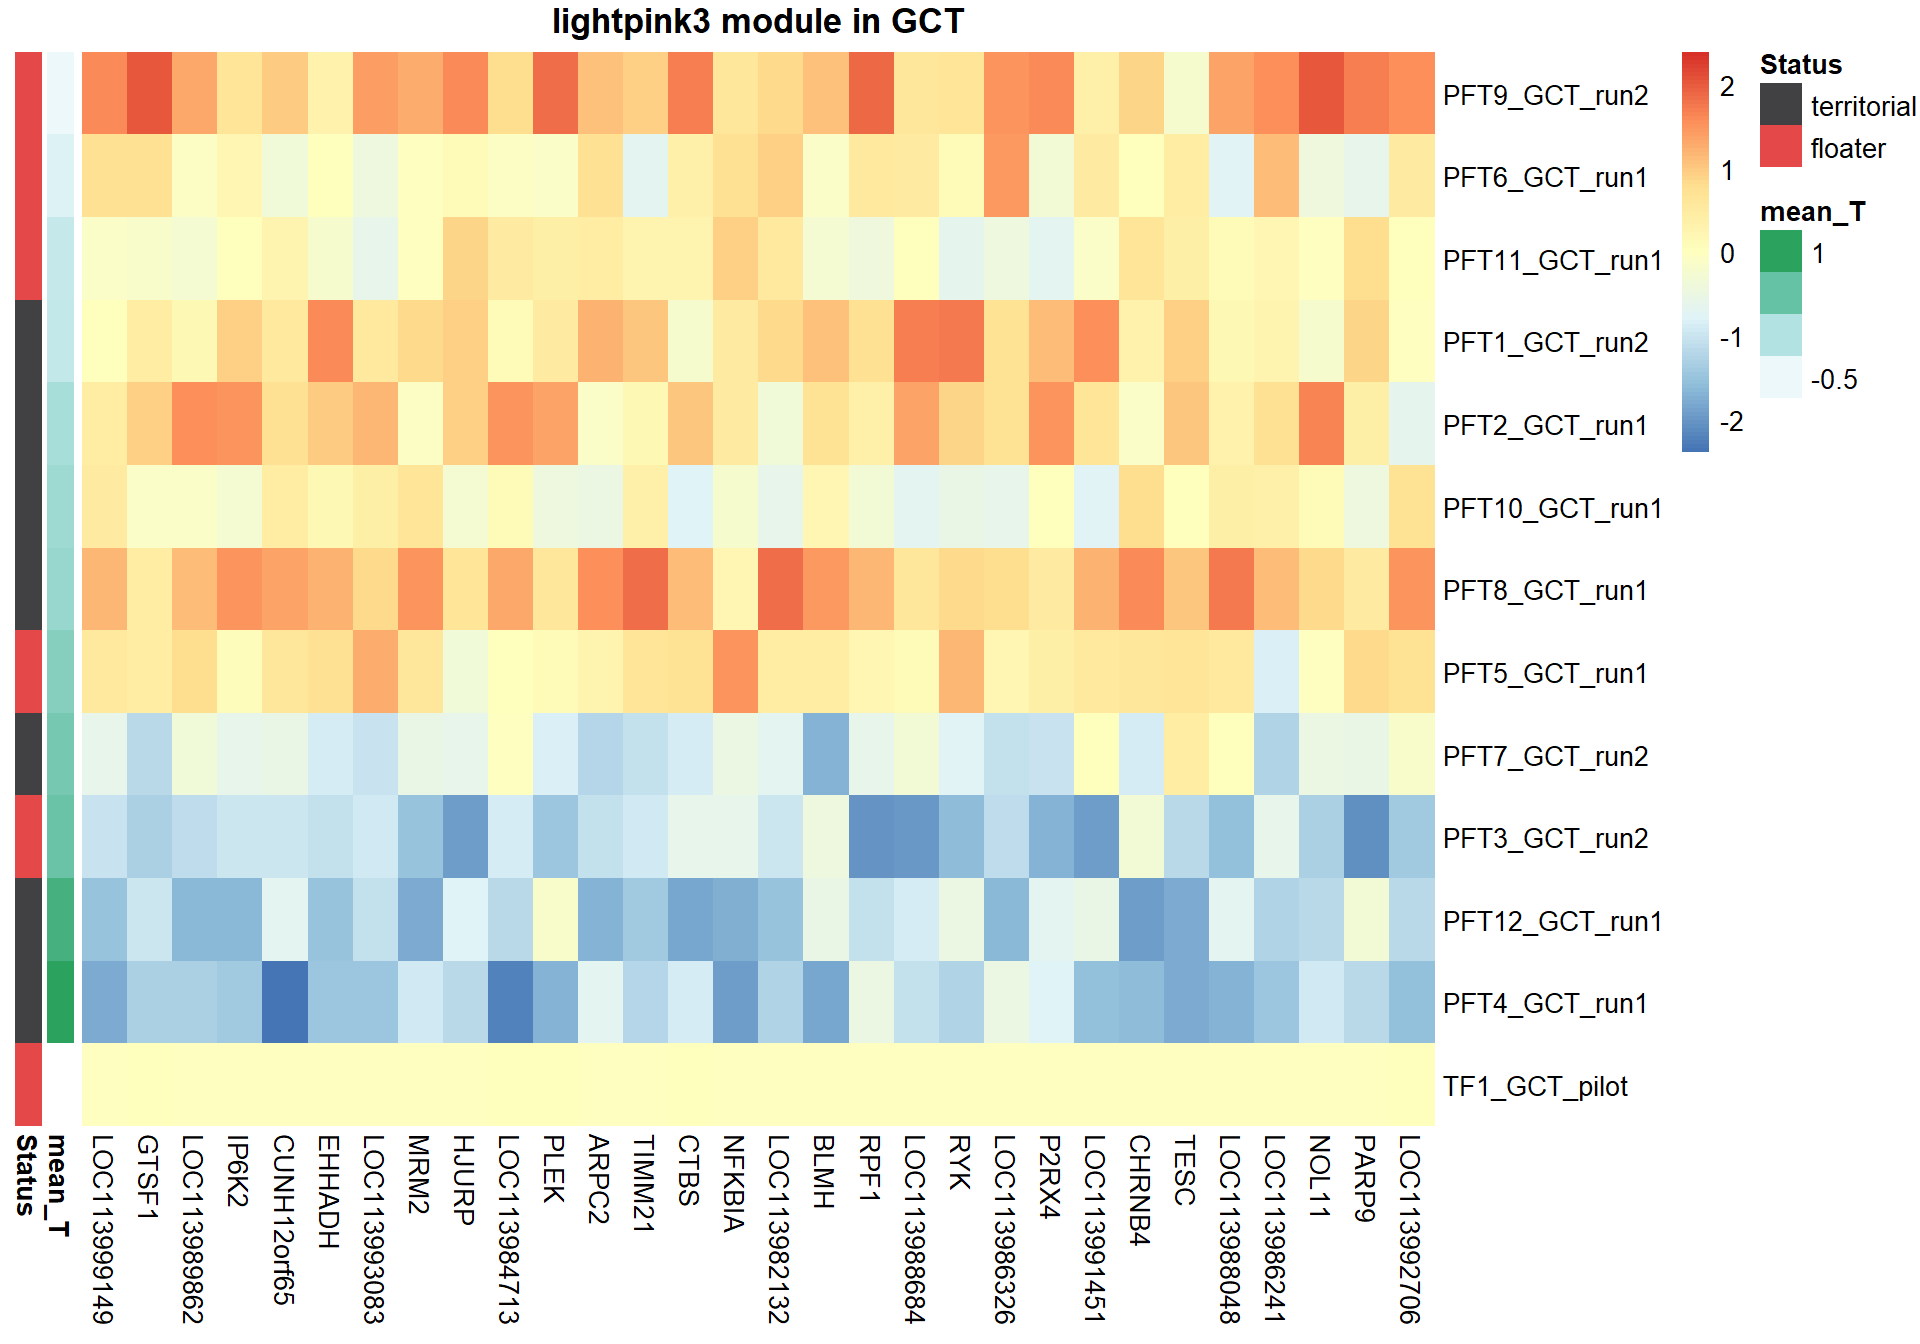
8.1.2 lightpink3 - mean testosterone
8.1.2.1 Gene Ontology
| ID | Description | GeneRatio | BgRatio | pvalue | p.adjust | qvalue | geneID | Count |
|---|---|---|---|---|---|---|---|---|
| GO:0070528 | protein kinase C signaling | 2/58 | 10/12240 | 0.0009691 | 0.2332786 | 0.2190439 | LOC113994699/PLEK | 2 |
| GO:0033540 | fatty acid beta-oxidation using acyl-CoA oxidase | 2/58 | 13/12240 | 0.0016646 | 0.2332786 | 0.2190439 | EHHADH/HSD17B4 | 2 |
| GO:0032703 | negative regulation of interleukin-2 production | 2/58 | 21/12240 | 0.0043738 | 0.2332786 | 0.2190439 | CD34/LOC113986241 | 2 |
| GO:0043392 | negative regulation of DNA binding | 2/58 | 21/12240 | 0.0043738 | 0.2332786 | 0.2190439 | JUN/NFKBIA | 2 |
| GO:0006958 | complement activation, classical pathway | 2/58 | 24/12240 | 0.0056963 | 0.2332786 | 0.2190439 | LOC113984271/LOC113986241 | 2 |
| GO:0034080 | CENP-A containing nucleosome assembly | 2/58 | 28/12240 | 0.0077074 | 0.2332786 | 0.2190439 | CENPT/HJURP | 2 |
| GO:0000082 | G1/S transition of mitotic cell cycle | 3/58 | 87/12240 | 0.0080763 | 0.2332786 | 0.2190439 | EIF4EBP1/MCM2/PLK2 | 3 |
| GO:0051591 | response to cAMP | 2/58 | 29/12240 | 0.0082533 | 0.2332786 | 0.2190439 | DUSP1/JUN | 2 |
| GO:0046627 | negative regulation of insulin receptor signaling pathway | 2/58 | 33/12240 | 0.0106042 | 0.2332786 | 0.2190439 | PRKCQ/SOCS1 | 2 |
| GO:0045746 | negative regulation of Notch signaling pathway | 2/58 | 37/12240 | 0.0132150 | 0.2332786 | 0.2190439 | NFKBIA/TCIM | 2 |
## preparing gene to GO mapping data...## preparing IC data...## Warning in if (class(try(col2rgb(palette), silent = TRUE)) == "try-error")
## stop("color palette is not correct"): the condition has length > 1 and only the
## first element will be used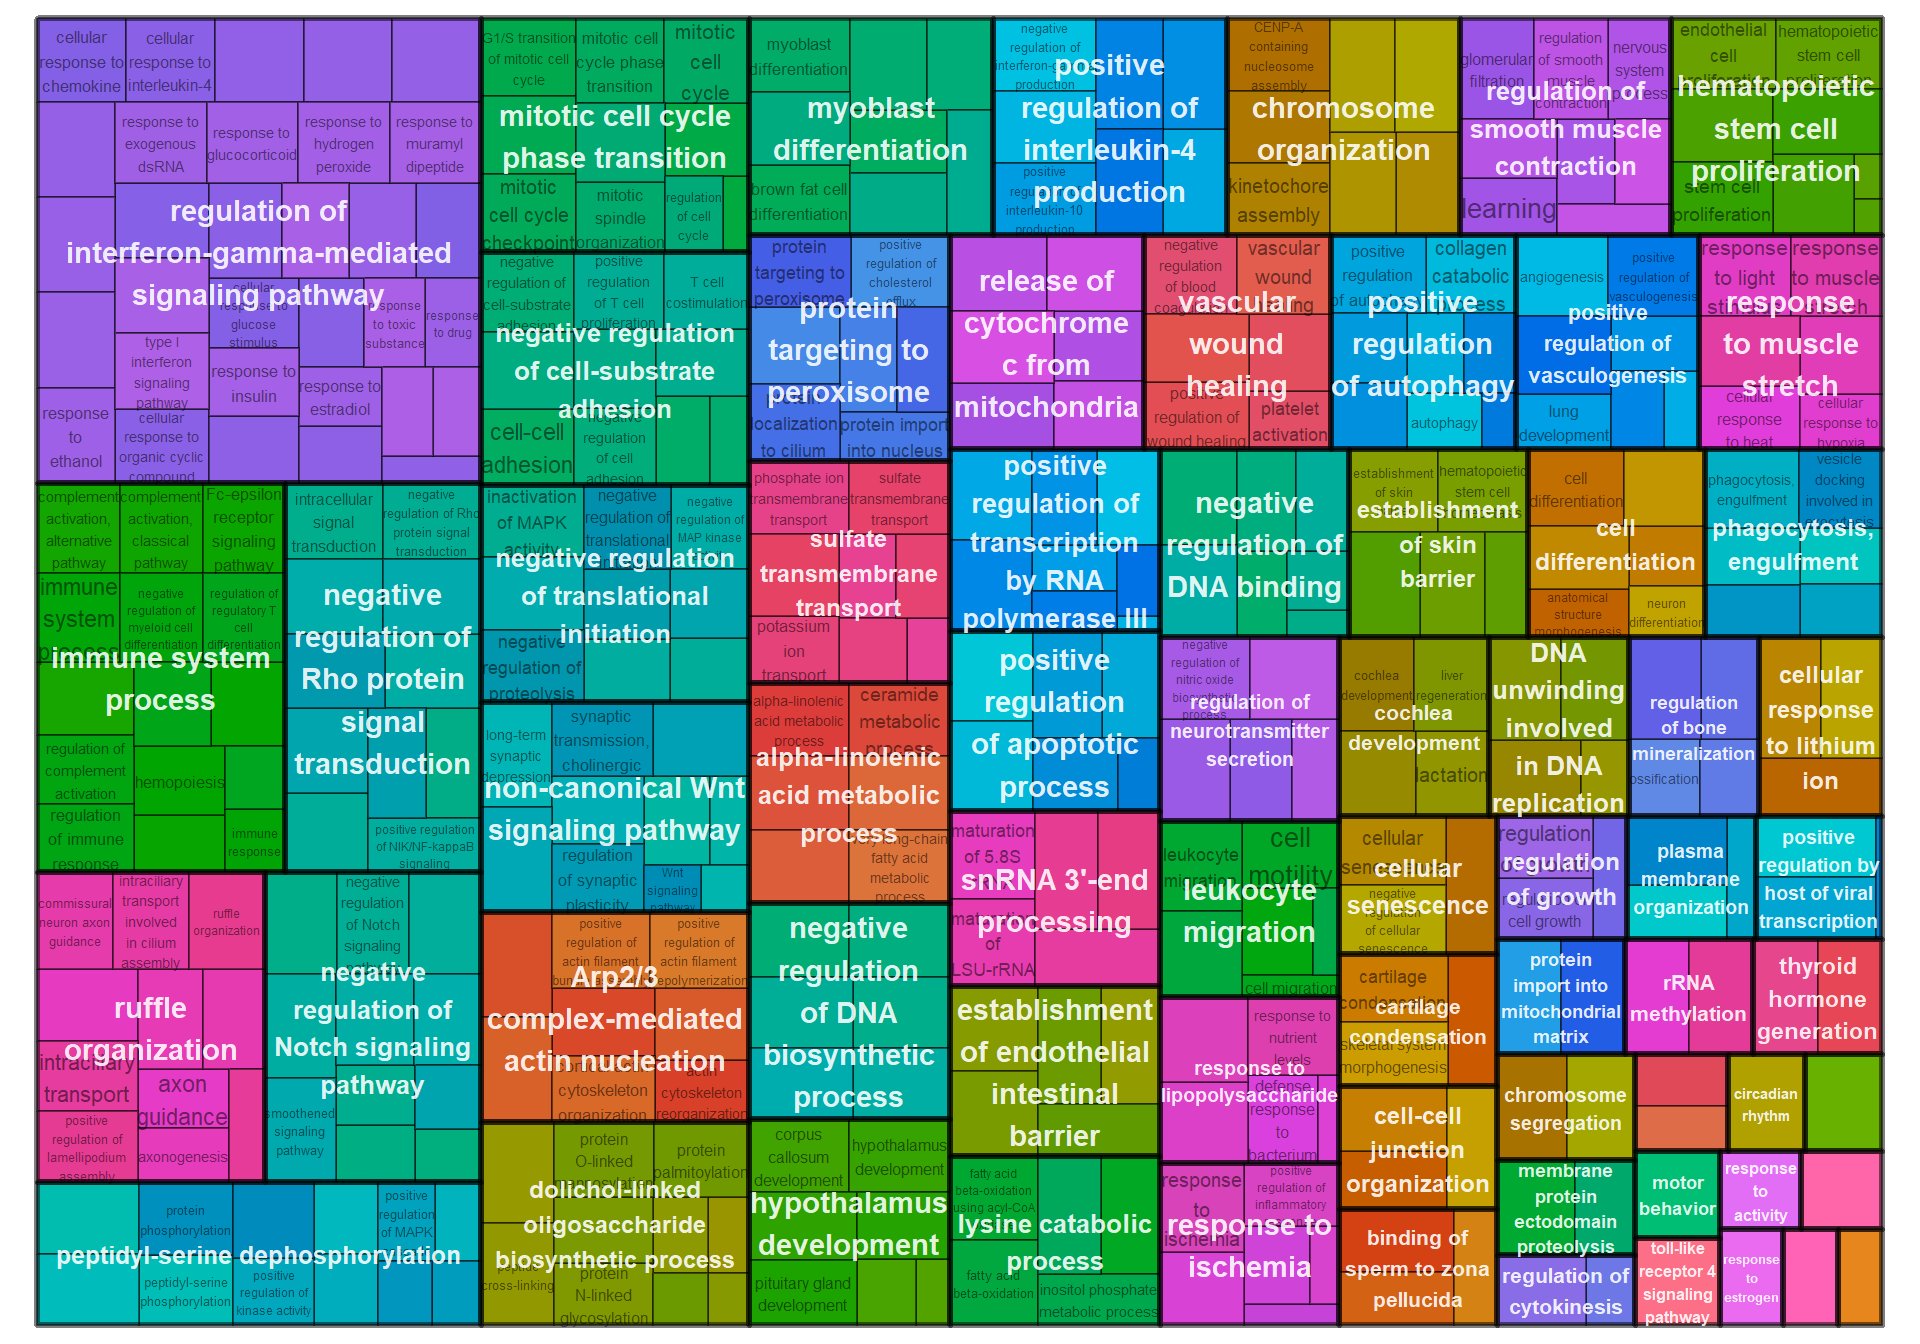
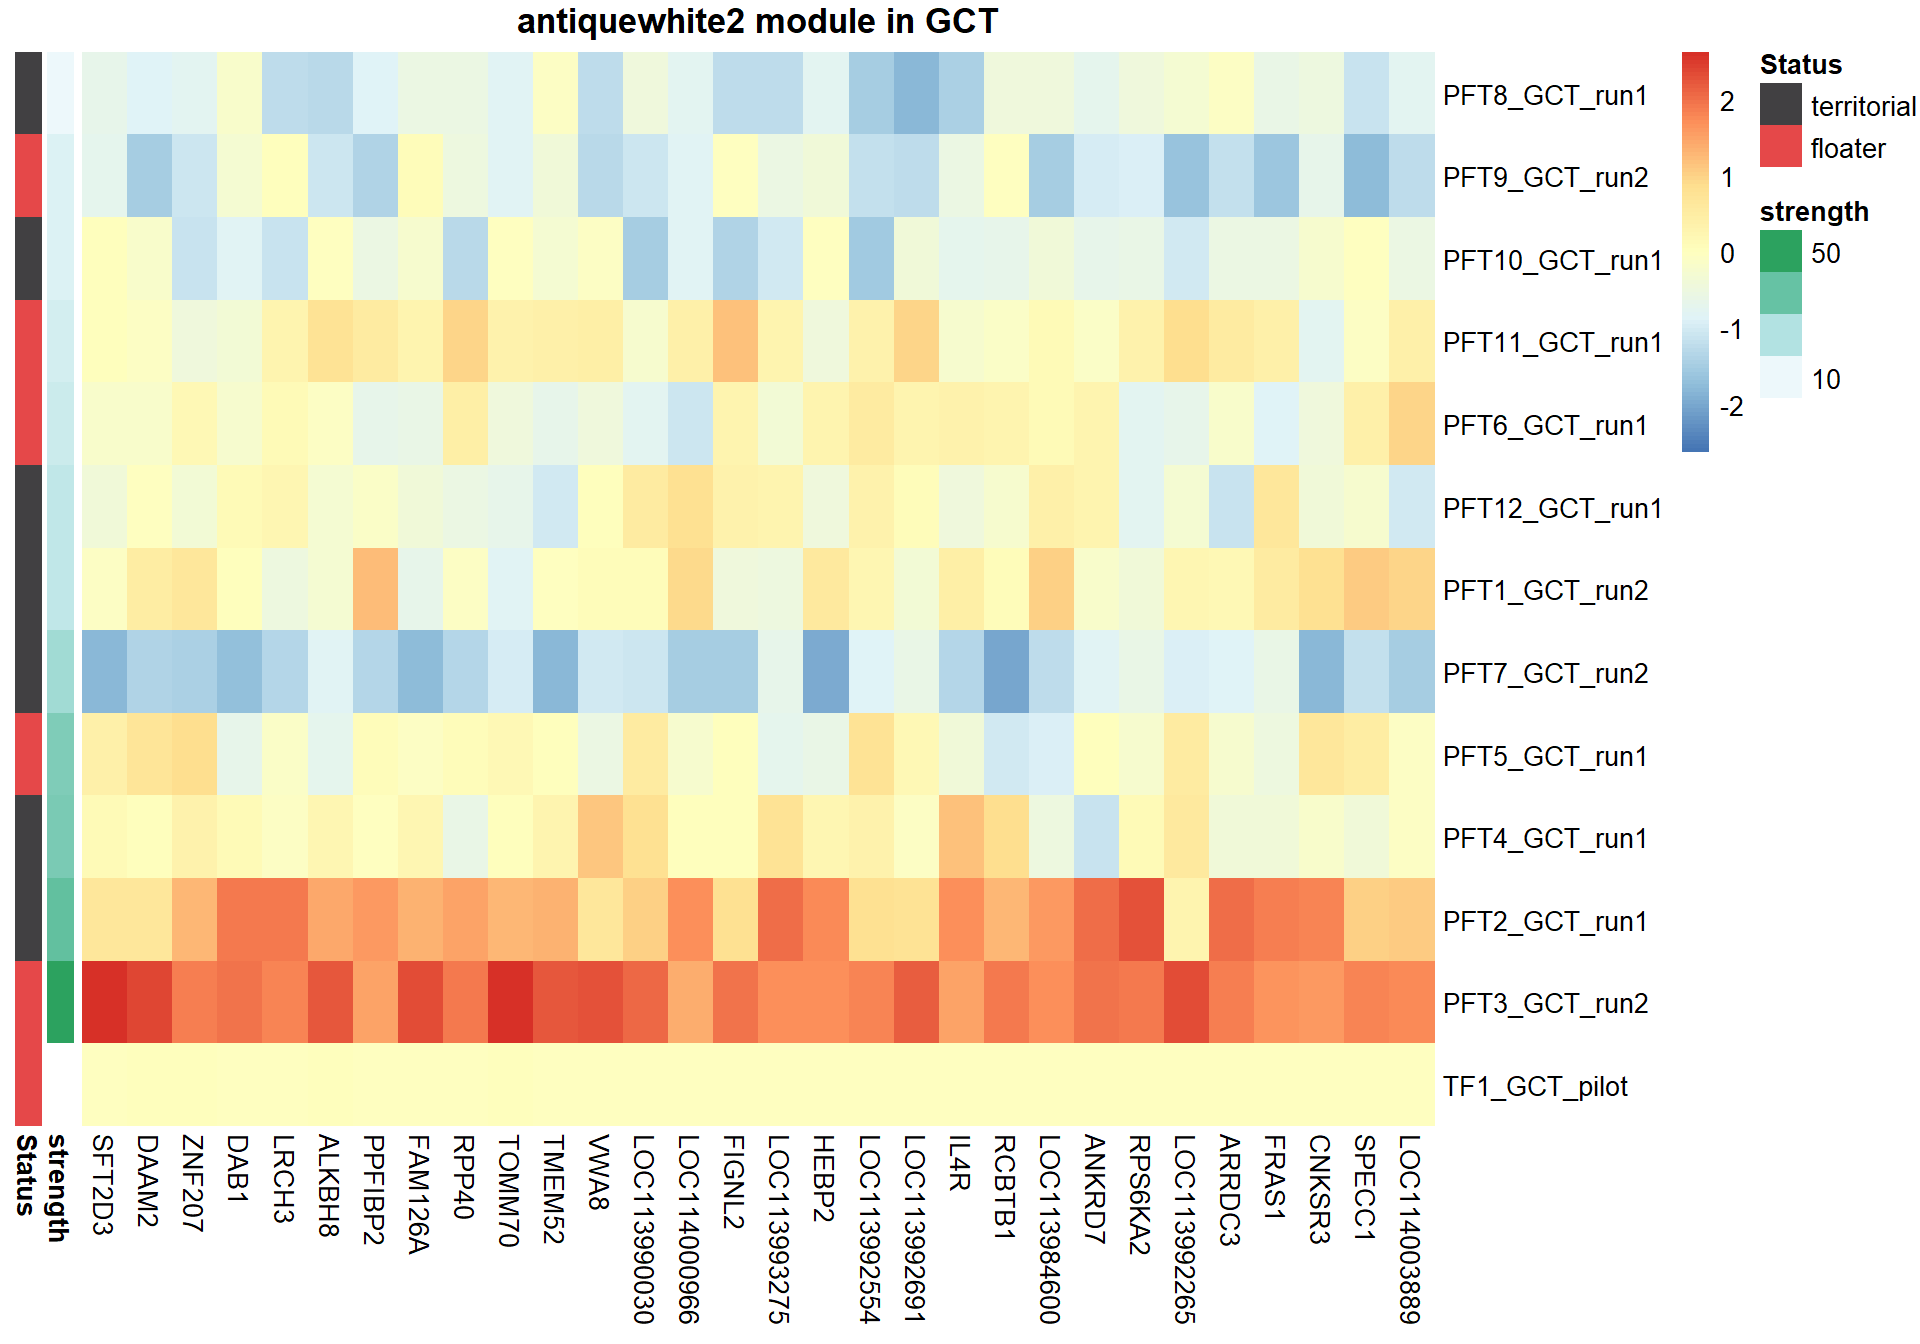
8.1.3 antiquewhite1 - strength
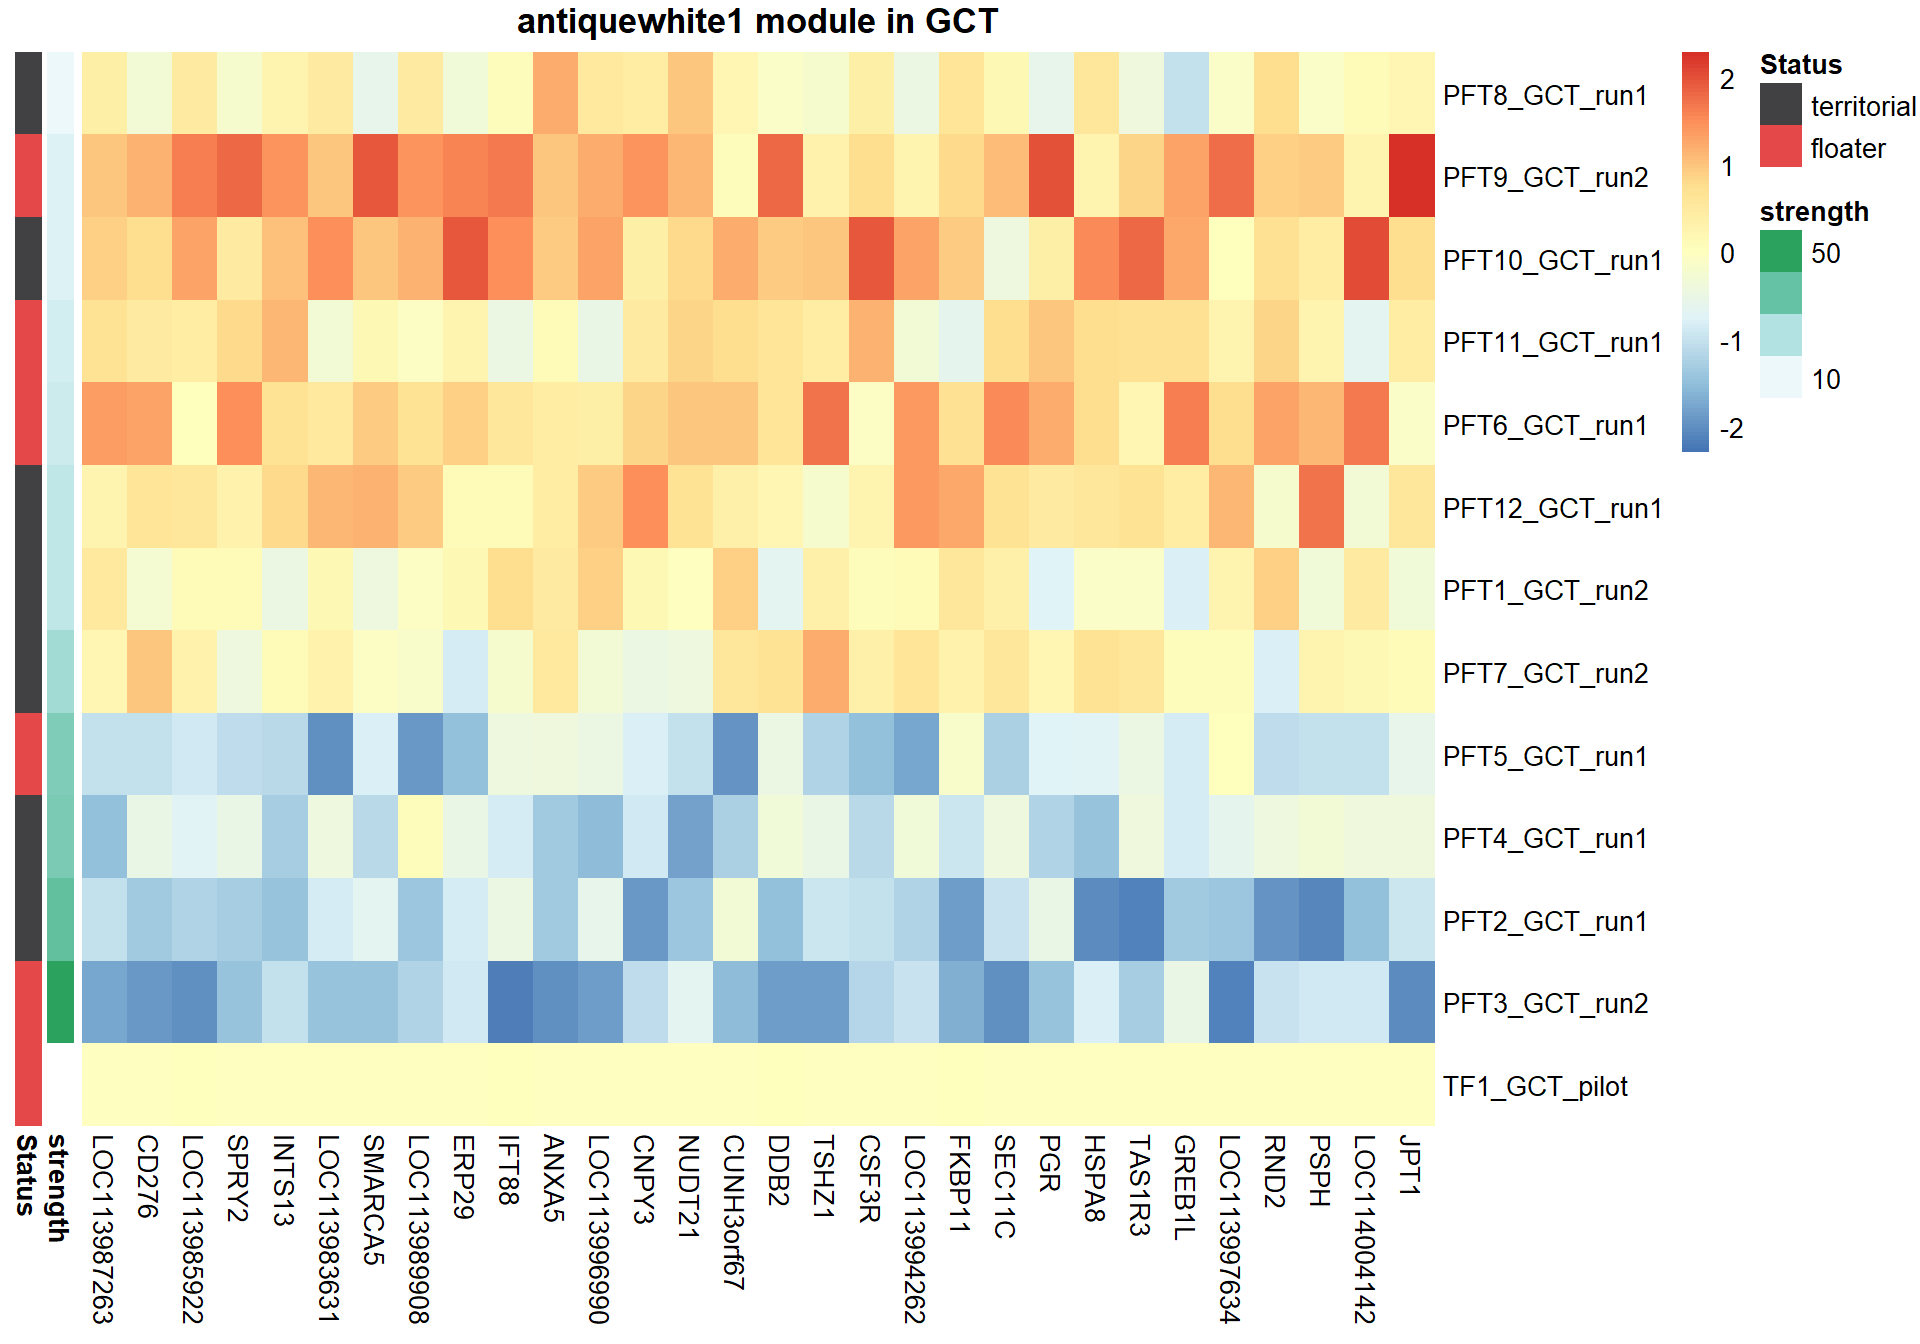
8.1.3.1 Gene Ontology
| ID | Description | GeneRatio | BgRatio | pvalue | p.adjust | qvalue | geneID | Count |
|---|---|---|---|---|---|---|---|---|
| GO:0043044 | ATP-dependent chromatin remodeling | 2/27 | 36/12240 | 0.0028188 | 0.1458146 | 0.1121232 | MBD3/SMARCA5 | 2 |
| GO:1990830 | cellular response to leukemia inhibitory factor | 2/27 | 77/12240 | 0.0123845 | 0.1458146 | 0.1121232 | SMARCA5/SPRY2 | 2 |
| GO:0006613 | cotranslational protein targeting to membrane | 1/27 | 10/12240 | 0.0218491 | 0.1458146 | 0.1121232 | SRP14 | 1 |
| GO:0030518 | intracellular steroid hormone receptor signaling pathway | 1/27 | 10/12240 | 0.0218491 | 0.1458146 | 0.1121232 | PGR | 1 |
| GO:0106074 | aminoacyl-tRNA metabolism involved in translational fidelity | 1/27 | 10/12240 | 0.0218491 | 0.1458146 | 0.1121232 | DTD1 | 1 |
| GO:0002031 | G protein-coupled receptor internalization | 1/27 | 11/12240 | 0.0240085 | 0.1458146 | 0.1121232 | SAG | 1 |
| GO:0042474 | middle ear morphogenesis | 1/27 | 11/12240 | 0.0240085 | 0.1458146 | 0.1121232 | TSHZ1 | 1 |
| GO:0050678 | regulation of epithelial cell proliferation | 1/27 | 11/12240 | 0.0240085 | 0.1458146 | 0.1121232 | PGR | 1 |
| GO:0070914 | UV-damage excision repair | 1/27 | 11/12240 | 0.0240085 | 0.1458146 | 0.1121232 | DDB2 | 1 |
| GO:0098974 | postsynaptic actin cytoskeleton organization | 1/27 | 11/12240 | 0.0240085 | 0.1458146 | 0.1121232 | LOC113998505 | 1 |
## preparing gene to GO mapping data...## preparing IC data...## Warning in if (class(try(col2rgb(palette), silent = TRUE)) == "try-error")
## stop("color palette is not correct"): the condition has length > 1 and only the
## first element will be used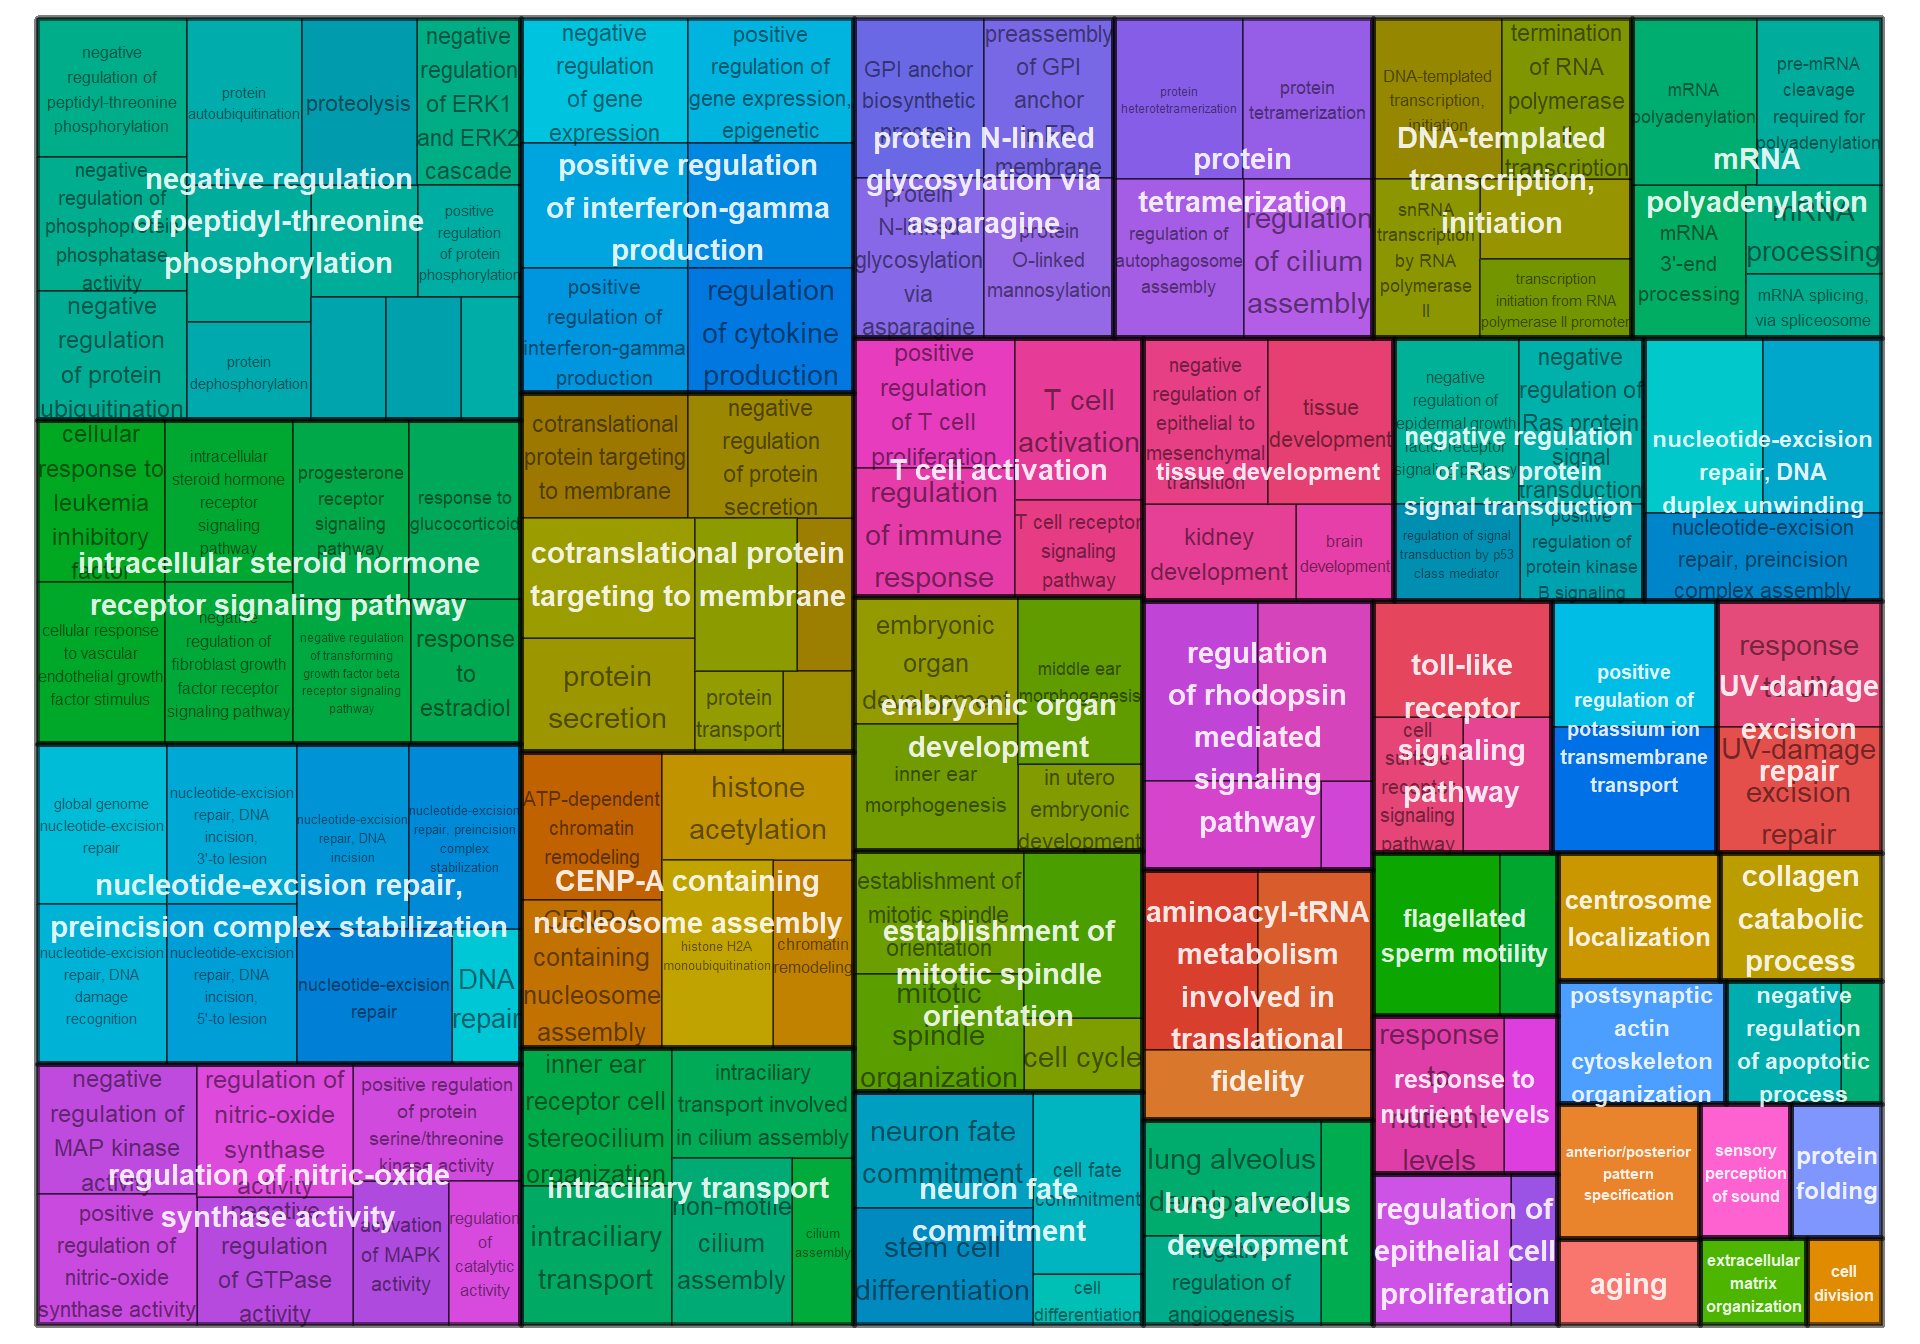
8.1.4 antiquewhite2 - strength
8.1.4.1 Gene Ontology
| ID | Description | GeneRatio | BgRatio | pvalue | p.adjust | qvalue | geneID | Count |
|---|---|---|---|---|---|---|---|---|
| GO:0009566 | fertilization | 3/95 | 21/12240 | 0.0005443 | 0.1091090 | 0.1091090 | AAAS/LOC114000708/MEIOB | 3 |
| GO:0046854 | phosphatidylinositol phosphorylation | 4/95 | 50/12240 | 0.0005968 | 0.1091090 | 0.1091090 | FAM126A/PIK3C3/PIK3CB/PIK3R6 | 4 |
| GO:0090305 | nucleic acid phosphodiester bond hydrolysis | 4/95 | 54/12240 | 0.0008003 | 0.1091090 | 0.1091090 | DCLRE1C/EXD2/LOC114001323/MEIOB | 4 |
| GO:0010975 | regulation of neuron projection development | 3/95 | 29/12240 | 0.0014298 | 0.1461951 | 0.1461951 | IL1RAPL1/LOC113992691/MARK1 | 3 |
| GO:0019229 | regulation of vasoconstriction | 2/95 | 12/12240 | 0.0037400 | 0.2549409 | 0.2549409 | ECE1/EDN3 | 2 |
| GO:0036092 | phosphatidylinositol-3-phosphate biosynthetic process | 2/95 | 12/12240 | 0.0037400 | 0.2549409 | 0.2549409 | PIK3C3/PIK3CB | 2 |
| GO:0002009 | morphogenesis of an epithelium | 2/95 | 14/12240 | 0.0051048 | 0.2982672 | 0.2982672 | FRAS1/RIPK4 | 2 |
| GO:0000729 | DNA double-strand break processing | 2/95 | 15/12240 | 0.0058605 | 0.2996201 | 0.2996201 | EXD2/LOC114001323 | 2 |
| GO:0048873 | homeostasis of number of cells within a tissue | 2/95 | 21/12240 | 0.0113724 | 0.3877285 | 0.3877285 | ADD1/LOC114000708 | 2 |
| GO:0090023 | positive regulation of neutrophil chemotaxis | 2/95 | 21/12240 | 0.0113724 | 0.3877285 | 0.3877285 | MCU/MOSPD2 | 2 |
## preparing gene to GO mapping data...## preparing IC data...## Warning in if (class(try(col2rgb(palette), silent = TRUE)) == "try-error")
## stop("color palette is not correct"): the condition has length > 1 and only the
## first element will be used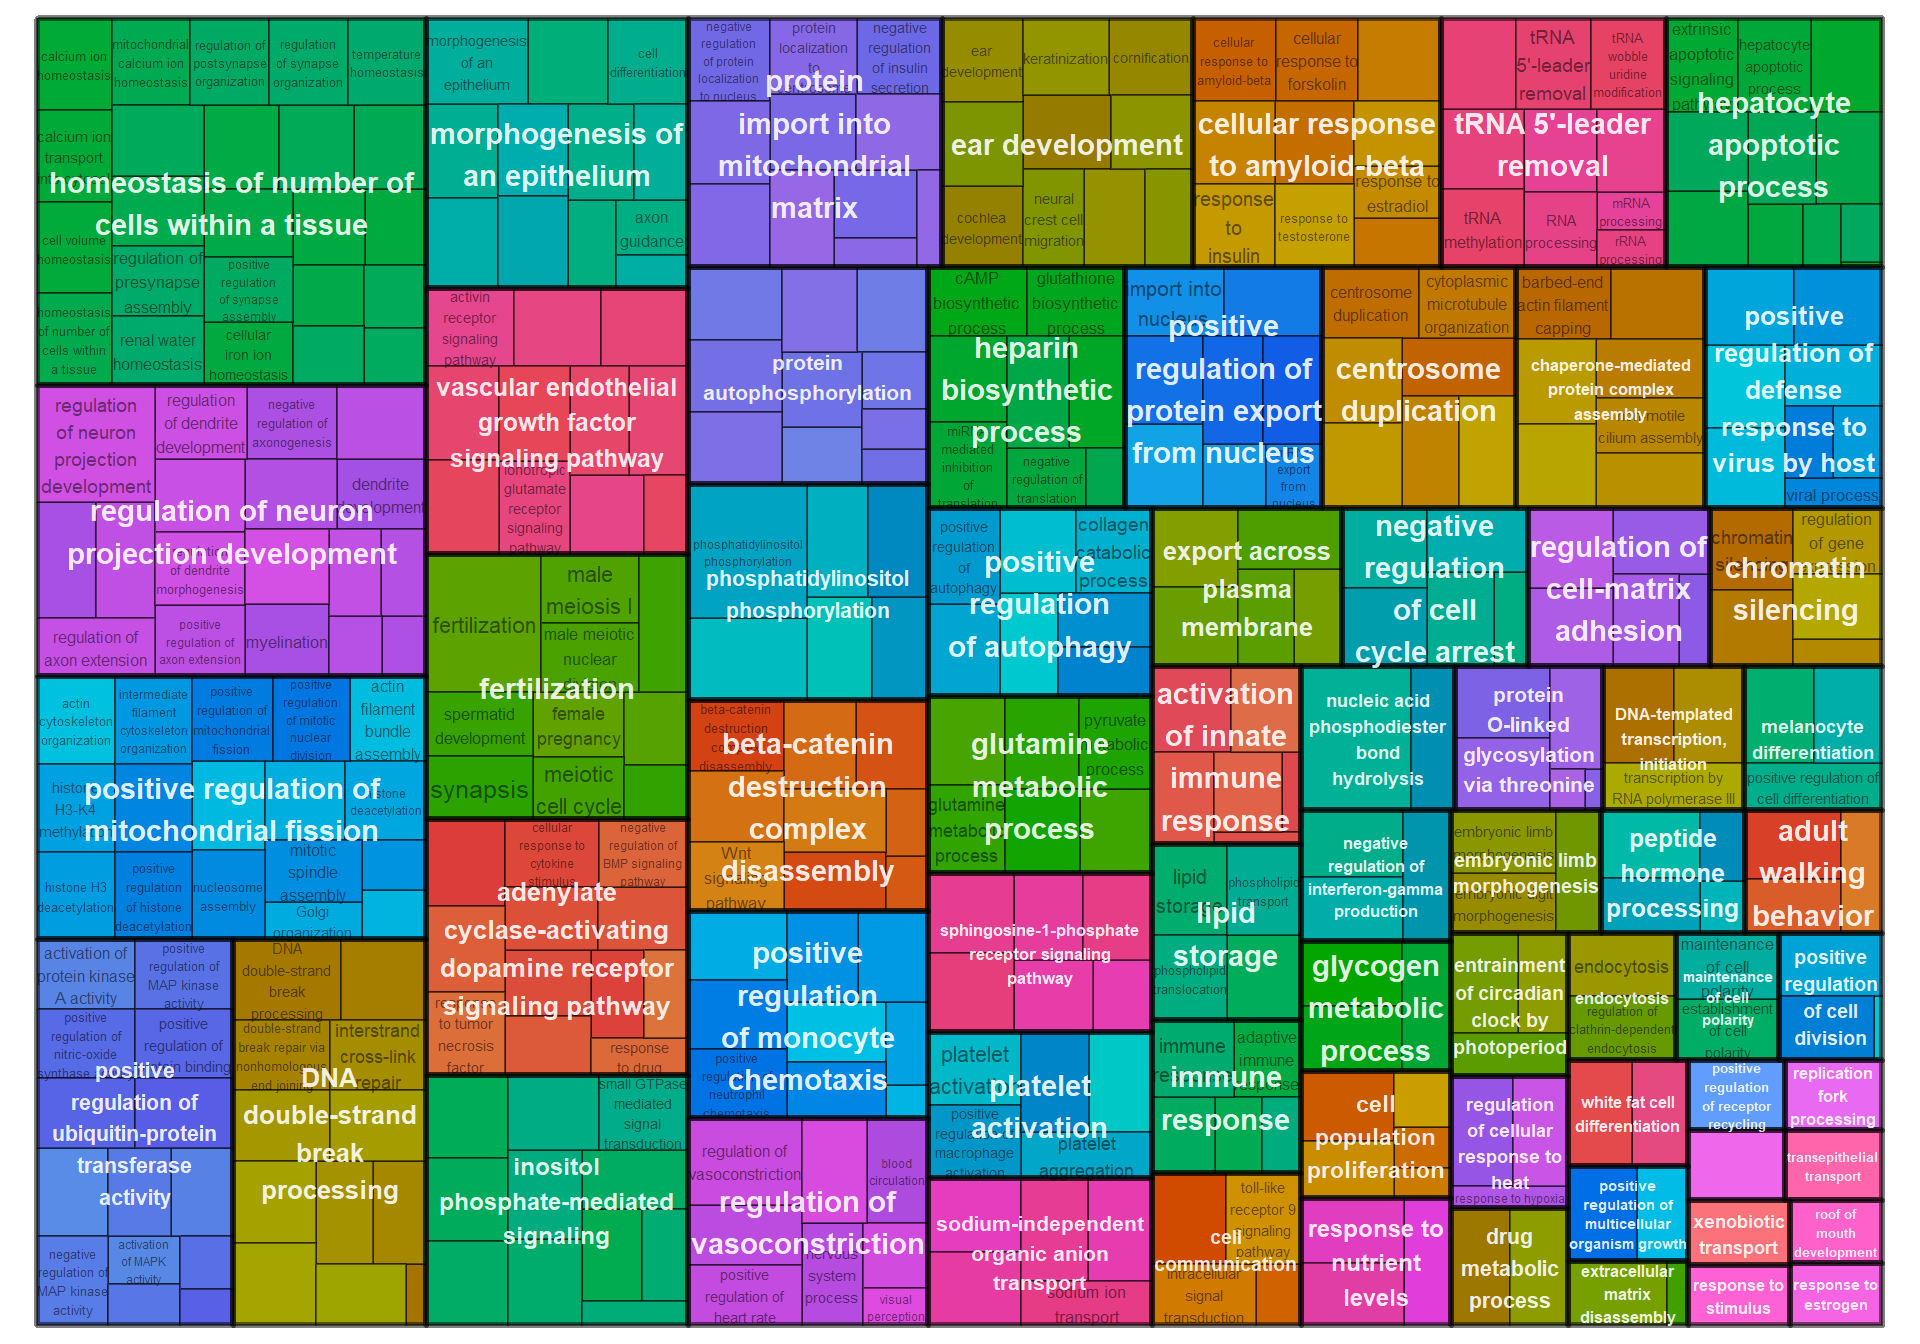
8.1.5 coral1 - strength

8.1.5.1 Gene Ontology
| ID | Description | GeneRatio | BgRatio | pvalue | p.adjust | qvalue | geneID | Count |
|---|---|---|---|---|---|---|---|---|
| GO:0007275 | multicellular organism development | 11/149 | 303/12240 | 0.0011903 | 0.5366347 | 0.5366347 | CDH8/DGKD/EPHA5/ERBB4/ERMARD/NELFA/PAQR5/STRBP/TDRD9/VIRMA/WIF1 | 11 |
| GO:0071392 | cellular response to estradiol stimulus | 3/149 | 31/12240 | 0.0061911 | 0.5366347 | 0.5366347 | ESR2/NCOA3/NRIP1 | 3 |
| GO:0030518 | intracellular steroid hormone receptor signaling pathway | 2/149 | 10/12240 | 0.0062129 | 0.5366347 | 0.5366347 | ESR2/NR3C1 | 2 |
| GO:2000010 | positive regulation of protein localization to cell surface | 2/149 | 11/12240 | 0.0075332 | 0.5366347 | 0.5366347 | ERBB4/MAP1A | 2 |
| GO:0042472 | inner ear morphogenesis | 3/149 | 36/12240 | 0.0094090 | 0.5366347 | 0.5366347 | ALDH1A3/GBX2/PRRX1 | 3 |
| GO:0018105 | peptidyl-serine phosphorylation | 6/149 | 148/12240 | 0.0094306 | 0.5366347 | 0.5366347 | CAB39/CAMK1D/MAPK14/MAPKAPK5/SGK2/WNK1 | 6 |
| GO:0032793 | positive regulation of CREB transcription factor activity | 2/149 | 14/12240 | 0.0121698 | 0.5366347 | 0.5366347 | CAMK1D/EPHA5 | 2 |
| GO:0002028 | regulation of sodium ion transport | 2/149 | 15/12240 | 0.0139309 | 0.5366347 | 0.5366347 | LOC113983777/WNK1 | 2 |
| GO:0050773 | regulation of dendrite development | 2/149 | 15/12240 | 0.0139309 | 0.5366347 | 0.5366347 | CAMK1D/CSMD3 | 2 |
| GO:0001755 | neural crest cell migration | 3/149 | 45/12240 | 0.0172755 | 0.5366347 | 0.5366347 | ERBB4/GBX2/SEMA5B | 3 |
## preparing gene to GO mapping data...## preparing IC data...## Warning in if (class(try(col2rgb(palette), silent = TRUE)) == "try-error")
## stop("color palette is not correct"): the condition has length > 1 and only the
## first element will be used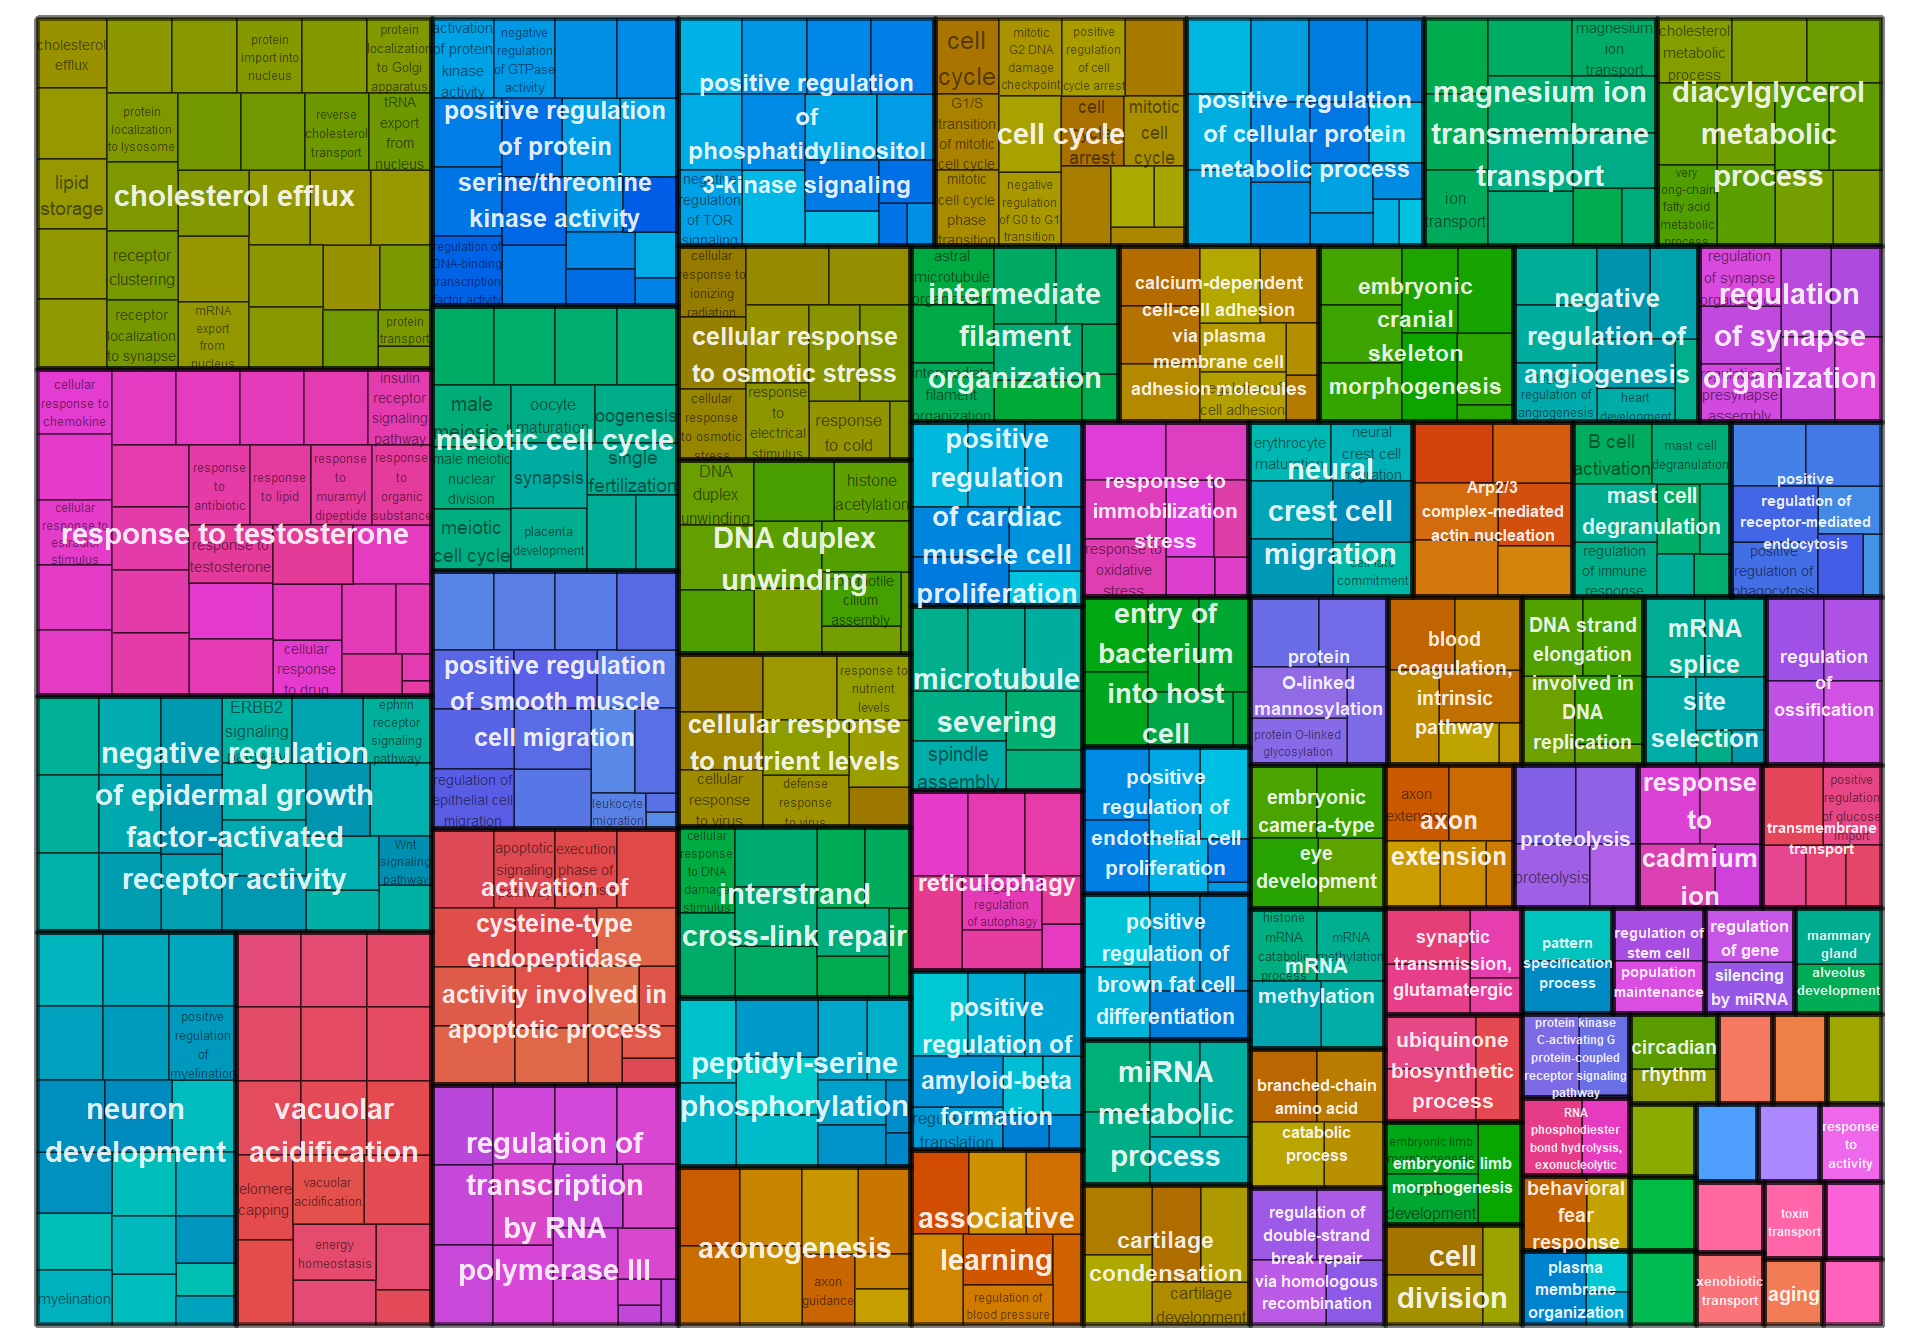
9 Nucleus Taenia (TnA)
## [1] 14696## Warning in DESeqDataSet(se, design = design, ignoreRank): some variables in
## design formula are characters, converting to factors## estimating size factors## estimating dispersions## gene-wise dispersion estimates## mean-dispersion relationship## final dispersion estimates## fitting model and testing## -- replacing outliers and refitting for 33 genes
## -- DESeq argument 'minReplicatesForReplace' = 7
## -- original counts are preserved in counts(dds)## estimating dispersions## fitting model and testing## Power SFT.R.sq slope truncated.R.sq mean.k. median.k. max.k.
## 1 1 9.27e-03 15.90000 0.870 7350.00 7350.00 7430.0
## 2 2 2.09e-03 -2.39000 0.926 4010.00 4000.00 4300.0
## 3 3 4.48e-03 1.51000 0.968 2330.00 2330.00 2730.0
## 4 4 1.51e-02 1.62000 0.973 1440.00 1430.00 1840.0
## 5 5 1.31e-02 1.02000 0.971 922.00 912.00 1310.0
## 6 6 1.39e-02 0.77800 0.973 614.00 604.00 958.0
## 7 7 3.84e-03 0.31700 0.964 422.00 412.00 724.0
## 8 8 4.59e-06 0.00917 0.955 298.00 288.00 564.0
## 9 9 2.28e-02 -0.57300 0.944 215.00 206.00 452.0
## 10 10 9.46e-02 -1.07000 0.938 159.00 150.00 369.0
## 11 11 2.05e-01 -1.44000 0.940 119.00 111.00 306.0
## 12 12 3.35e-01 -1.76000 0.952 90.60 83.60 257.0
## 13 14 5.72e-01 -2.18000 0.978 54.90 49.10 186.0
## 14 16 7.14e-01 -2.41000 0.991 34.80 30.10 140.0
## 15 18 7.92e-01 -2.54000 0.996 22.90 19.10 108.0
## 16 20 8.29e-01 -2.64000 0.993 15.60 12.50 84.7
## 17 22 8.55e-01 -2.68000 0.994 10.90 8.45 67.8
## 18 24 8.75e-01 -2.68000 0.997 7.83 5.83 55.1
## 19 26 8.92e-01 -2.67000 0.998 5.73 4.11 45.4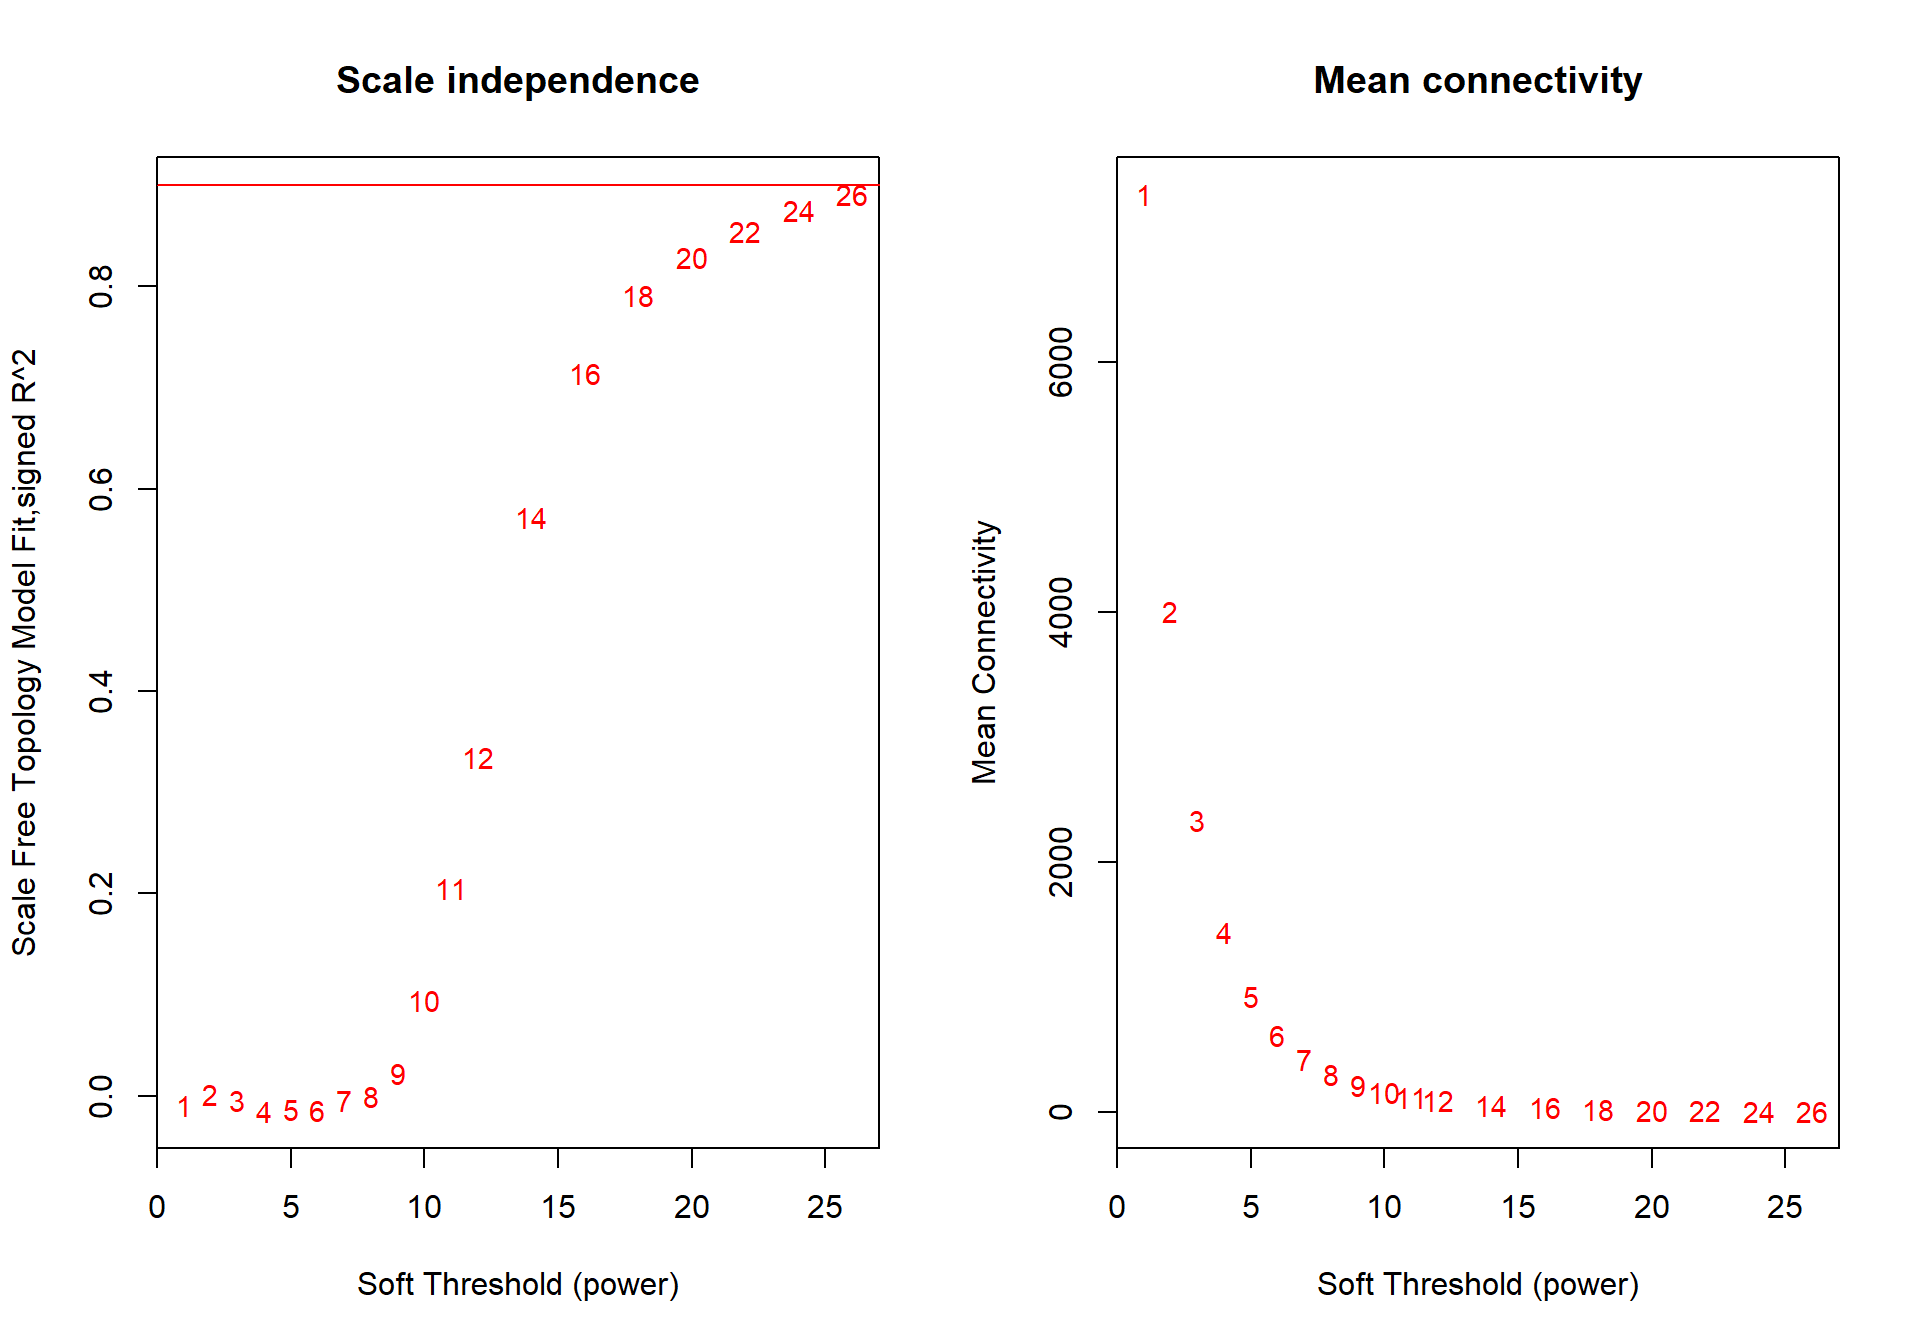
The soft-power selected for TNA is 18.
| moduleColors | Freq |
|---|---|
| antiquewhite2 | 53 |
| antiquewhite4 | 140 |
| black | 1096 |
| blue | 1787 |
| blue2 | 470 |
| brown4 | 106 |
| coral1 | 1579 |
| coral3 | 2067 |
| darkgrey | 254 |
| darkorange | 1383 |
| darkorange2 | 1848 |
| darkseagreen4 | 372 |
| grey | 5 |
| honeydew | 55 |
| lavenderblush3 | 217 |
| lightsteelblue | 612 |
| lightyellow | 585 |
| magenta4 | 59 |
| mediumpurple4 | 49 |
| navajowhite1 | 60 |
| orangered3 | 81 |
| orangered4 | 954 |
| palevioletred3 | 95 |
| skyblue1 | 82 |
| skyblue2 | 84 |
| skyblue4 | 44 |
| tan | 457 |
| thistle2 | 99 |
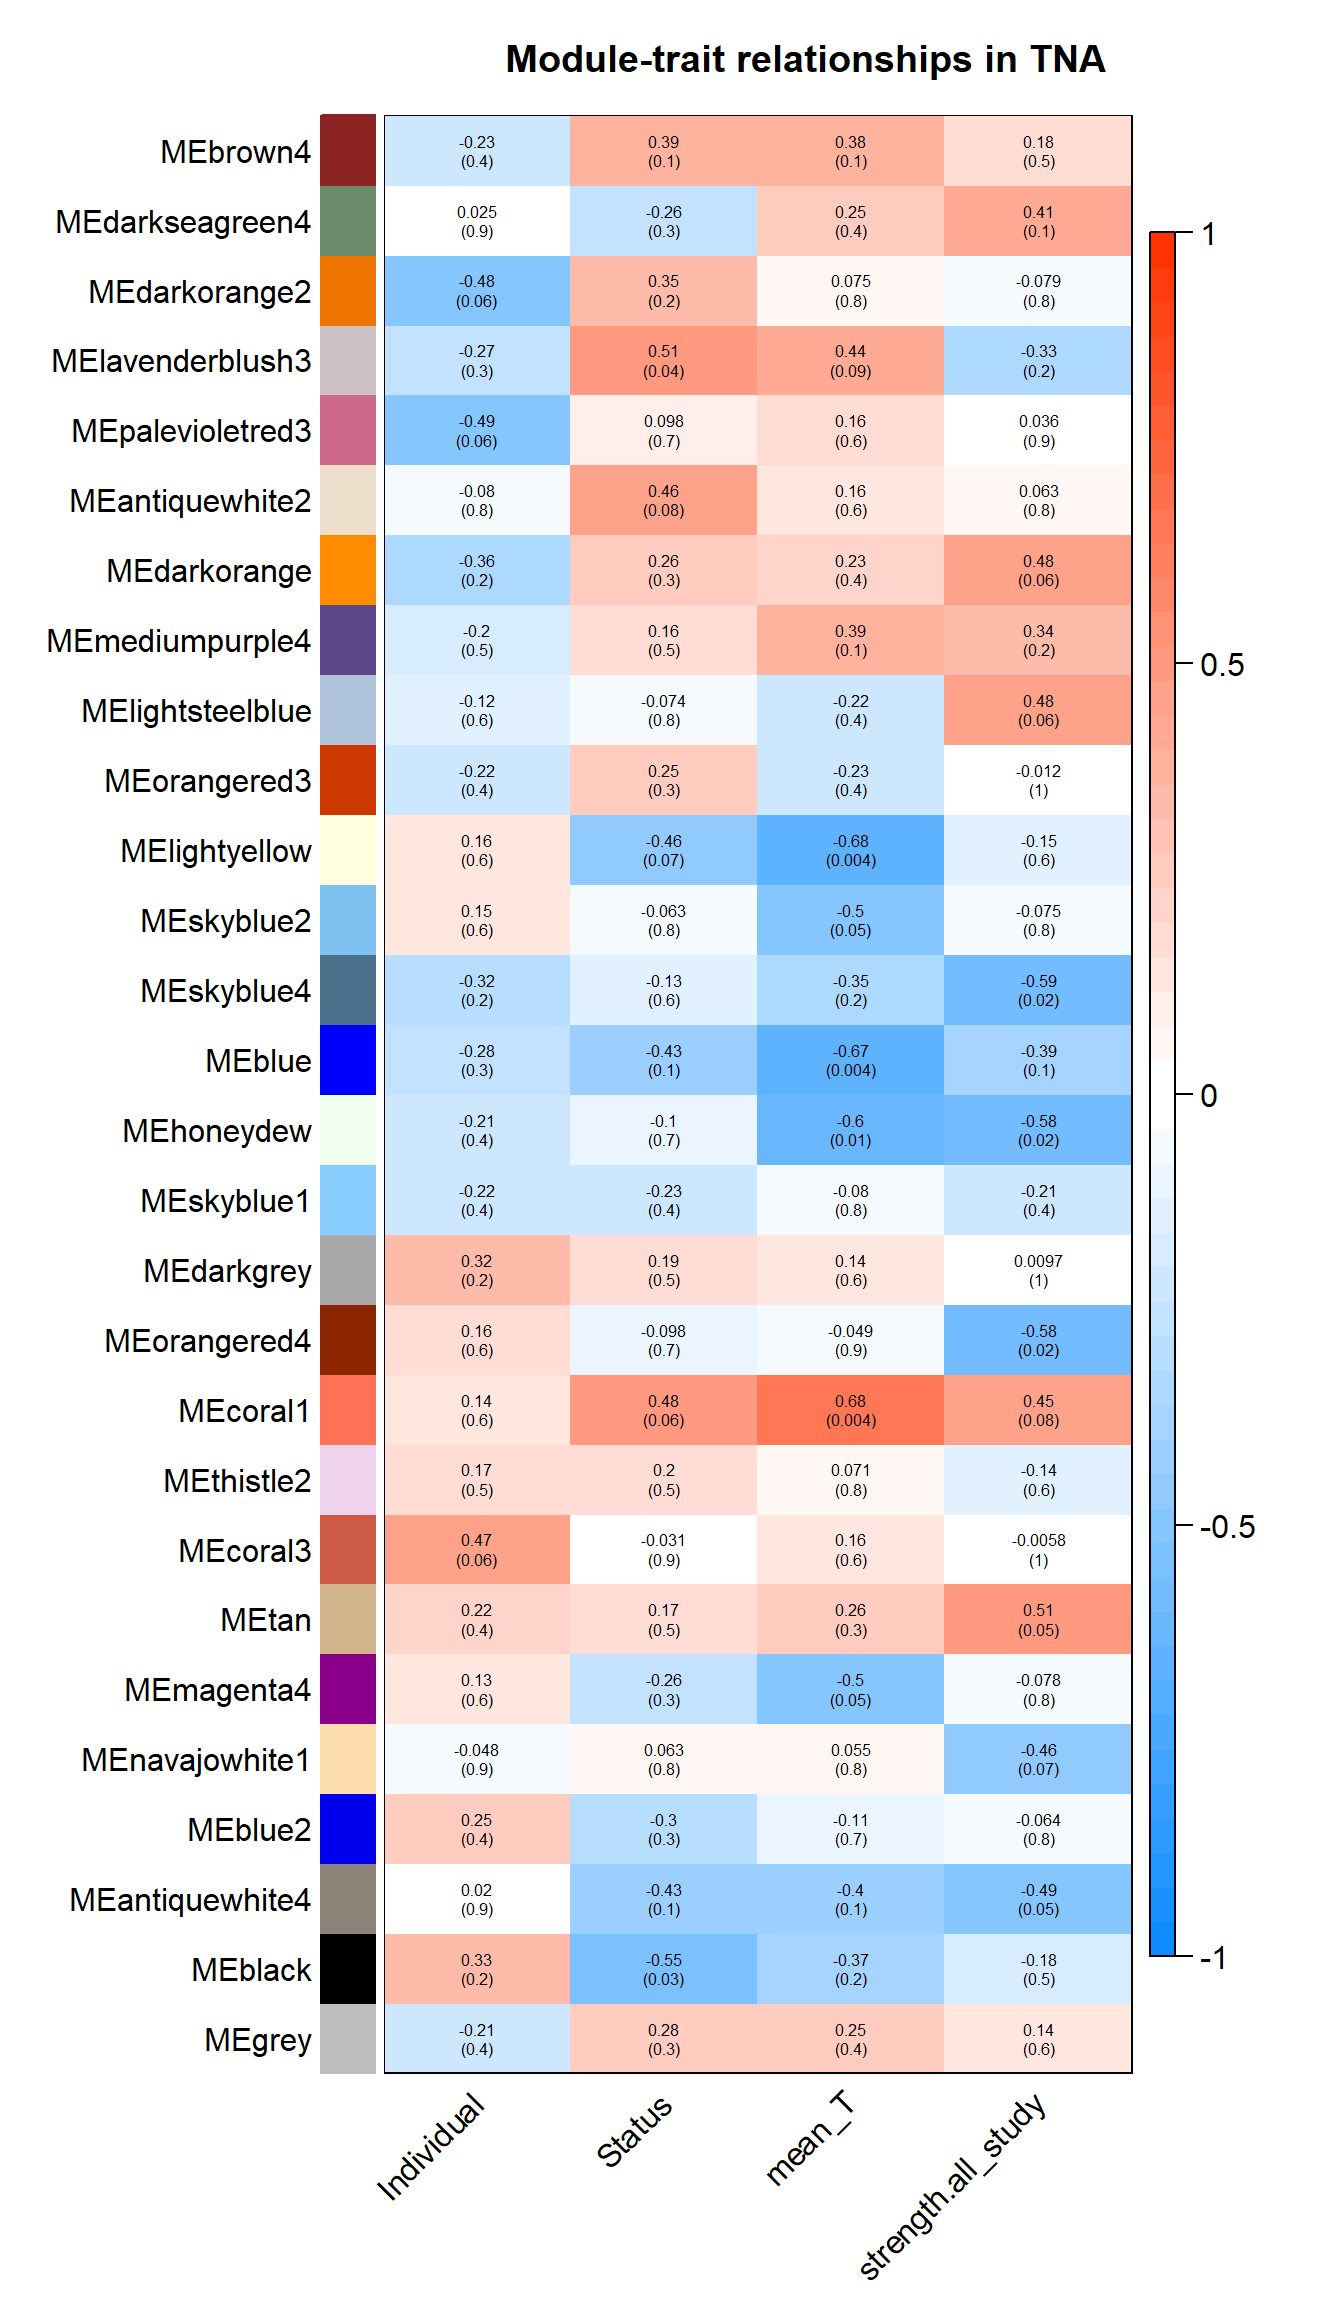
Based on inspection of the module memberships it seems that coral1 is the inverse of blue and/or lightyellow
9.1 Interesting Modules
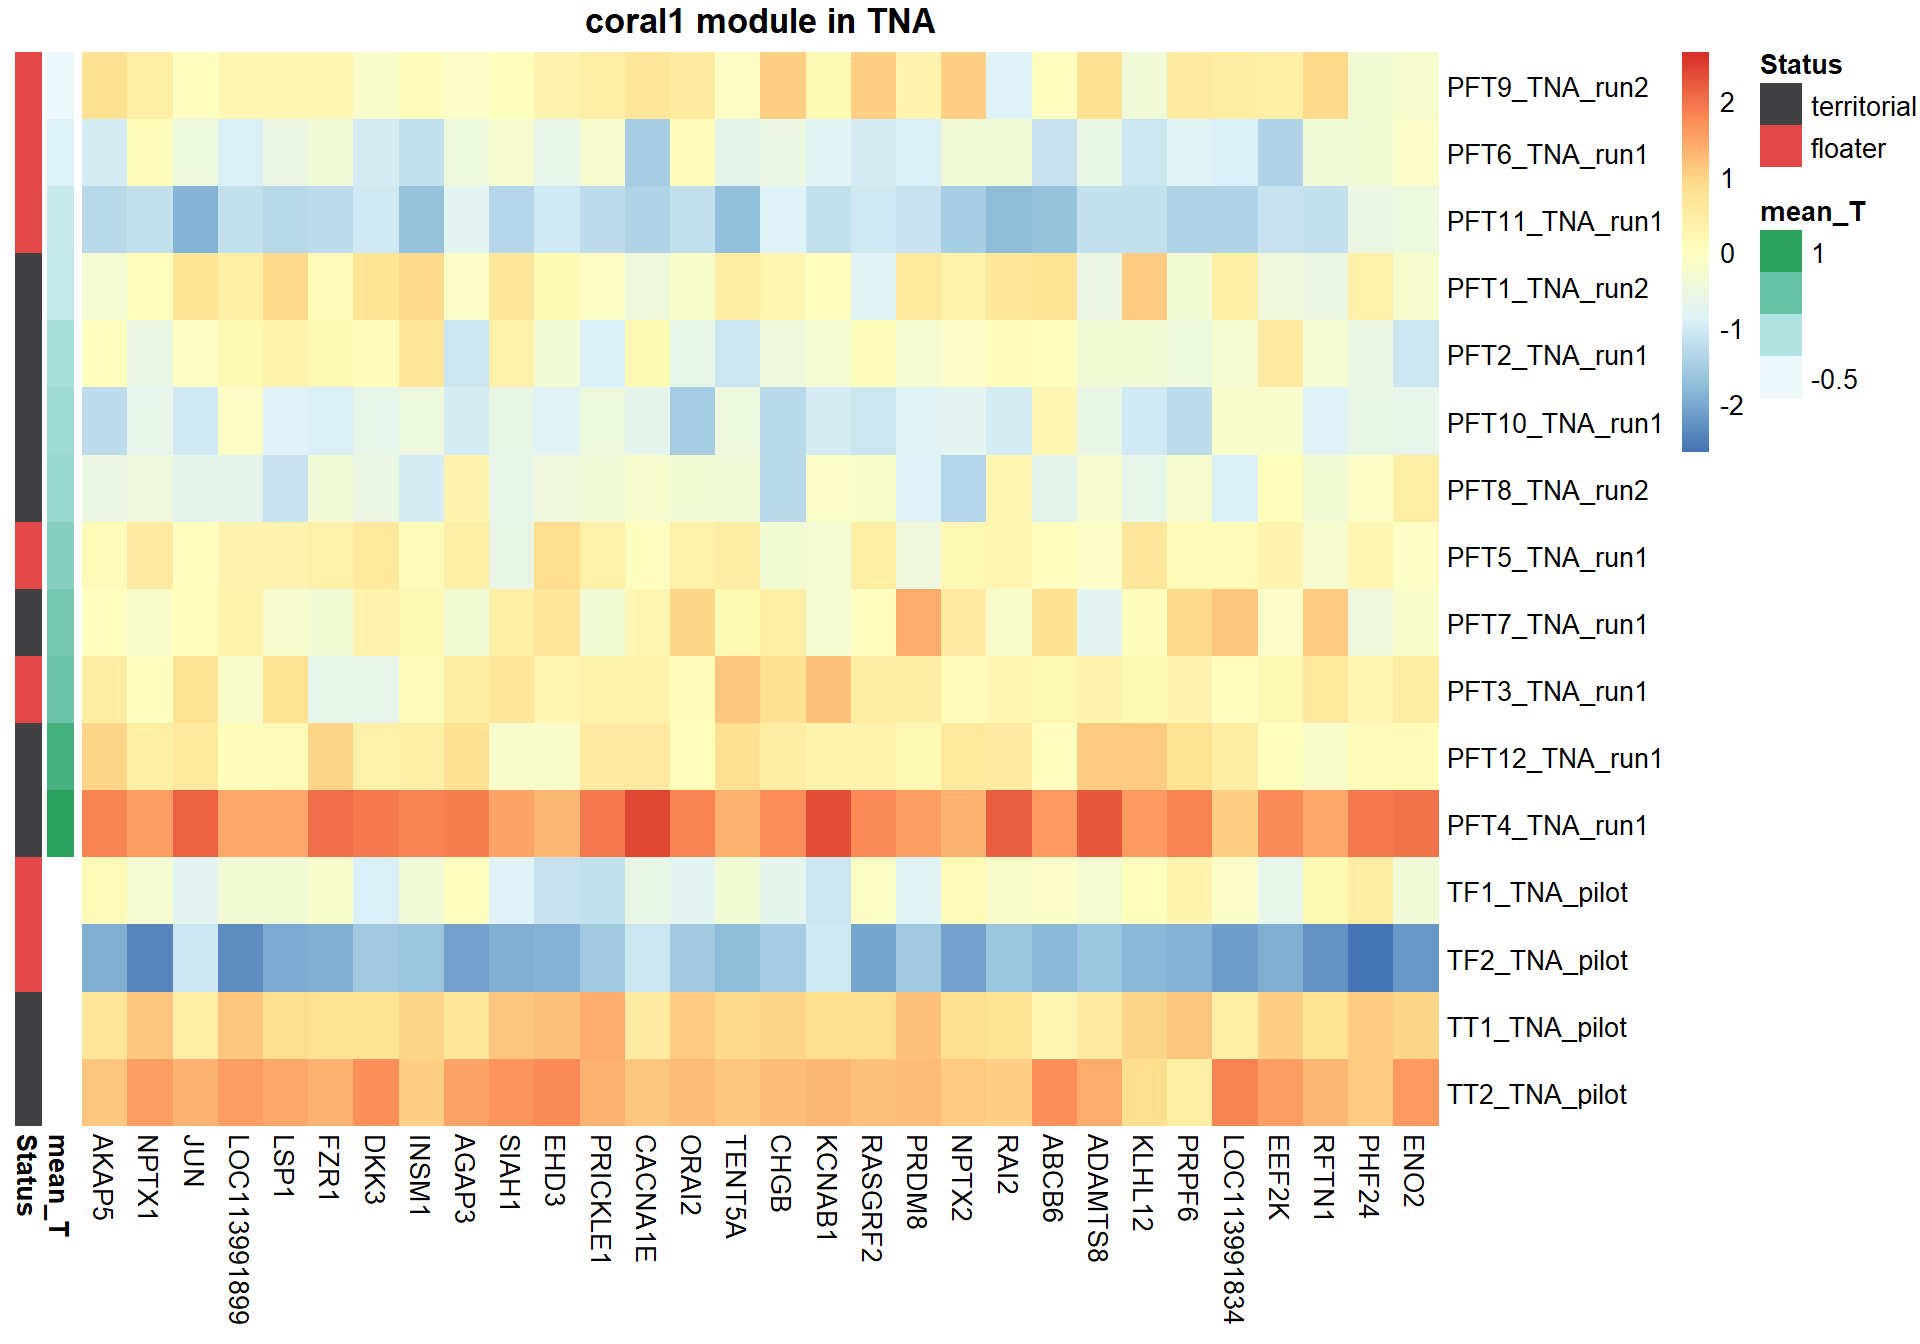
9.1.1 coral1 - mean testosterone
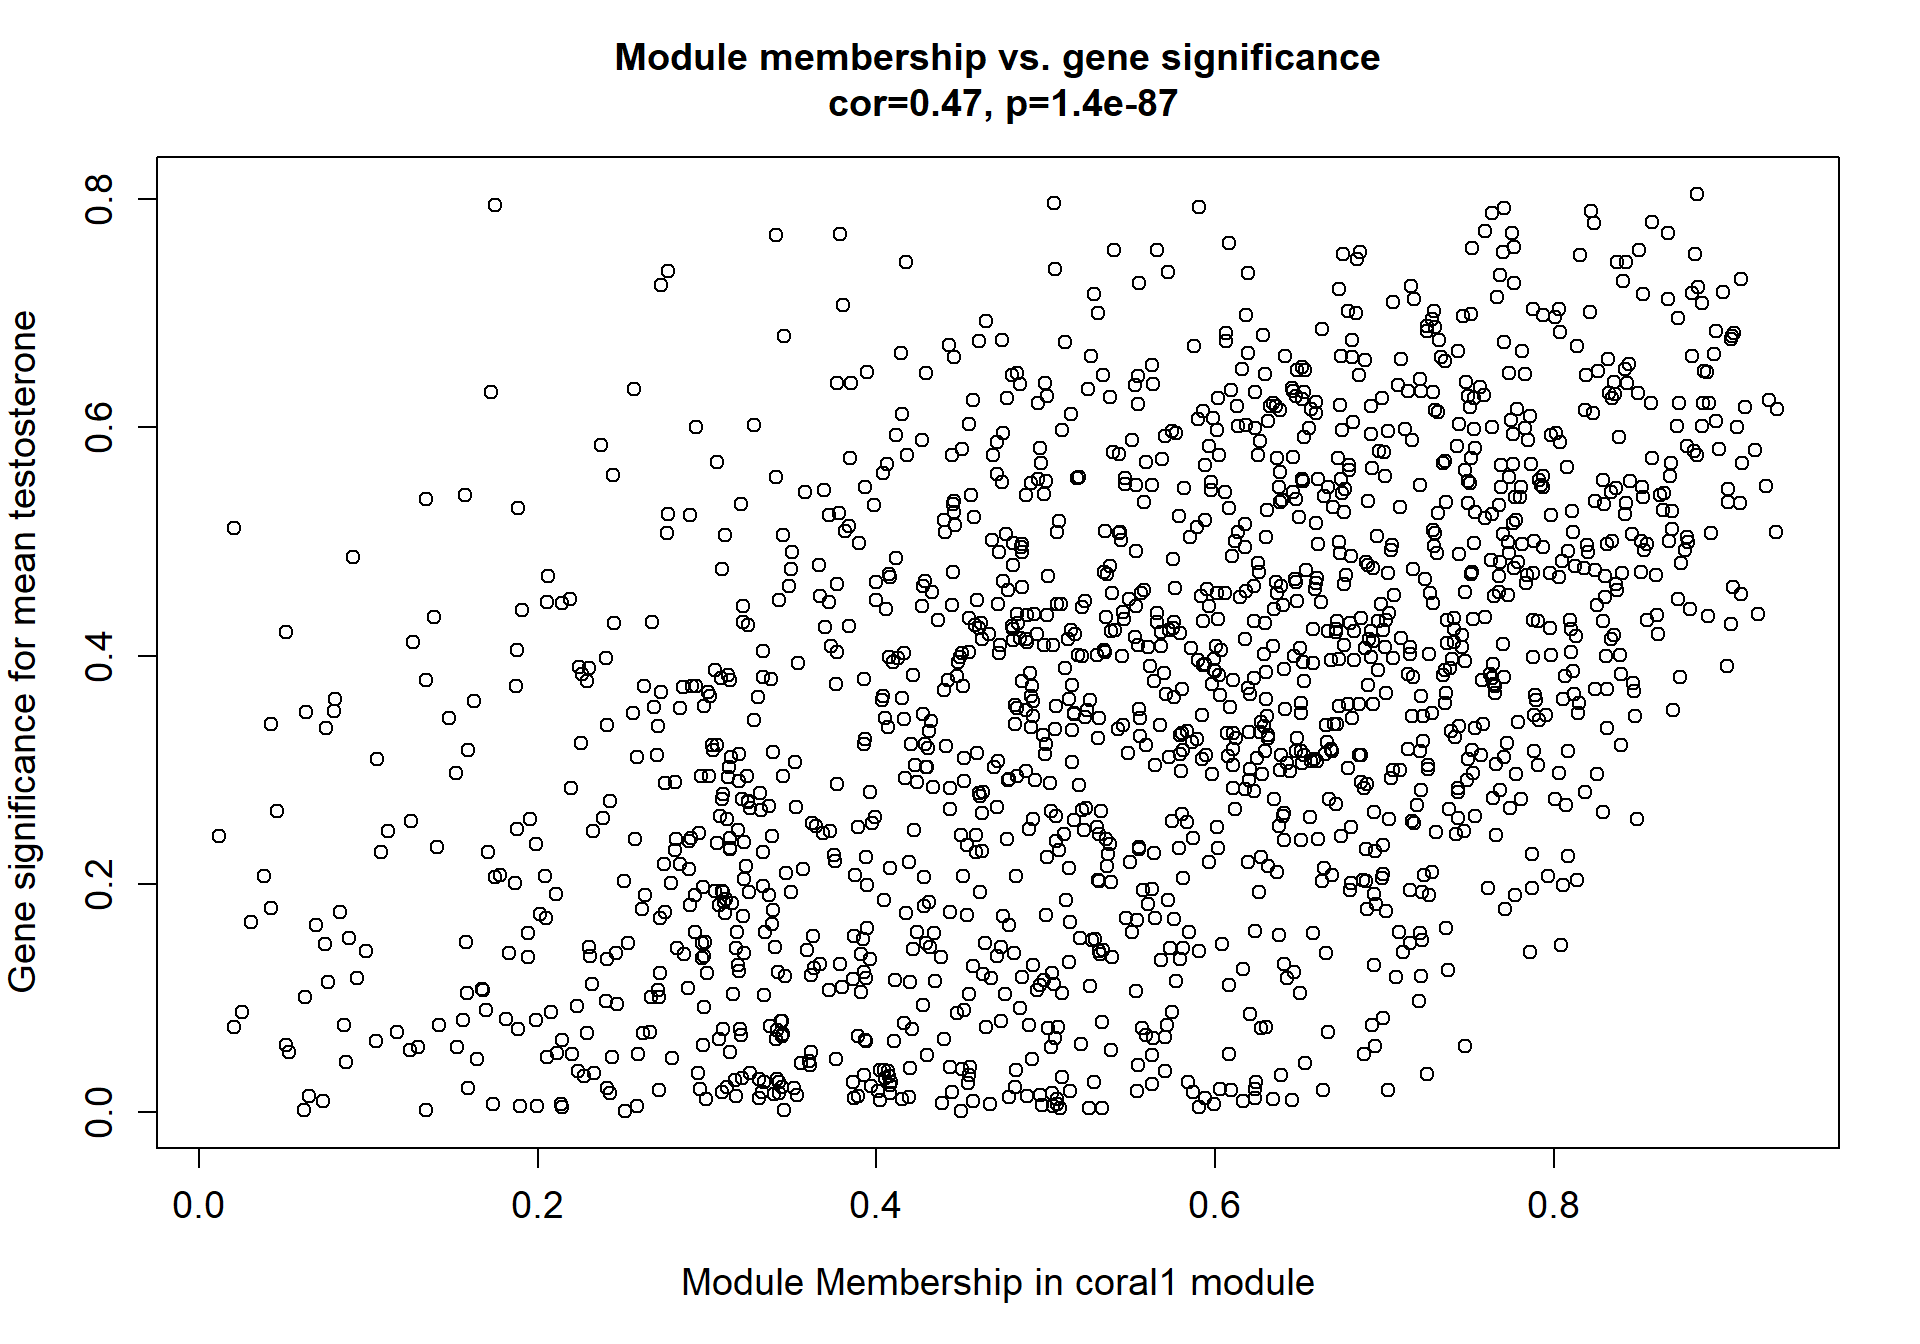
9.1.1.1 Gene Ontology
| ID | Description | GeneRatio | BgRatio | pvalue | p.adjust | qvalue | geneID | Count |
|---|---|---|---|---|---|---|---|---|
| GO:0001755 | neural crest cell migration | 16/1250 | 45/11978 | 0.0000062 | 0.0122582 | 0.0122582 | ACVR1/ALX1/ARTN/EDN3/EFNB1/LOC113982696/LOC113984504/LOC113988059/RADIL/SEMA3B/SEMA4A/SEMA4B/SEMA4D/SEMA4G/SHH/SOX8 | 16 |
| GO:0007411 | axon guidance | 41/1250 | 208/11978 | 0.0000432 | 0.0429695 | 0.0429695 | ARTN/B3GNT2/BMP7/DOK5/DRAXIN/EFNA1/EFNB1/EPHA1/GAB2/GFRA3/GPC1/LGI1/LOC113982696/LOC113983904/LOC113984118/LOC113984504/LOC113988059/LOC113990338/LRTM2/MAPK7/NEO1/NEXN/NPTN/NRP2/NTN4/PALLD/RAP1GAP/SEMA3B/SEMA4A/SEMA4B/SEMA4D/SEMA4G/SHC3/SHH/SIAH1/SLIT2/SRC/TUBB3/UNC5A/VLDLR/VSTM2L | 41 |
| GO:0098962 | regulation of postsynaptic neurotransmitter receptor activity | 8/1250 | 18/11978 | 0.0002306 | 0.1476696 | 0.1476696 | BEGAIN/CACNG4/DLGAP3/LOC113982730/LOC114000047/NPTX1/NPTX2/SRC | 8 |
| GO:0050919 | negative chemotaxis | 12/1250 | 38/11978 | 0.0003237 | 0.1476696 | 0.1476696 | LOC113982696/LOC113984504/LOC113988059/LRTM2/NRP2/PDGFA/SEMA3B/SEMA4A/SEMA4B/SEMA4D/SEMA4G/SLIT2 | 12 |
| GO:0035195 | gene silencing by miRNA | 6/1250 | 11/11978 | 0.0003710 | 0.1476696 | 0.1476696 | CNOT6/CNOT8/EIF6/LIMD1/MOV10L1/WTIP | 6 |
| GO:0007267 | cell-cell signaling | 26/1250 | 130/11978 | 0.0008199 | 0.2719451 | 0.2719451 | ADORA2A/ADRA1A/BMP2/CCN5/CX3CL1/DHH/ECE2/EDN3/EFNA1/EFNB1/ESR2/FGF18/FGFBP2/GJA5/GPNMB/GUCA1B/INHBA/LOC113988059/LOC113991921/LOC113992470/LOC113993120/PDGFA/POMC/SEMA3B/SHH/SSTR3 | 26 |
| GO:0071470 | cellular response to osmotic stress | 6/1250 | 13/11978 | 0.0011461 | 0.3258145 | 0.3258145 | LOC113991483/LOC113991484/LOC113991485/LOC113991486/LOC114001824/PKD2 | 6 |
| GO:0009880 | embryonic pattern specification | 7/1250 | 18/11978 | 0.0014951 | 0.3305788 | 0.3305788 | BMP7/EFNB1/RIPPLY2/SATB2/SHH/SMAD3/ZBTB16 | 7 |
| GO:0055074 | calcium ion homeostasis | 7/1250 | 18/11978 | 0.0014951 | 0.3305788 | 0.3305788 | CAMK2N1/CIB2/FAM20A/KL/LOC114004119/SNCA/TNFSF11 | 7 |
| GO:0051764 | actin crosslink formation | 5/1250 | 10/11978 | 0.0019733 | 0.3926931 | 0.3926931 | BAIAP2/DPYSL3/GAS2/GAS2L1/MARCKS | 5 |
## preparing gene to GO mapping data...## preparing IC data...## Warning in if (class(try(col2rgb(palette), silent = TRUE)) == "try-error")
## stop("color palette is not correct"): the condition has length > 1 and only the
## first element will be used
9.1.2 blue - mean testosterone
9.1.2.1 Gene Ontology
| ID | Description | GeneRatio | BgRatio | pvalue | p.adjust | qvalue | geneID | Count |
|---|---|---|---|---|---|---|---|---|
| GO:0006120 | mitochondrial electron transport, NADH to ubiquinone | 17/1486 | 38/11978 | 0.0000008 | 0.0016443 | 0.0016443 | NDUFA1/NDUFA11/NDUFA4/NDUFA4L2/NDUFA5/NDUFAF1/NDUFB11/NDUFB3/NDUFB4/NDUFB5/NDUFB7/NDUFS1/NDUFS4/NDUFS5/NDUFS6/NDUFS8/NDUFV3 | 17 |
| GO:0032981 | mitochondrial respiratory chain complex I assembly | 18/1486 | 49/11978 | 0.0000113 | 0.0118183 | 0.0118183 | ACAD9/ECSIT/LOC113987270/NDUFA1/NDUFA11/NDUFA5/NDUFAF1/NDUFB11/NDUFB3/NDUFB4/NDUFB5/NDUFB7/NDUFS1/NDUFS4/NDUFS5/NDUFS6/NDUFS8/NDUFV3 | 18 |
| GO:0048013 | ephrin receptor signaling pathway | 25/1486 | 92/11978 | 0.0000975 | 0.0679597 | 0.0679597 | ACTB/ACTR2/ACTR3/ARPC1A/ARPC1B/ARPC2/ARPC5/CDC42/EPHA4/EPHA8/EPHB2/EPHB3/GIT1/HCK/KALRN/LOC113993801/LOC113998953/NCK2/NCSTN/NGEF/RAC1/RHOA/SDC2/SS18/WASL | 25 |
| GO:0034314 | Arp2/3 complex-mediated actin nucleation | 8/1486 | 15/11978 | 0.0001580 | 0.0825658 | 0.0825658 | ACTR2/ACTR3/ARPC1A/ARPC1B/ARPC2/ARPC5/ARPC5L/WHAMM | 8 |
| GO:1902600 | proton transmembrane transport | 21/1486 | 75/11978 | 0.0002186 | 0.0913576 | 0.0913576 | ATP12A/ATP2C1/ATP5MF/ATP6AP1L/ATP6V0B/ATP6V0E1/ATP6V1E1/HVCN1/LOC113983953/LOC113984288/LOC113985114/LOC113985195/LOC113985992/LOC114000835/LOC114003365/NDUFA4/NDUFA4L2/SLC17A5/SLC25A27/SLC2A10/SLC9A1 | 21 |
| GO:0035970 | peptidyl-threonine dephosphorylation | 9/1486 | 20/11978 | 0.0003162 | 0.1101596 | 0.1101596 | DUSP4/DUSP5/DUSP6/DUSP7/LOC113997232/PPM1A/PPM1B/PPM1E/PPP2CA | 9 |
| GO:0043687 | post-translational protein modification | 55/1486 | 285/11978 | 0.0005068 | 0.1513247 | 0.1513247 | ANKRD9/APP/ASB1/ASB16/ASB7/BMP4/BTBD6/C3/CCN1/COP1/COPS5/COPS7A/CP/DCAF13/DCAF17/DCUN1D1/ELOC/EVA1A/FBXL5/FBXL7/FBXO22/FBXO32/FBXO9/FUCA2/IGFBP7/KLHL13/KLHL20/KLHL42/LAMC1/LOC113984874/LOC113987294/LOC113992168/LOC113999119/LOC113999601/MIA3/NUB1/PROC/PSMA1/PSMA3/PSMA4/PSMA7/PSMD10/PSMD11/PSME4/RAB2A/RAB5A/RBBP7/SCG2/SDC2/SKP1/SKP2/SOCS3/SPSB4/UBE2F/UBE2M | 55 |
| GO:0043401 | steroid hormone mediated signaling pathway | 8/1486 | 18/11978 | 0.0007617 | 0.1665755 | 0.1665755 | BMP4/GPER1/LEF1/NR2E1/NR4A3/PAQR7/PGRMC2/PPARD | 8 |
| GO:0008277 | regulation of G protein-coupled receptor signaling pathway | 14/1486 | 45/11978 | 0.0007642 | 0.1665755 | 0.1665755 | ADCYAP1/GIT1/HOMER2/LOC114003843/PDCL/RGS11/RGS12/RGS14/RGS16/RGS2/RGS4/RGS5/ZDHHC3/ZDHHC7 | 14 |
| GO:0002281 | macrophage activation involved in immune response | 6/1486 | 11/11978 | 0.0009564 | 0.1665755 | 0.1665755 | IFI35/LOC113985745/LOC113986453/LOC113994309/LOC113998967/NMI | 6 |
## preparing gene to GO mapping data...## preparing IC data...## Warning in if (class(try(col2rgb(palette), silent = TRUE)) == "try-error")
## stop("color palette is not correct"): the condition has length > 1 and only the
## first element will be used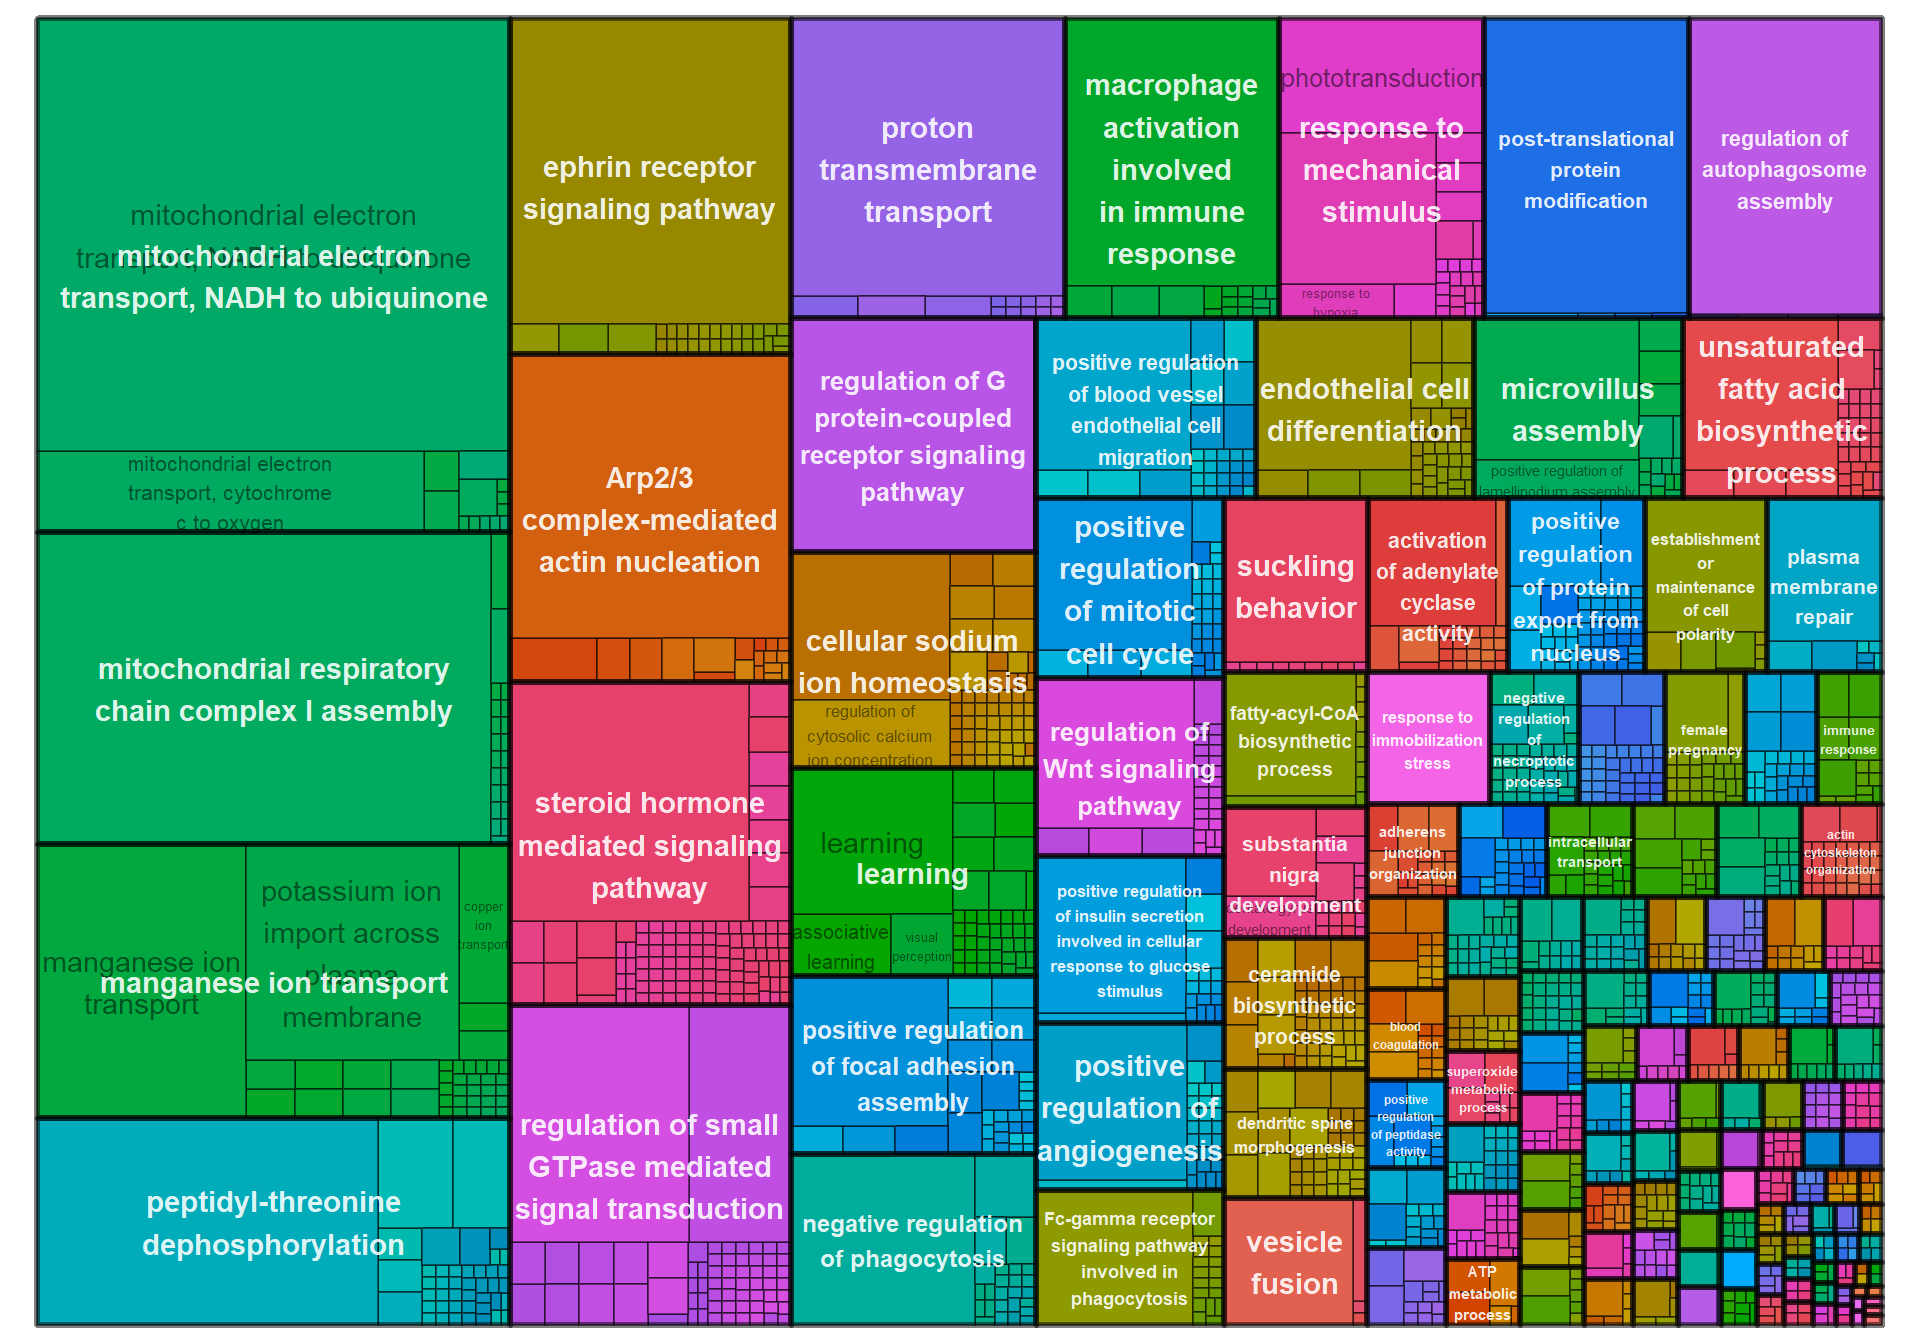
9.1.3 lightyellow - mean testosterone
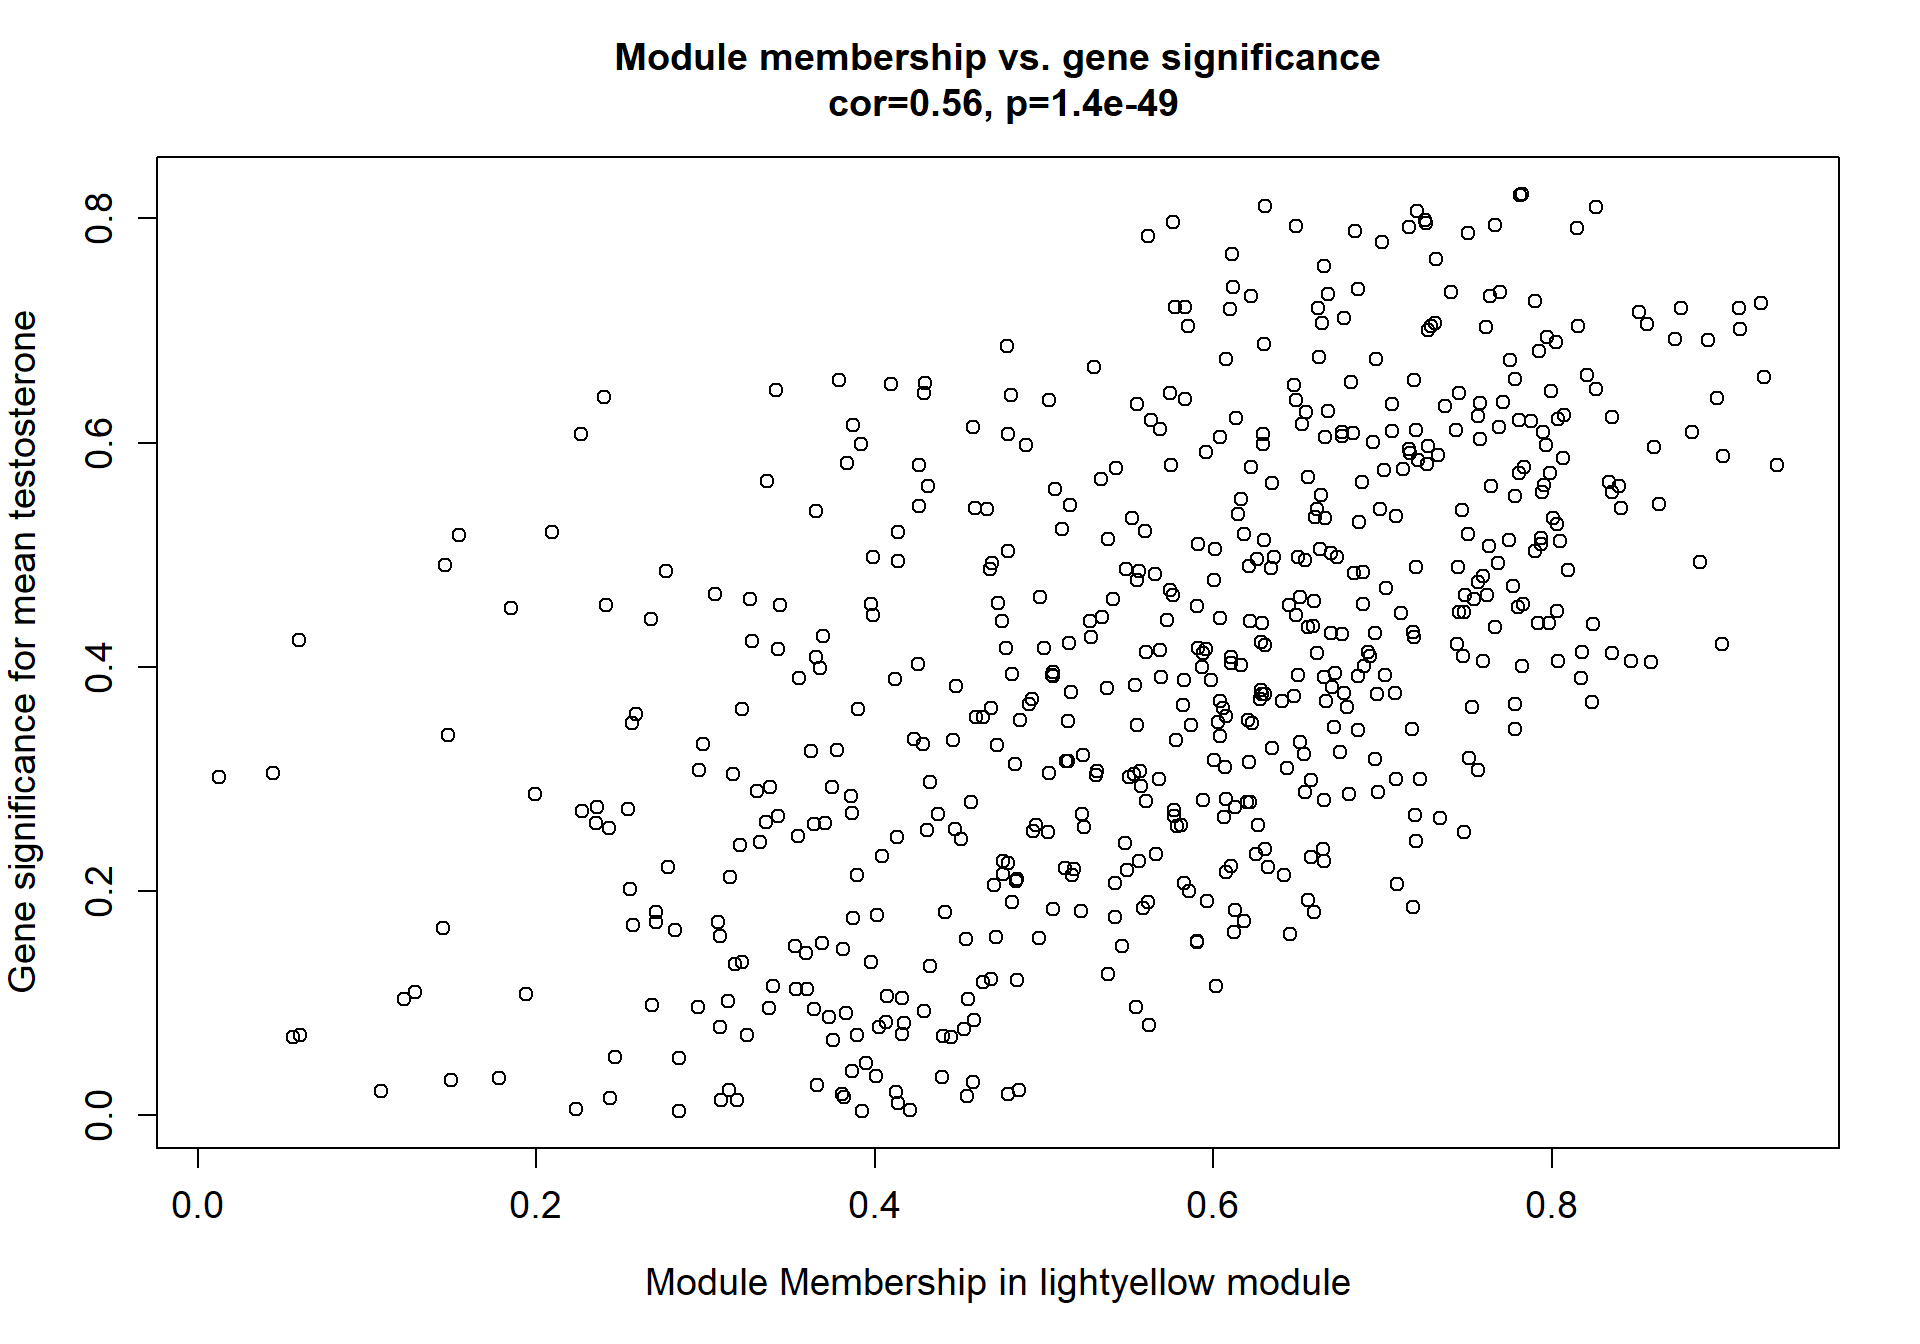
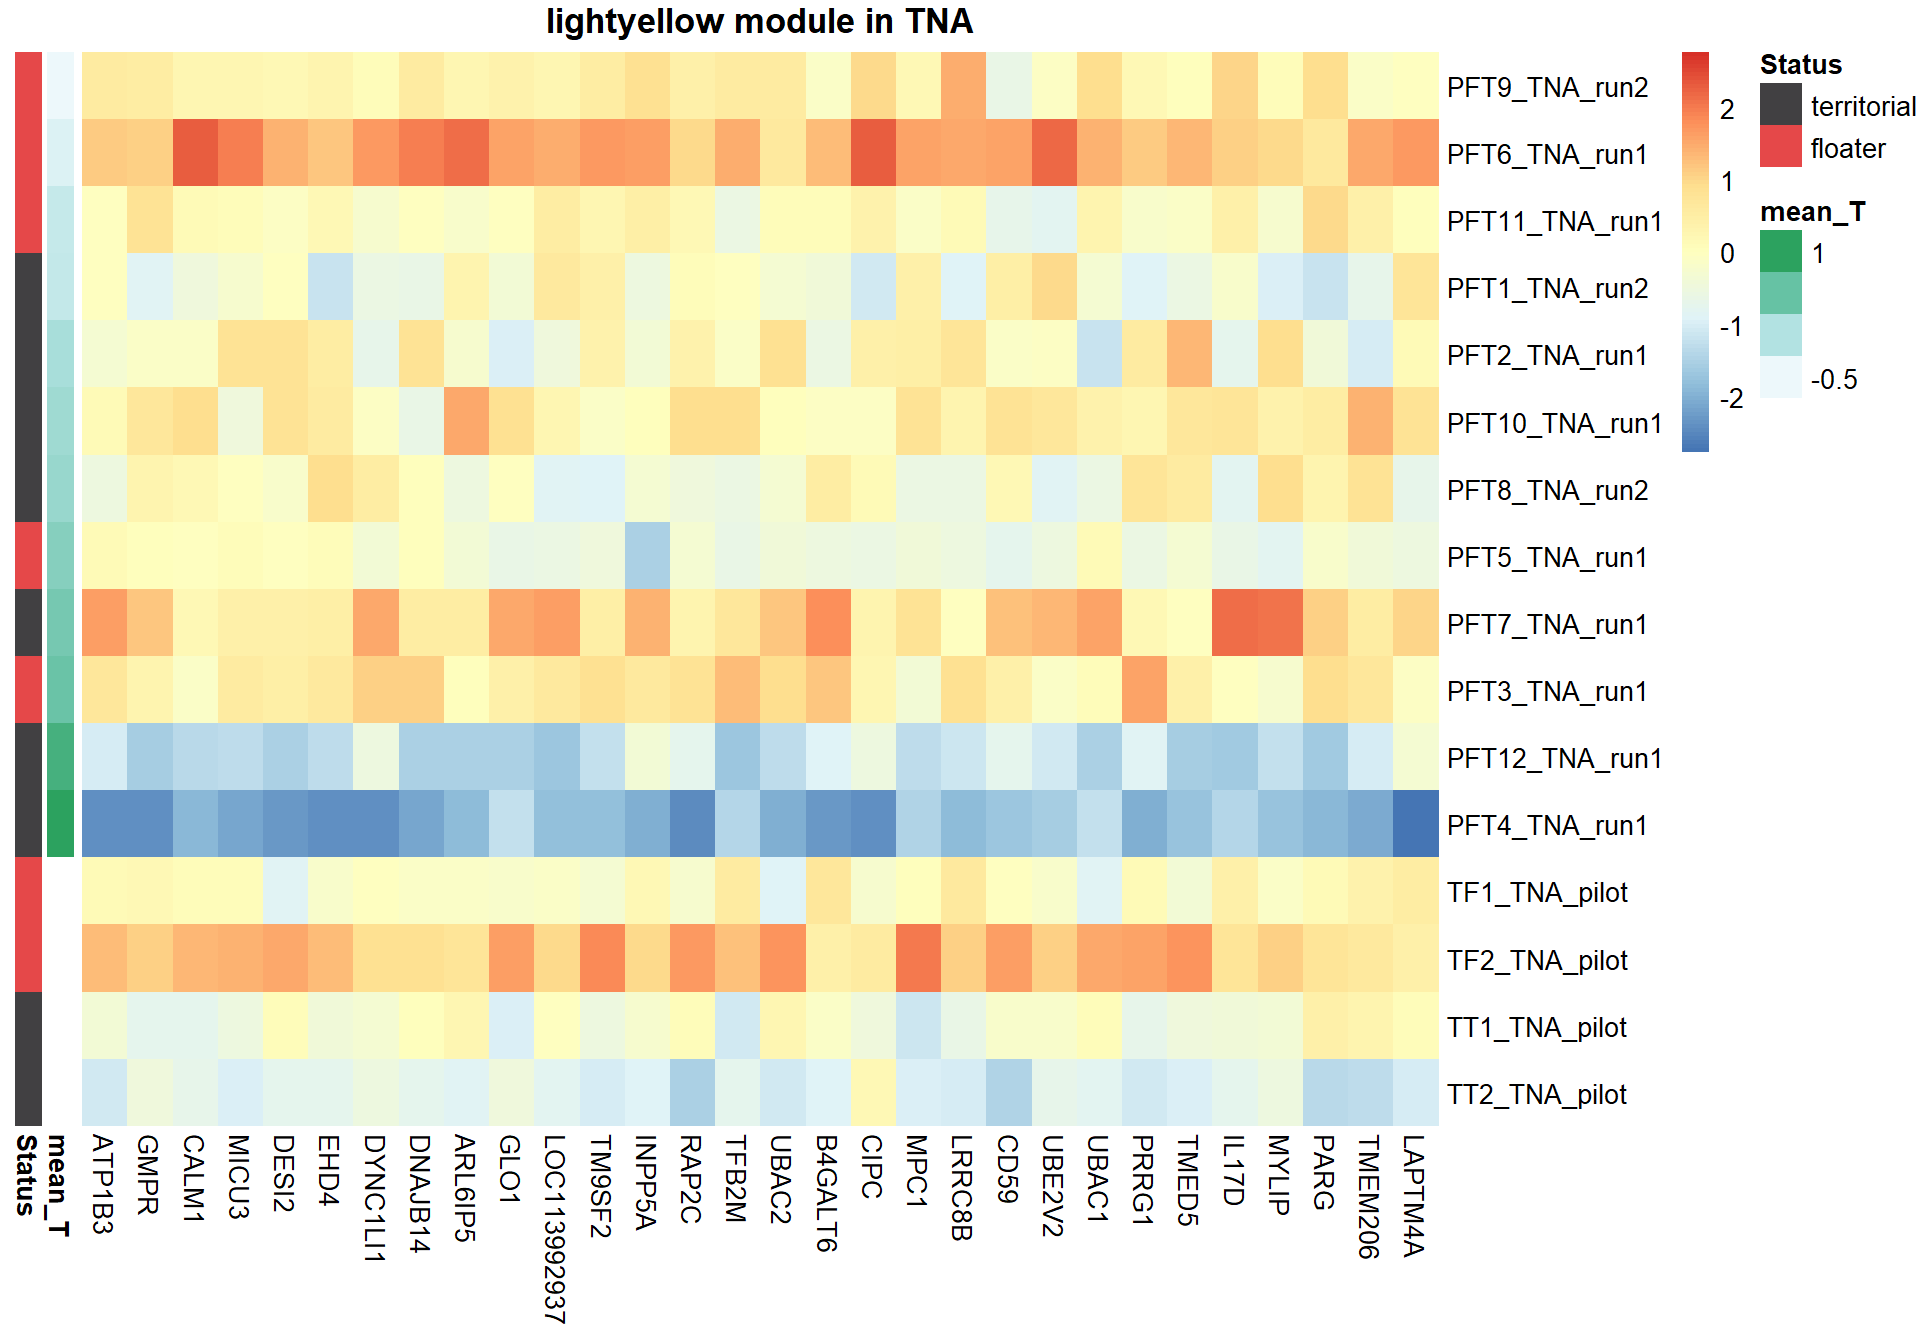
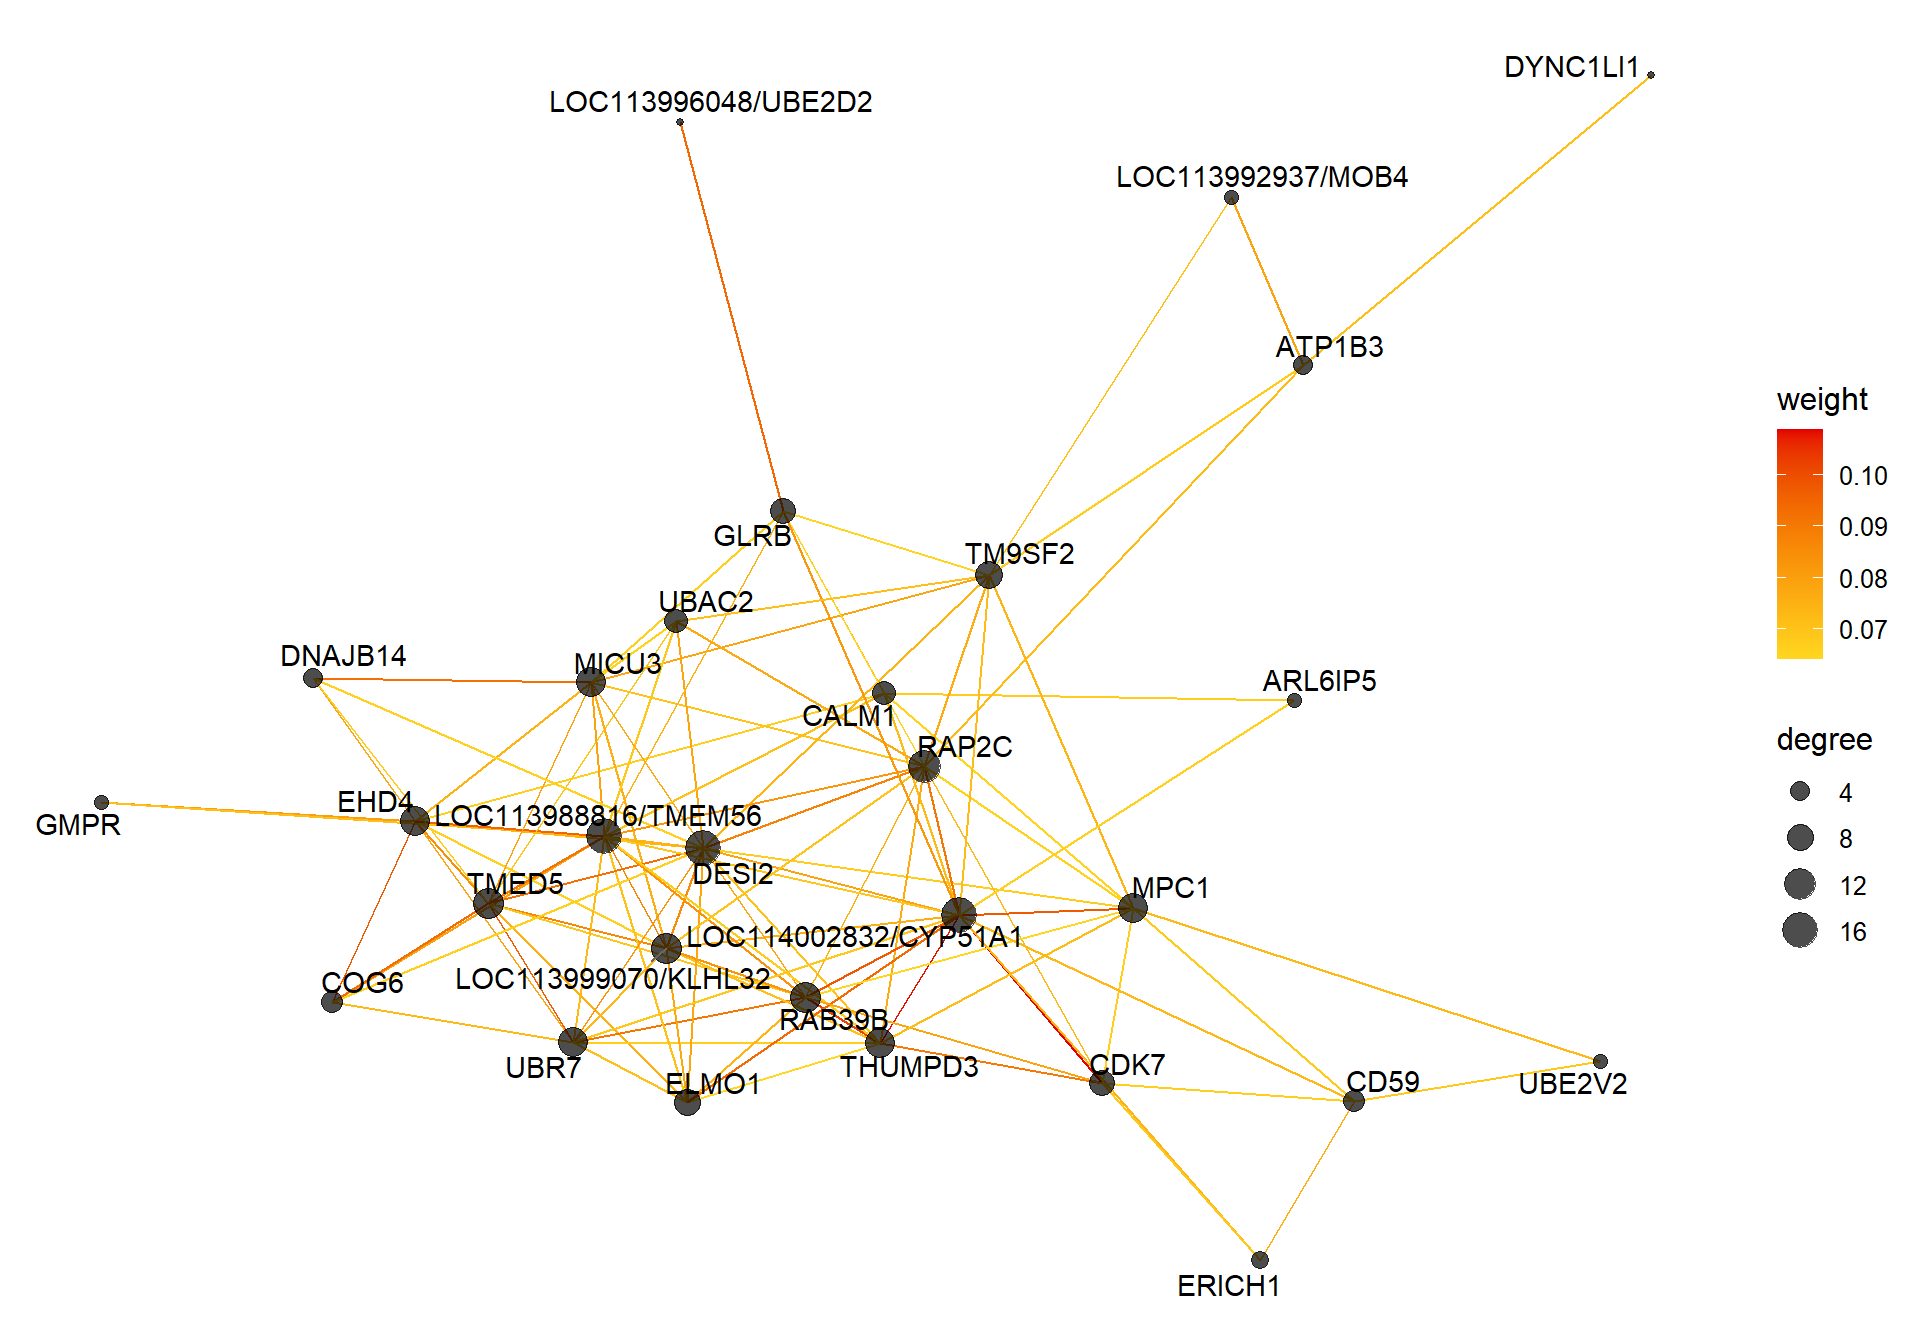
9.1.3.1 Gene Ontology
| ID | Description | GeneRatio | BgRatio | pvalue | p.adjust | qvalue | geneID | Count |
|---|---|---|---|---|---|---|---|---|
| GO:0006695 | cholesterol biosynthetic process | 10/504 | 34/11978 | 0.0000008 | 0.0011542 | 0.0011542 | FDFT1/HMGCR/HMGCS1/HSD17B7/INSIG1/INSIG2/LOC113987727/LOC114002832/MSMO1/SQLE | 10 |
| GO:0016126 | sterol biosynthetic process | 6/504 | 13/11978 | 0.0000072 | 0.0049447 | 0.0049447 | CH25H/HMGCR/INSIG1/INSIG2/MSMO1/SQLE | 6 |
| GO:0045540 | regulation of cholesterol biosynthetic process | 8/504 | 33/11978 | 0.0000509 | 0.0233422 | 0.0233422 | FDFT1/GPAM/HMGCR/HMGCS1/LOC113987727/LOC114002832/SQLE/SREBF2 | 8 |
| GO:0071404 | cellular response to low-density lipoprotein particle stimulus | 5/504 | 16/11978 | 0.0003839 | 0.1321546 | 0.1321546 | CD81/CD9/HMGCS1/PPARG/SREBF2 | 5 |
| GO:0033189 | response to vitamin A | 4/504 | 10/11978 | 0.0005311 | 0.1462786 | 0.1462786 | CAT/LOC113999589/LRAT/PPARG | 4 |
| GO:0006625 | protein targeting to peroxisome | 9/504 | 66/11978 | 0.0016812 | 0.3190921 | 0.3190921 | ACOX1/AGPS/CAT/DAO/GSTK1/LOC113996048/NUDT19/PEX26/UBE2D3 | 9 |
| GO:0019432 | triglyceride biosynthetic process | 4/504 | 14/11978 | 0.0022133 | 0.3190921 | 0.3190921 | ACSL4/GK/GPAM/LPIN2 | 4 |
| GO:2000009 | negative regulation of protein localization to cell surface | 4/504 | 14/11978 | 0.0022133 | 0.3190921 | 0.3190921 | LEPROT/LEPROTL1/PICALM/TAX1BP3 | 4 |
| GO:0006629 | lipid metabolic process | 11/504 | 96/11978 | 0.0022807 | 0.3190921 | 0.3190921 | ACOX1/ACSL4/CH25H/CRK/CRKL/HMGCS1/LCAT/LPIN2/PPARG/SREBF2/TTPA | 11 |
| GO:0035666 | TRIF-dependent toll-like receptor signaling pathway | 5/504 | 23/11978 | 0.0023173 | 0.3190921 | 0.3190921 | BIRC2/LOC113996048/TLR6/TRAF3/UBE2D3 | 5 |
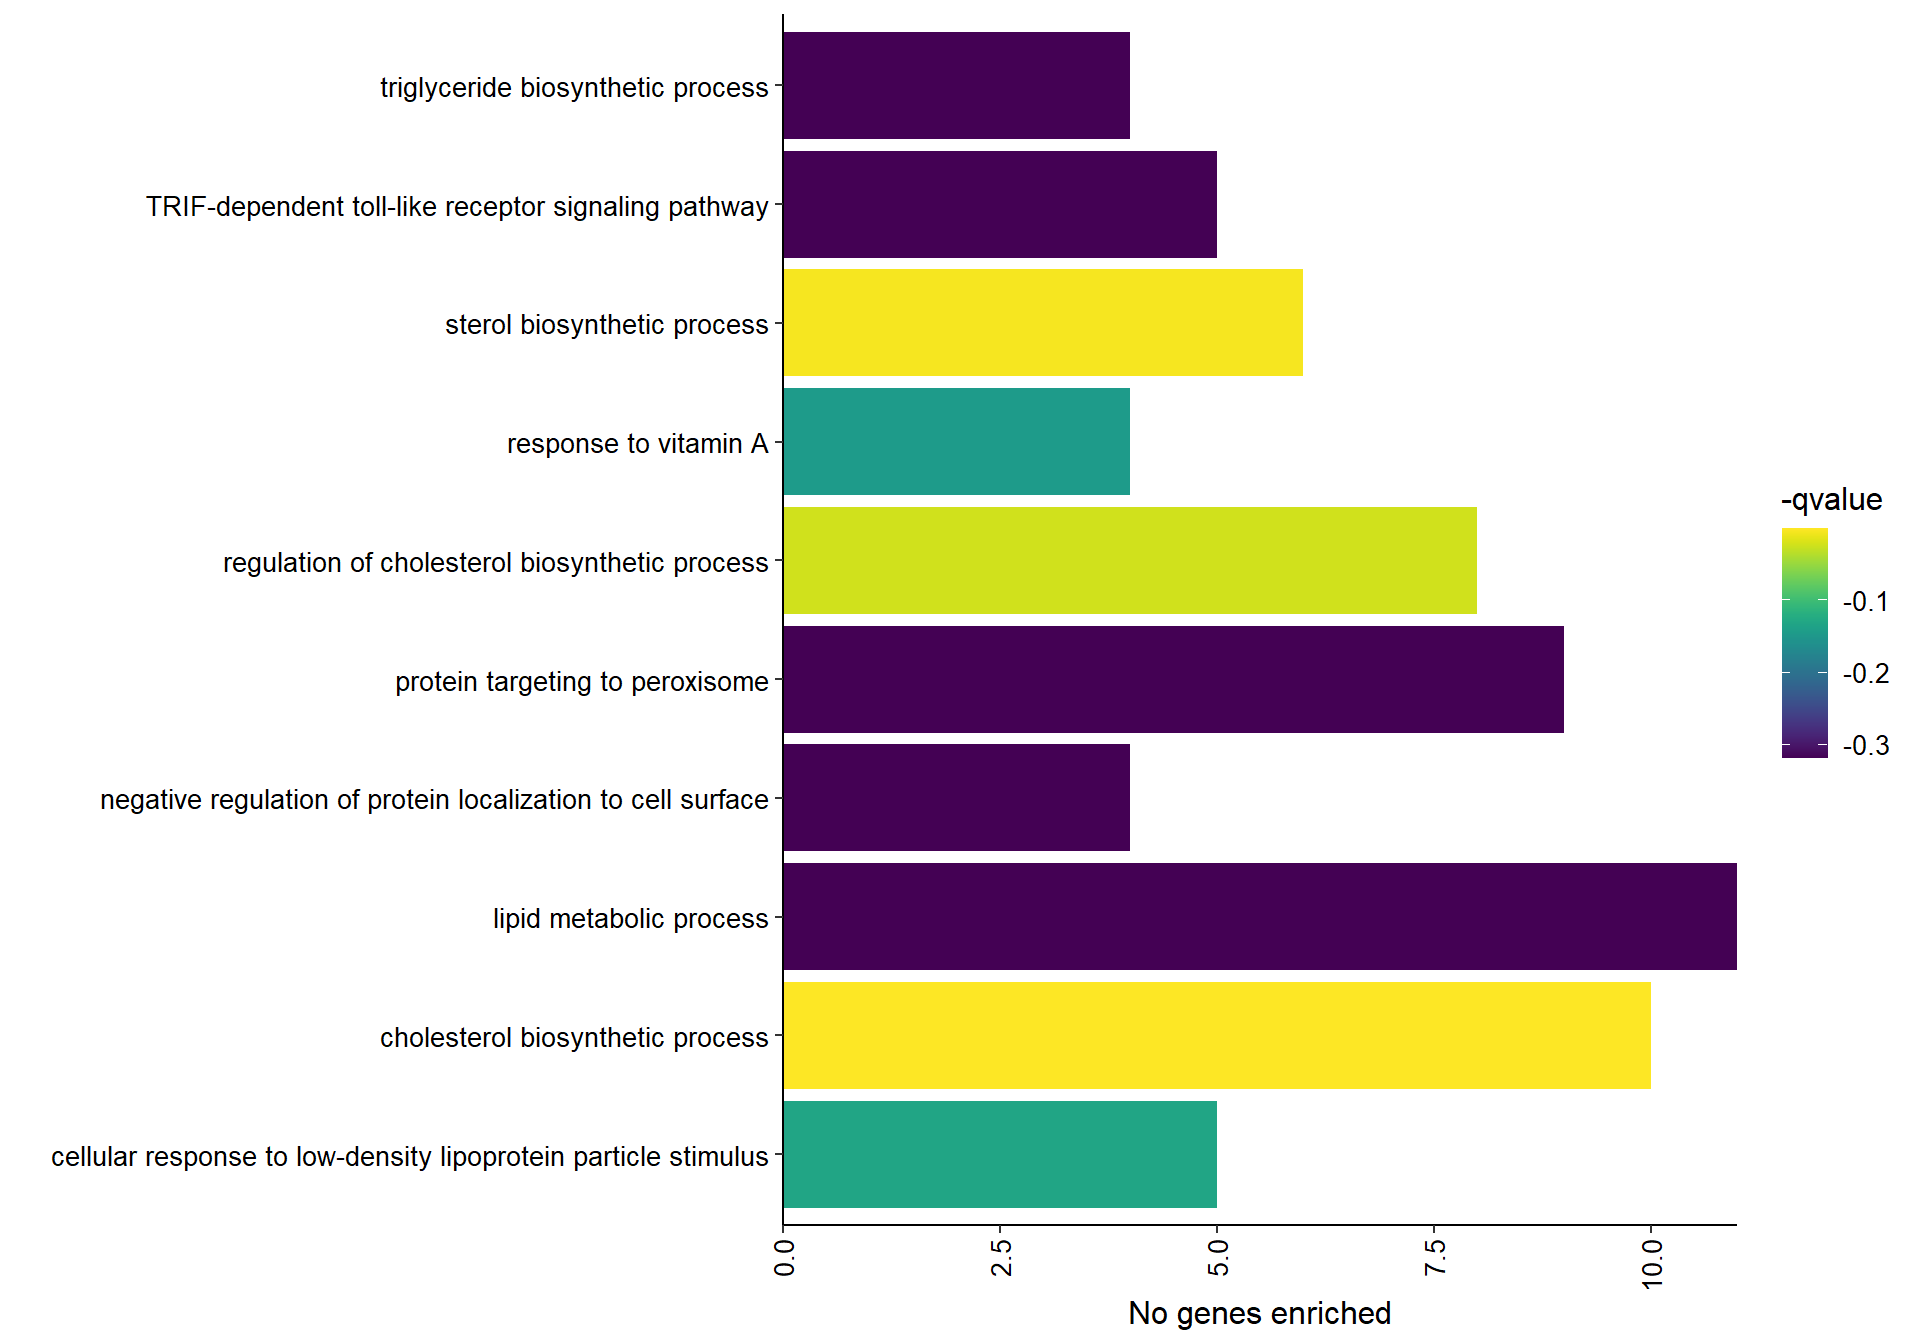
## preparing gene to GO mapping data...## preparing IC data...## Warning in if (class(try(col2rgb(palette), silent = TRUE)) == "try-error")
## stop("color palette is not correct"): the condition has length > 1 and only the
## first element will be used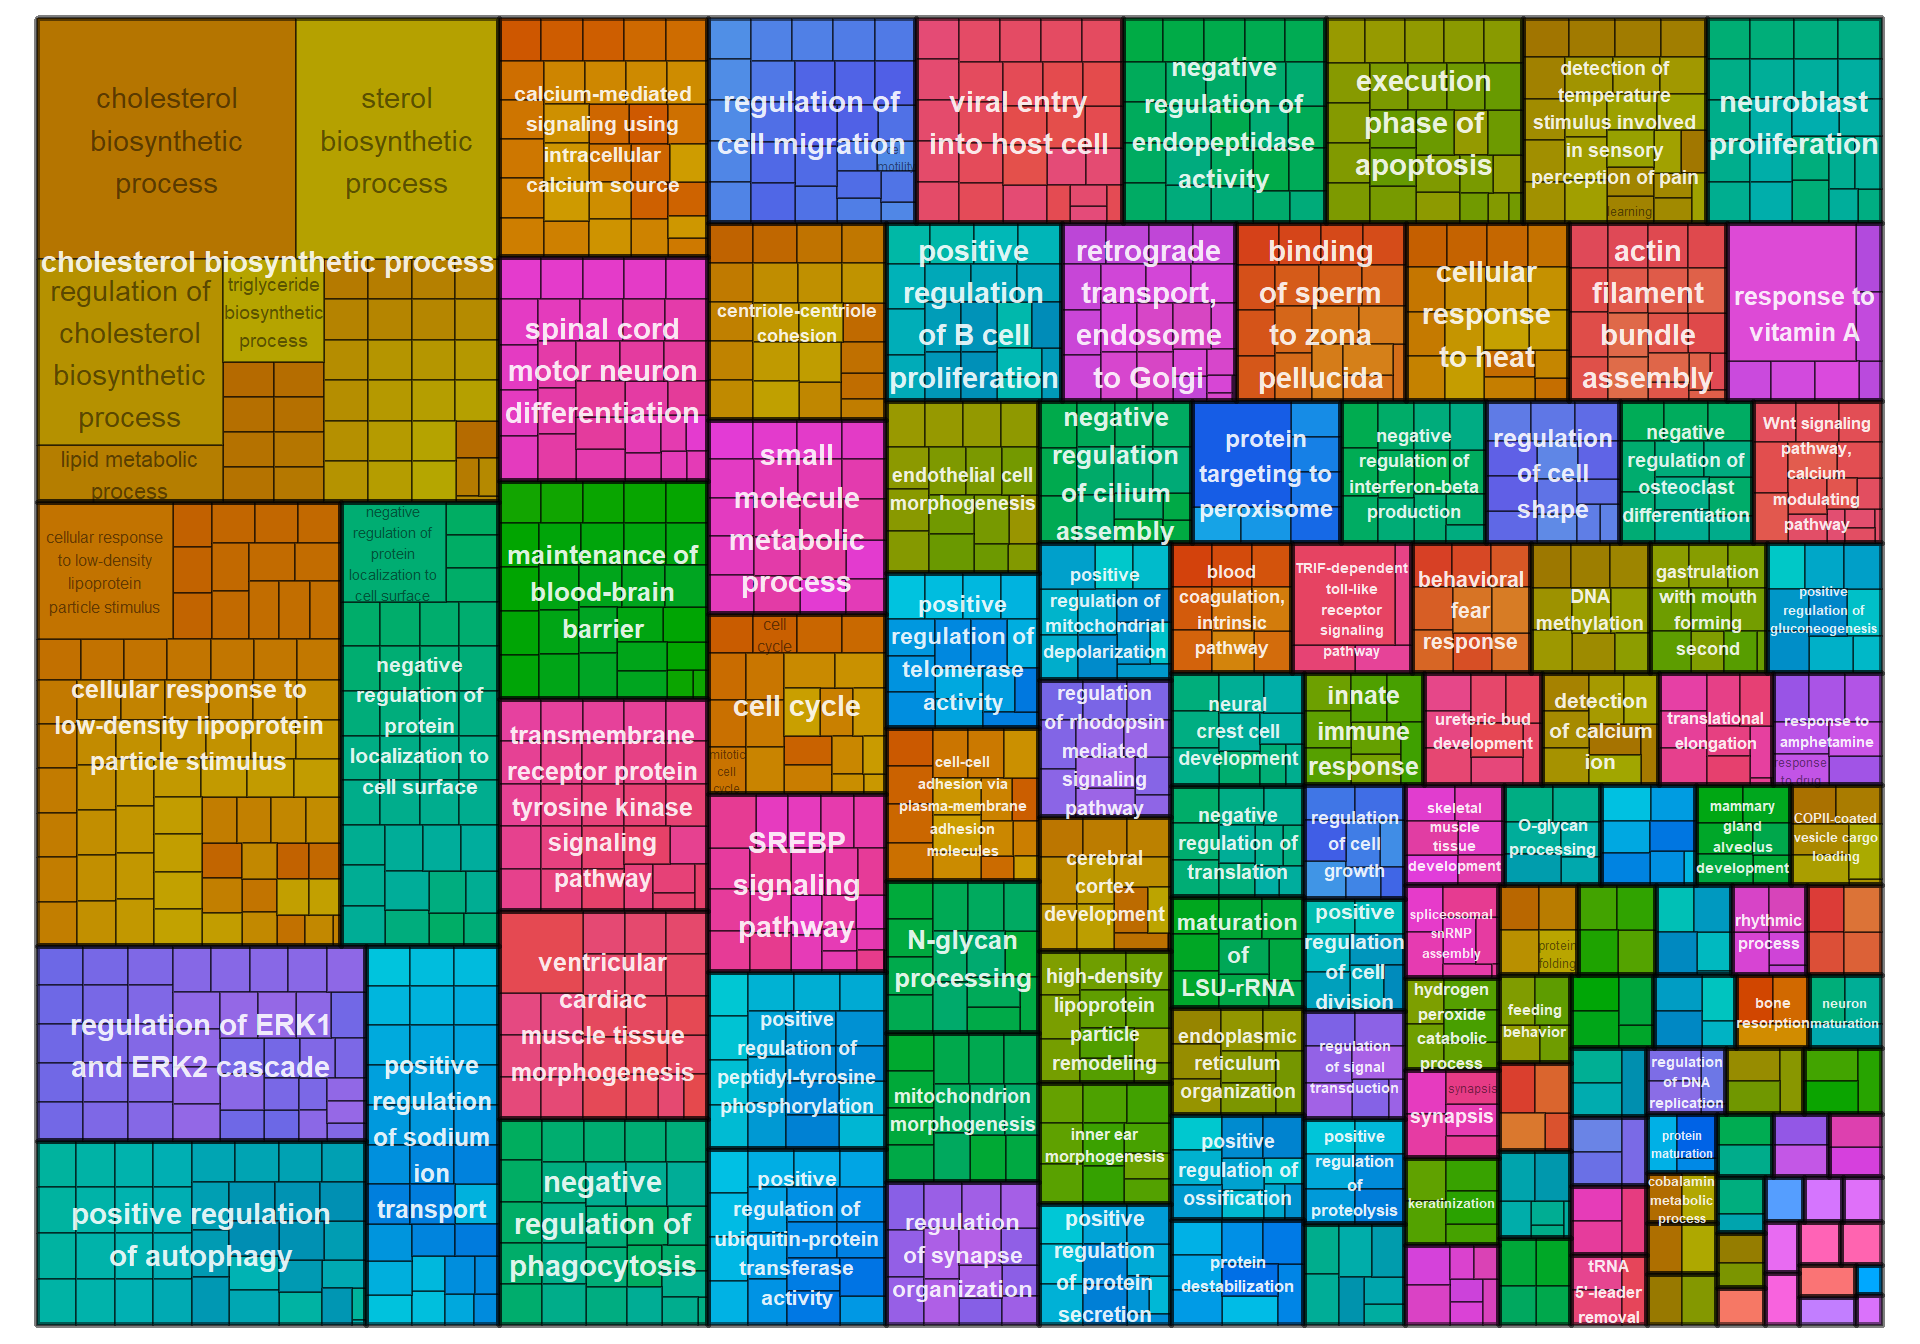
10 Arcopallium Intermedium (Ai)
## [1] 14598## Warning in DESeqDataSet(se, design = design, ignoreRank): some variables in
## design formula are characters, converting to factors## estimating size factors## estimating dispersions## gene-wise dispersion estimates## mean-dispersion relationship## final dispersion estimates## fitting model and testing## -- replacing outliers and refitting for 71 genes
## -- DESeq argument 'minReplicatesForReplace' = 7
## -- original counts are preserved in counts(dds)## estimating dispersions## fitting model and testing## Power SFT.R.sq slope truncated.R.sq mean.k. median.k. max.k.
## 1 1 0.0107 25.90 0.978 7300.0 7300.00 7370
## 2 2 0.1290 -8.30 0.891 4070.0 4060.00 4460
## 3 3 0.2070 -4.32 0.909 2460.0 2440.00 3040
## 4 4 0.2960 -3.16 0.936 1580.0 1550.00 2230
## 5 5 0.3840 -2.66 0.952 1070.0 1040.00 1710
## 6 6 0.4630 -2.39 0.961 745.0 716.00 1360
## 7 7 0.5500 -2.26 0.973 538.0 509.00 1110
## 8 8 0.6310 -2.19 0.983 399.0 370.00 929
## 9 9 0.6880 -2.14 0.986 303.0 275.00 788
## 10 10 0.7350 -2.13 0.987 234.0 208.00 677
## 11 11 0.7710 -2.12 0.987 184.0 160.00 588
## 12 12 0.7890 -2.14 0.980 147.0 124.00 516
## 13 14 0.8370 -2.11 0.984 97.2 77.90 406
## 14 16 0.8630 -2.10 0.983 67.1 50.60 327
## 15 18 0.8790 -2.09 0.983 47.9 34.00 270
## 16 20 0.8890 -2.09 0.982 35.2 23.40 227
## 17 22 0.8720 -2.11 0.964 26.5 16.60 193
## 18 24 0.8630 -2.13 0.957 20.4 11.90 166
## 19 26 0.8750 -2.11 0.962 15.9 8.74 145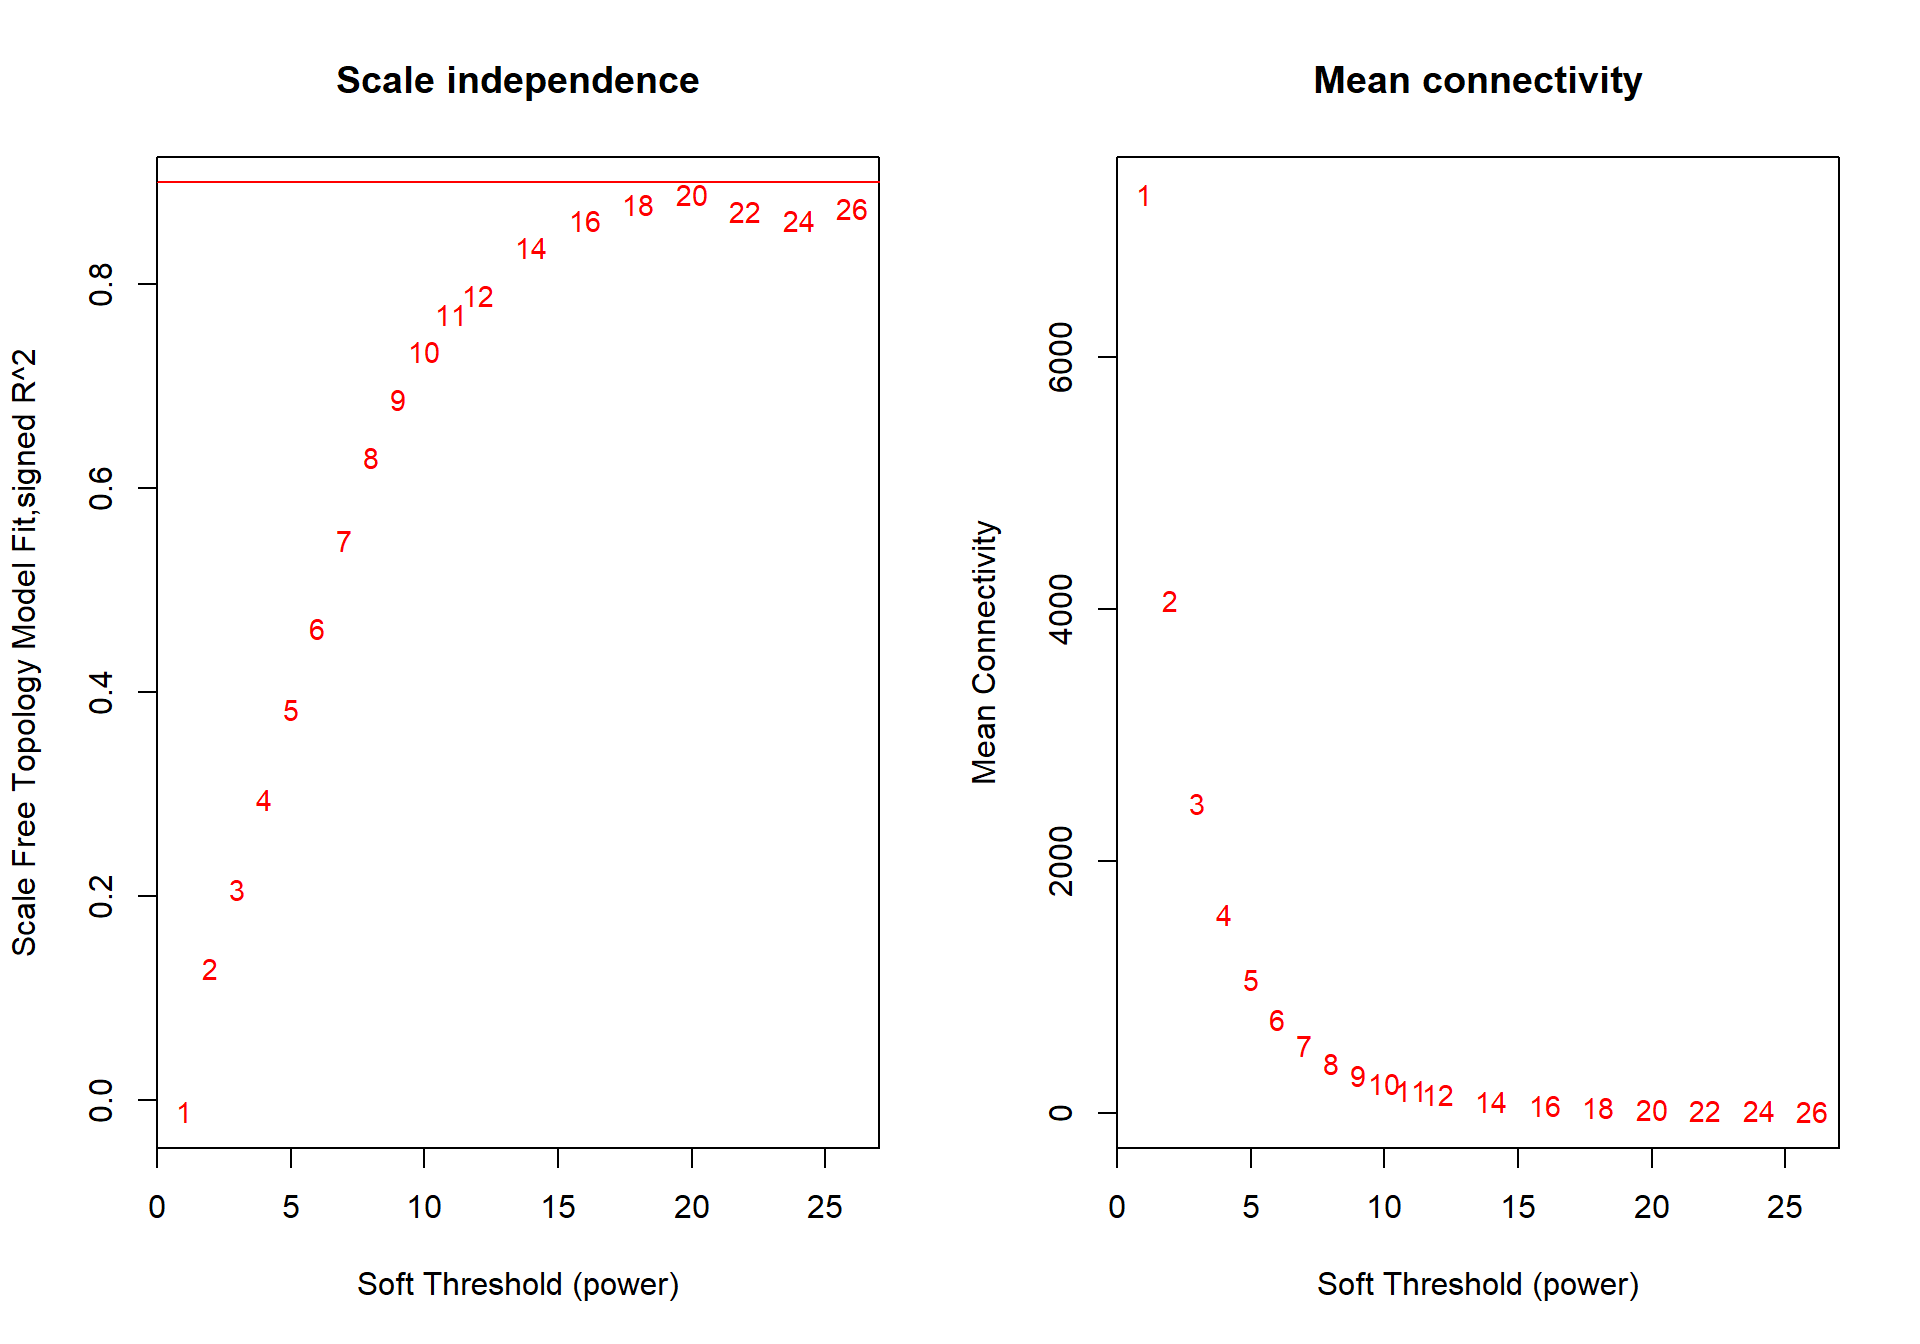
The soft-power selected for AI is 18.
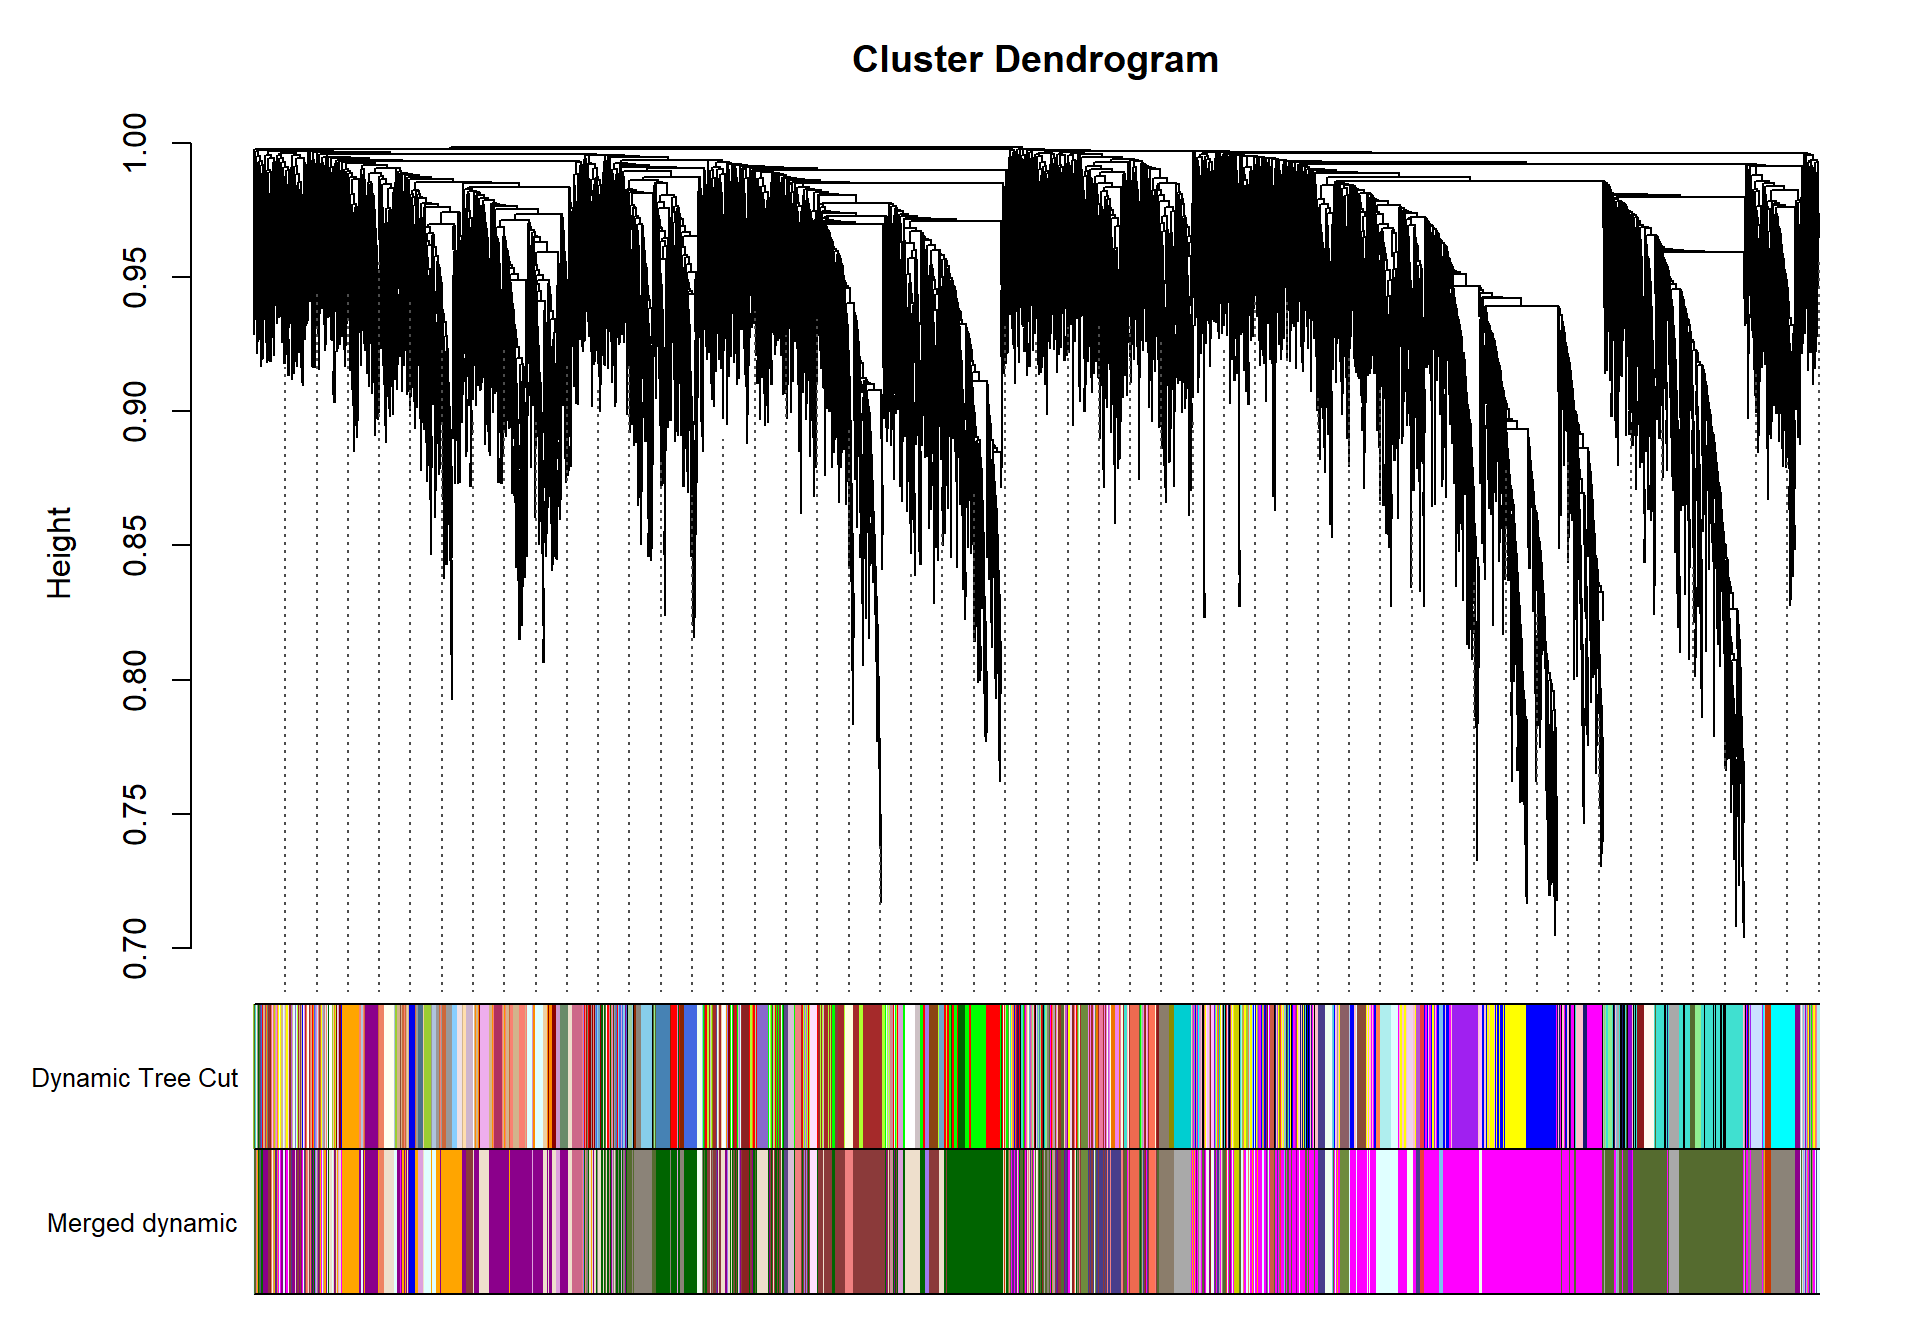
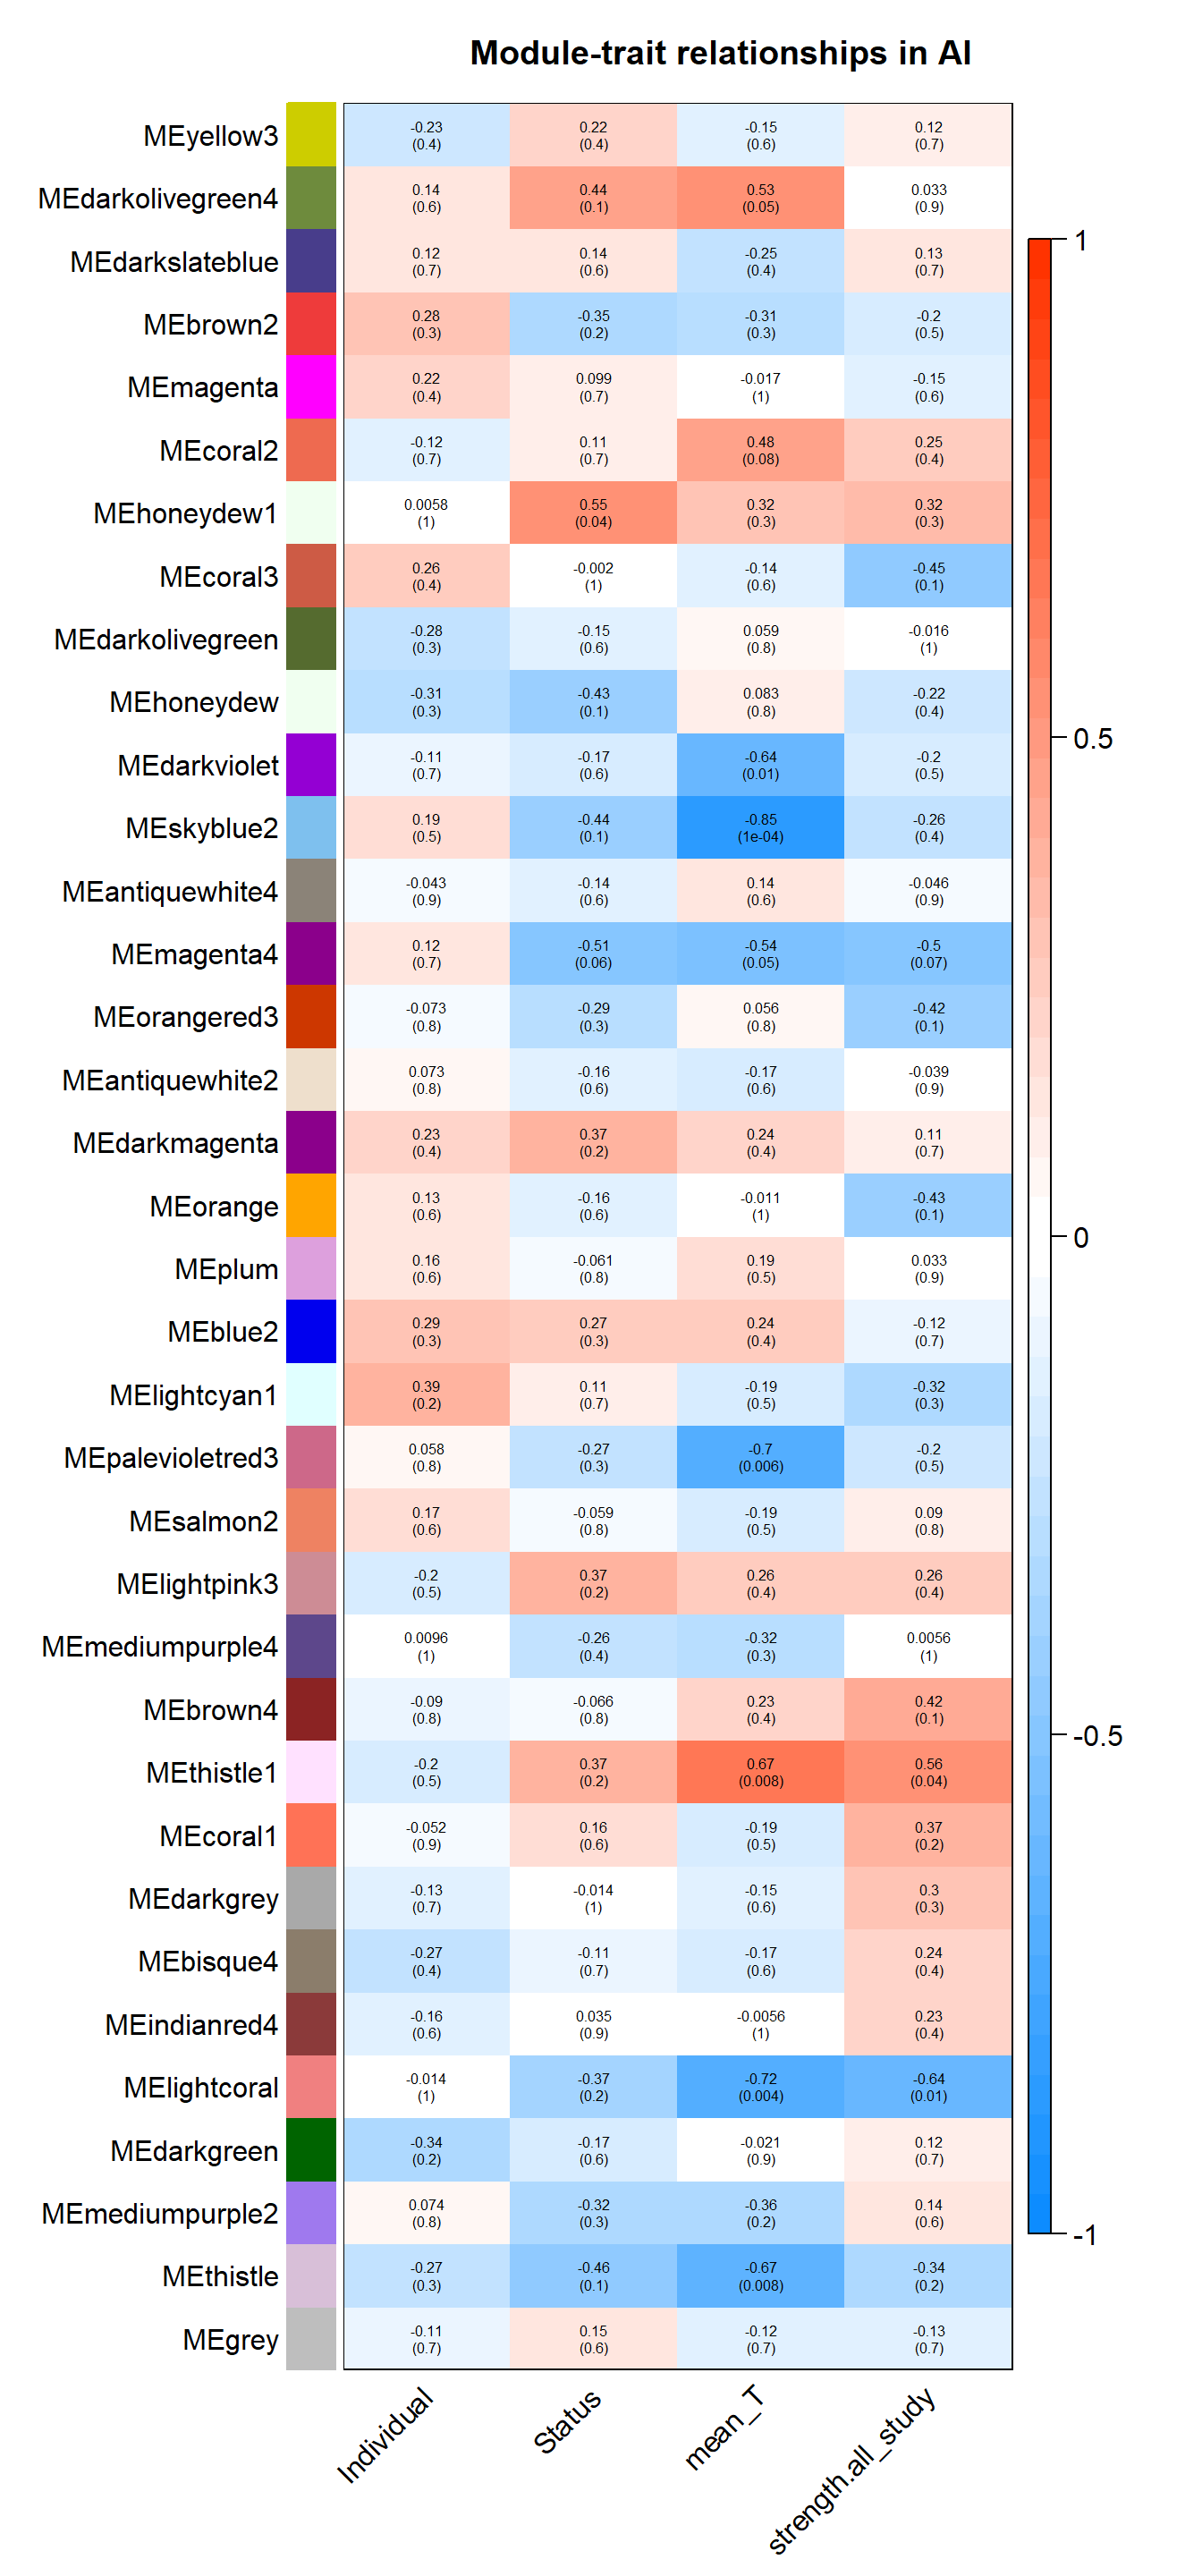
| moduleColors | Freq |
|---|---|
| antiquewhite2 | 1026 |
| antiquewhite4 | 720 |
| bisque4 | 182 |
| blue2 | 68 |
| brown2 | 68 |
| brown4 | 104 |
| coral1 | 94 |
| coral2 | 90 |
| coral3 | 53 |
| darkgreen | 1538 |
| darkgrey | 341 |
| darkmagenta | 1289 |
| darkolivegreen | 1686 |
| darkolivegreen4 | 166 |
| darkslateblue | 482 |
| darkviolet | 65 |
| grey | 2 |
| honeydew | 57 |
| honeydew1 | 309 |
| indianred4 | 1184 |
| lightcoral | 274 |
| lightcyan1 | 496 |
| lightpink3 | 57 |
| magenta | 2702 |
| magenta4 | 59 |
| mediumpurple2 | 75 |
| mediumpurple4 | 53 |
| orange | 629 |
| orangered3 | 76 |
| palevioletred3 | 98 |
| plum | 193 |
| salmon2 | 63 |
| skyblue2 | 86 |
| thistle | 64 |
| thistle1 | 99 |
| yellow3 | 50 |
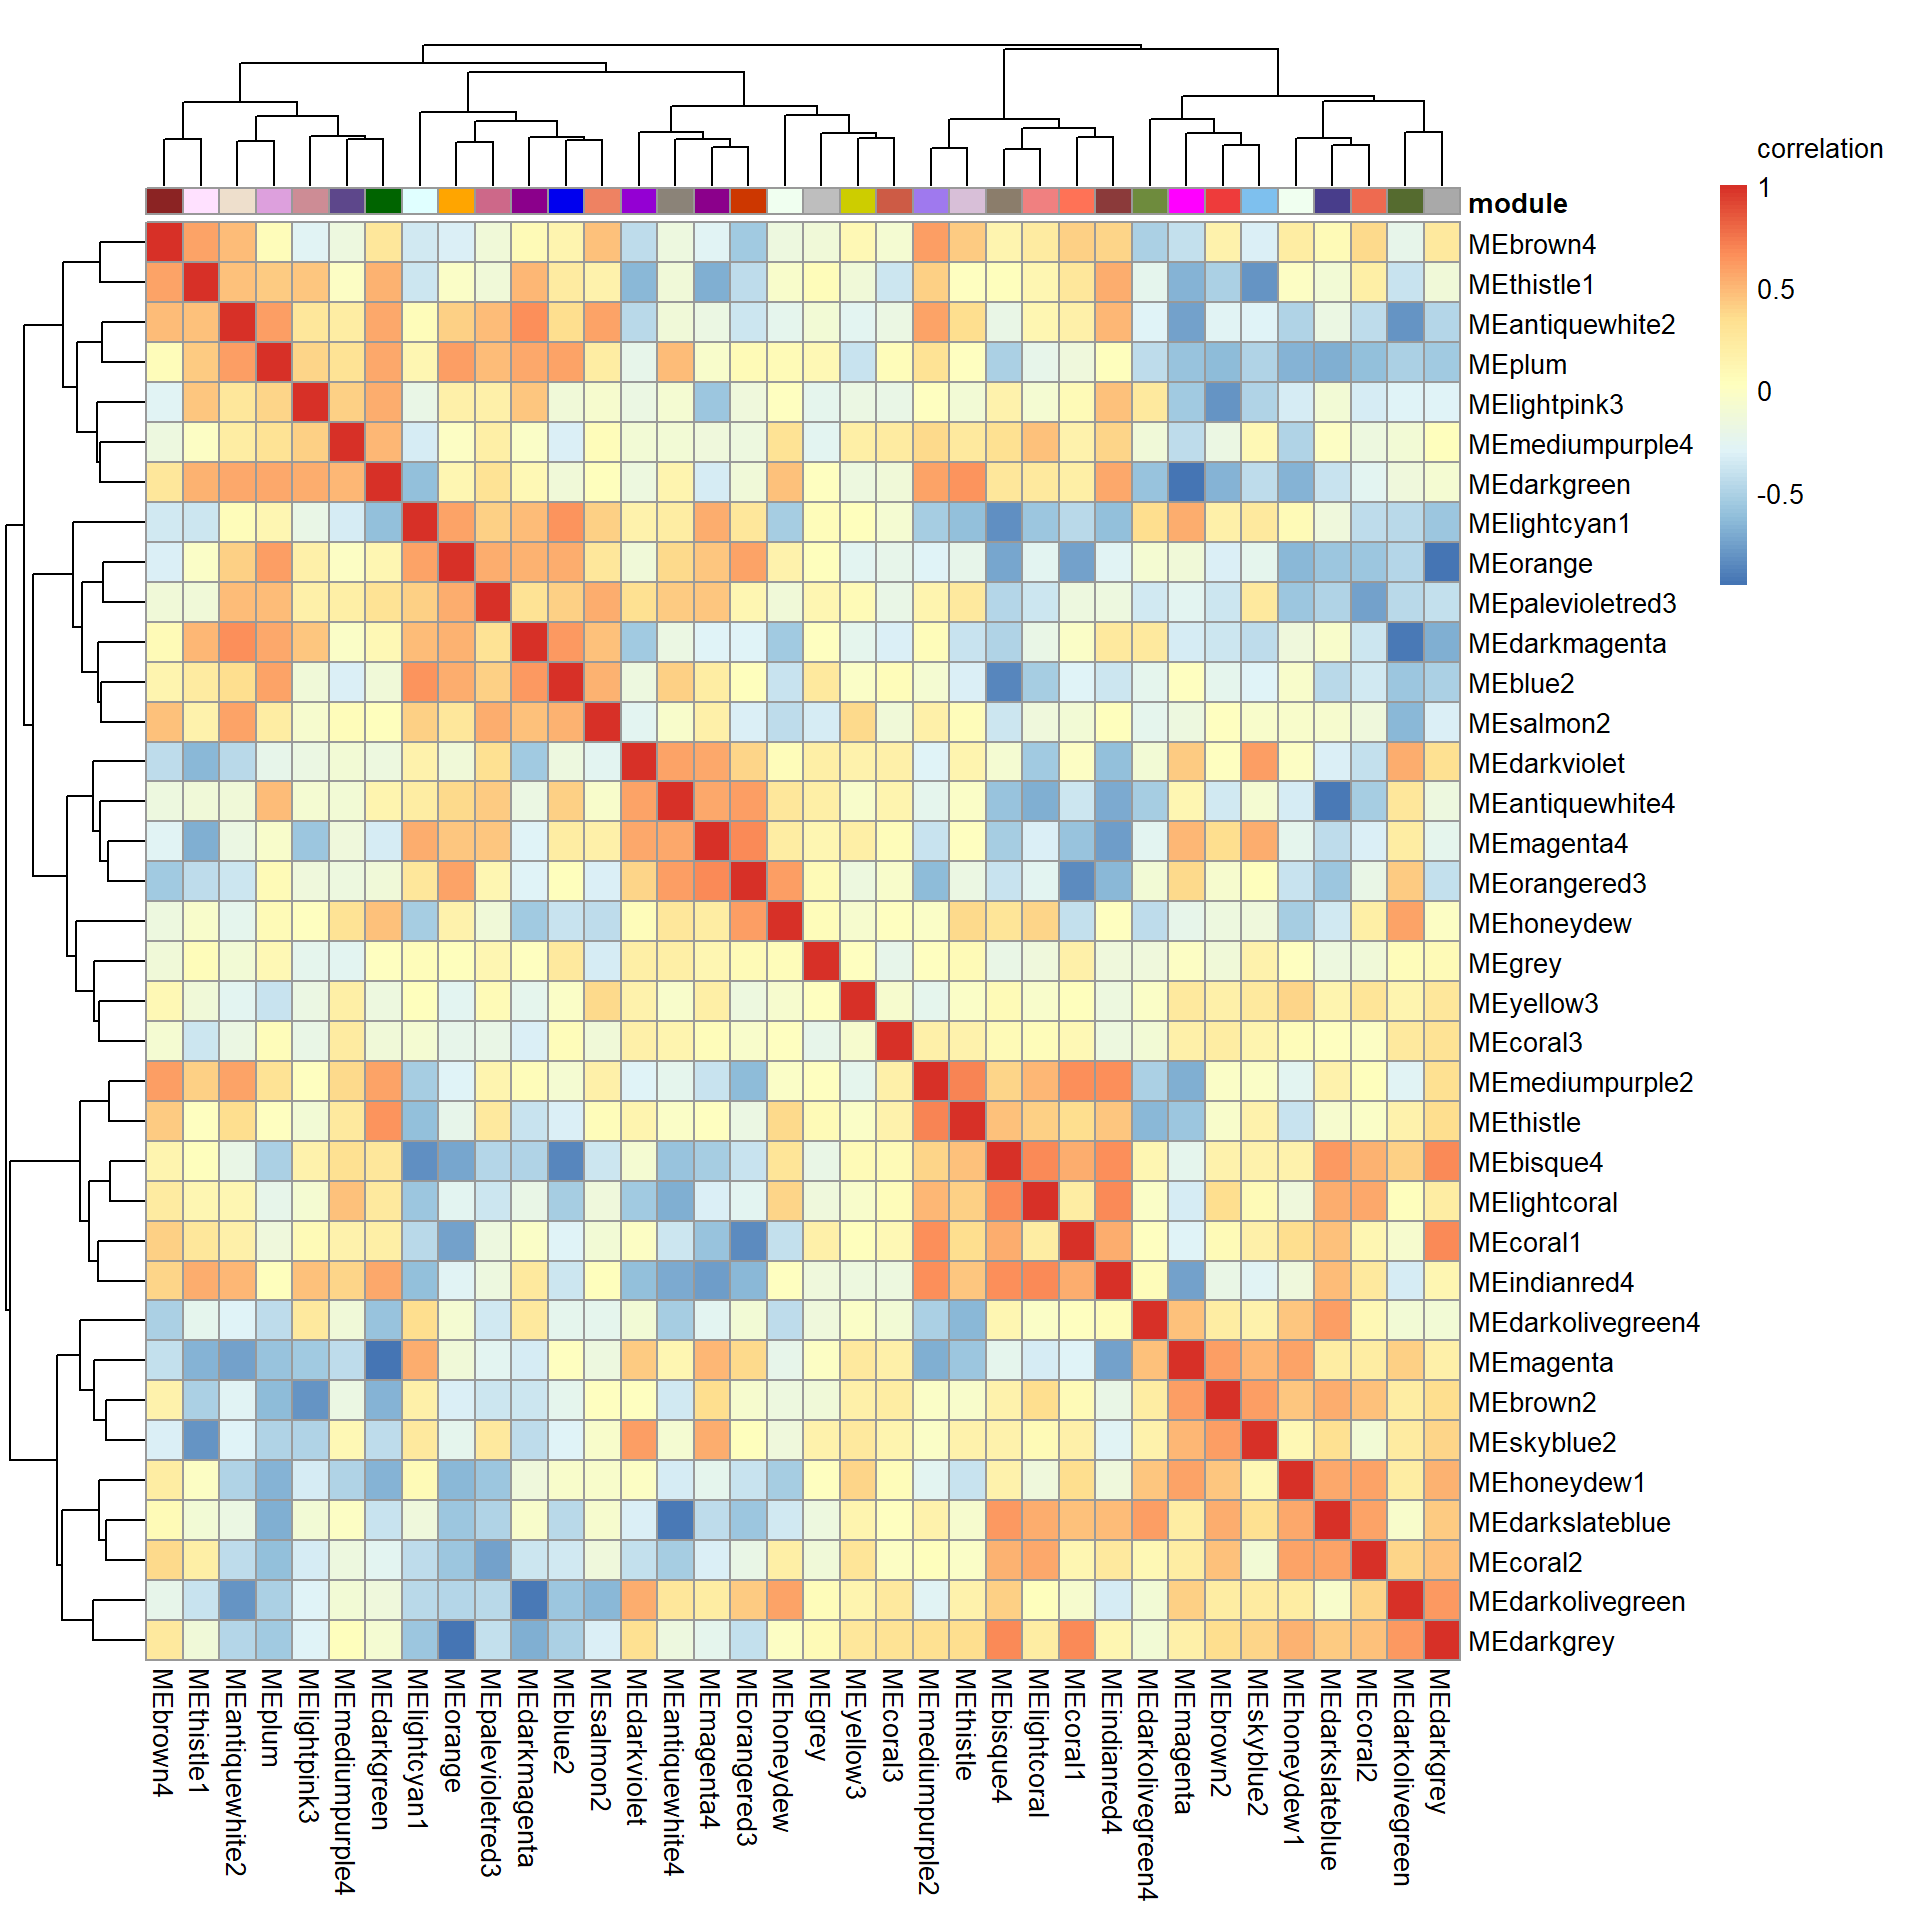
Of our interesting modules, it appears that thistle1 is negatively correlated with skyblue2
10.1 Interesting Modules
10.1.1 thistle1 - mean testosterone
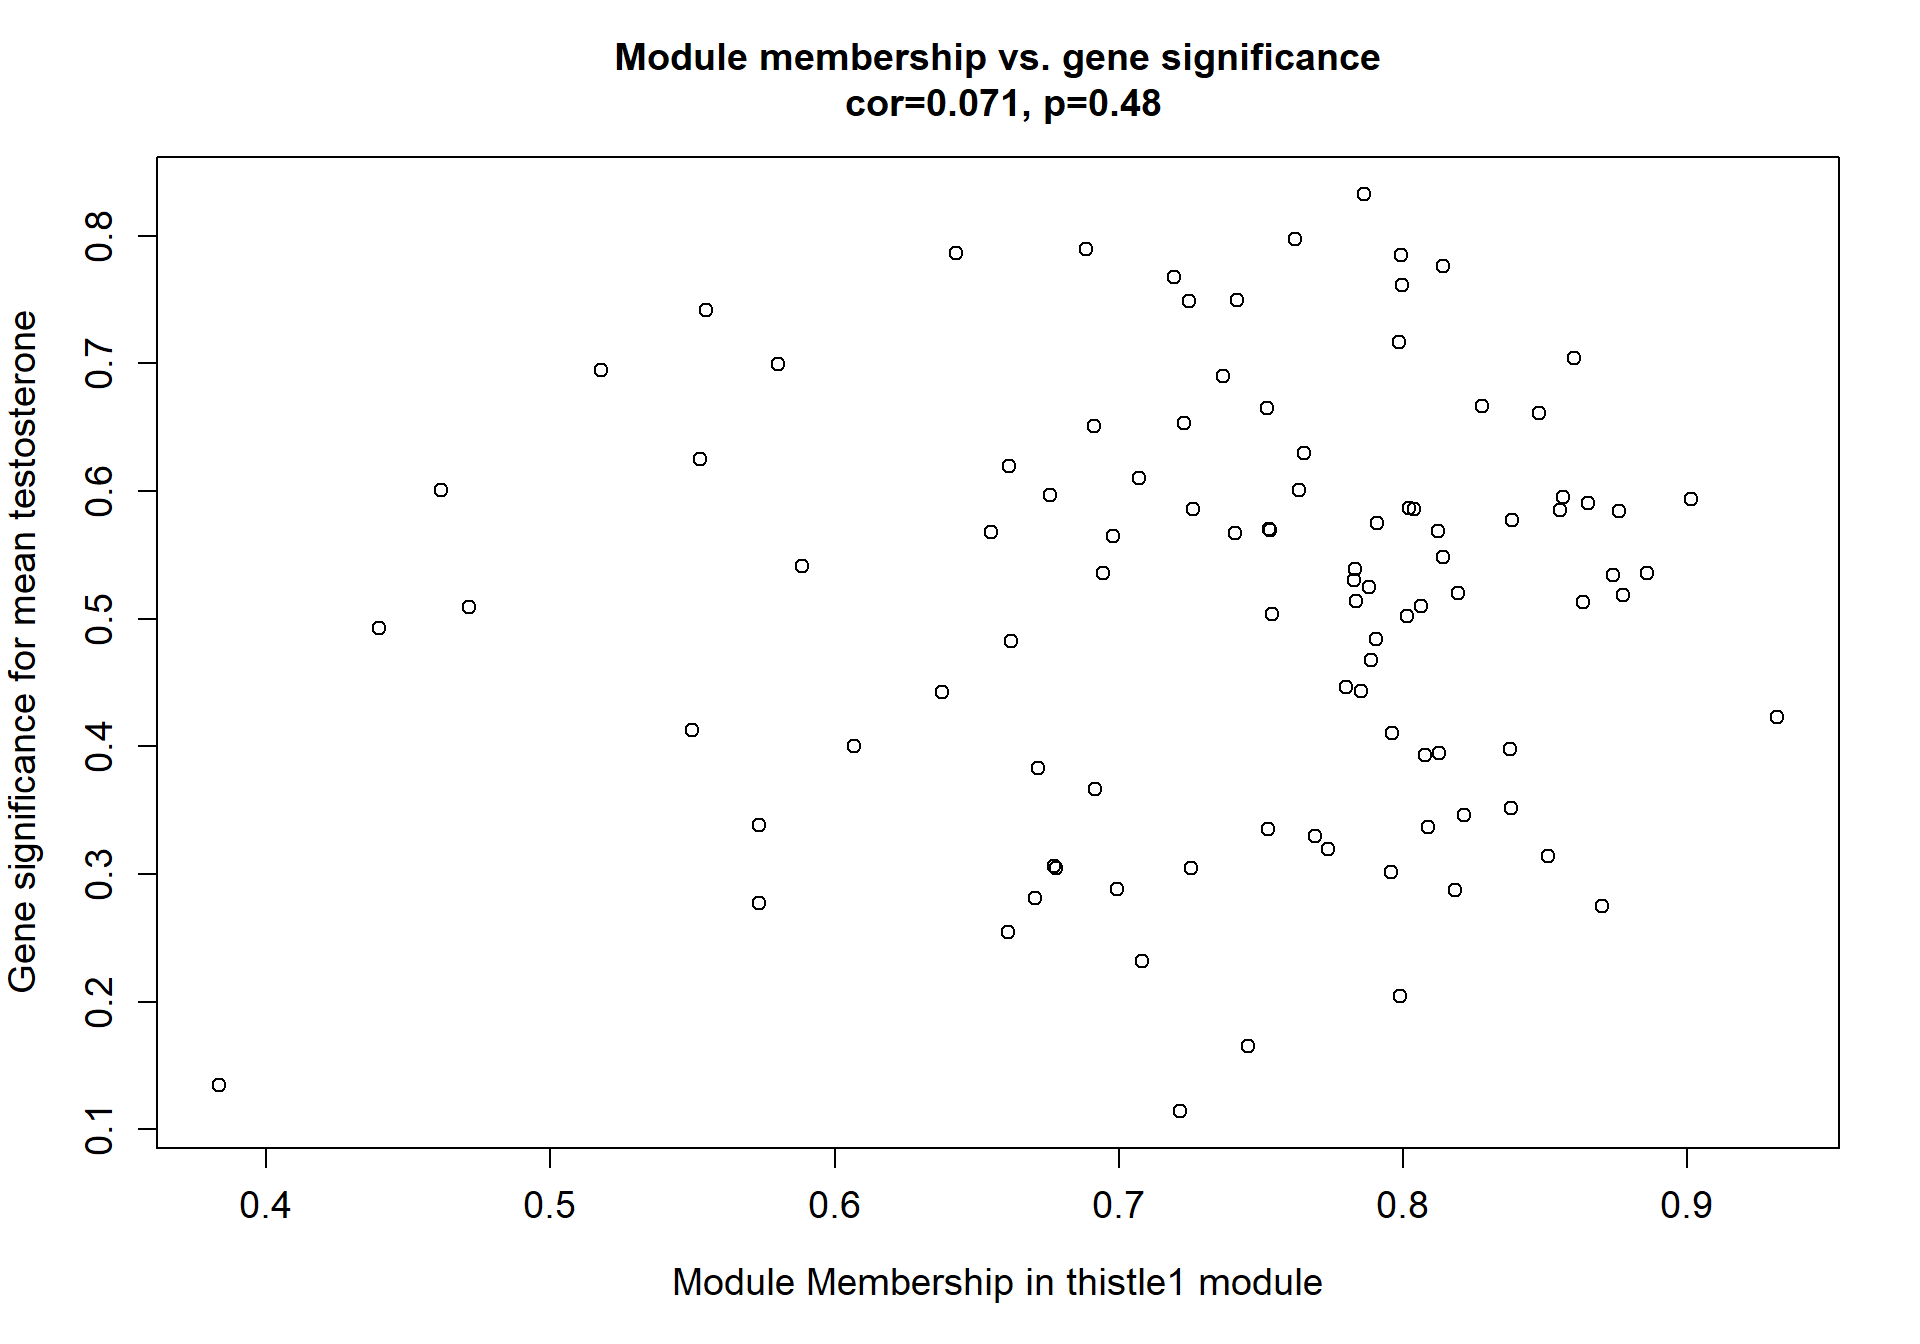
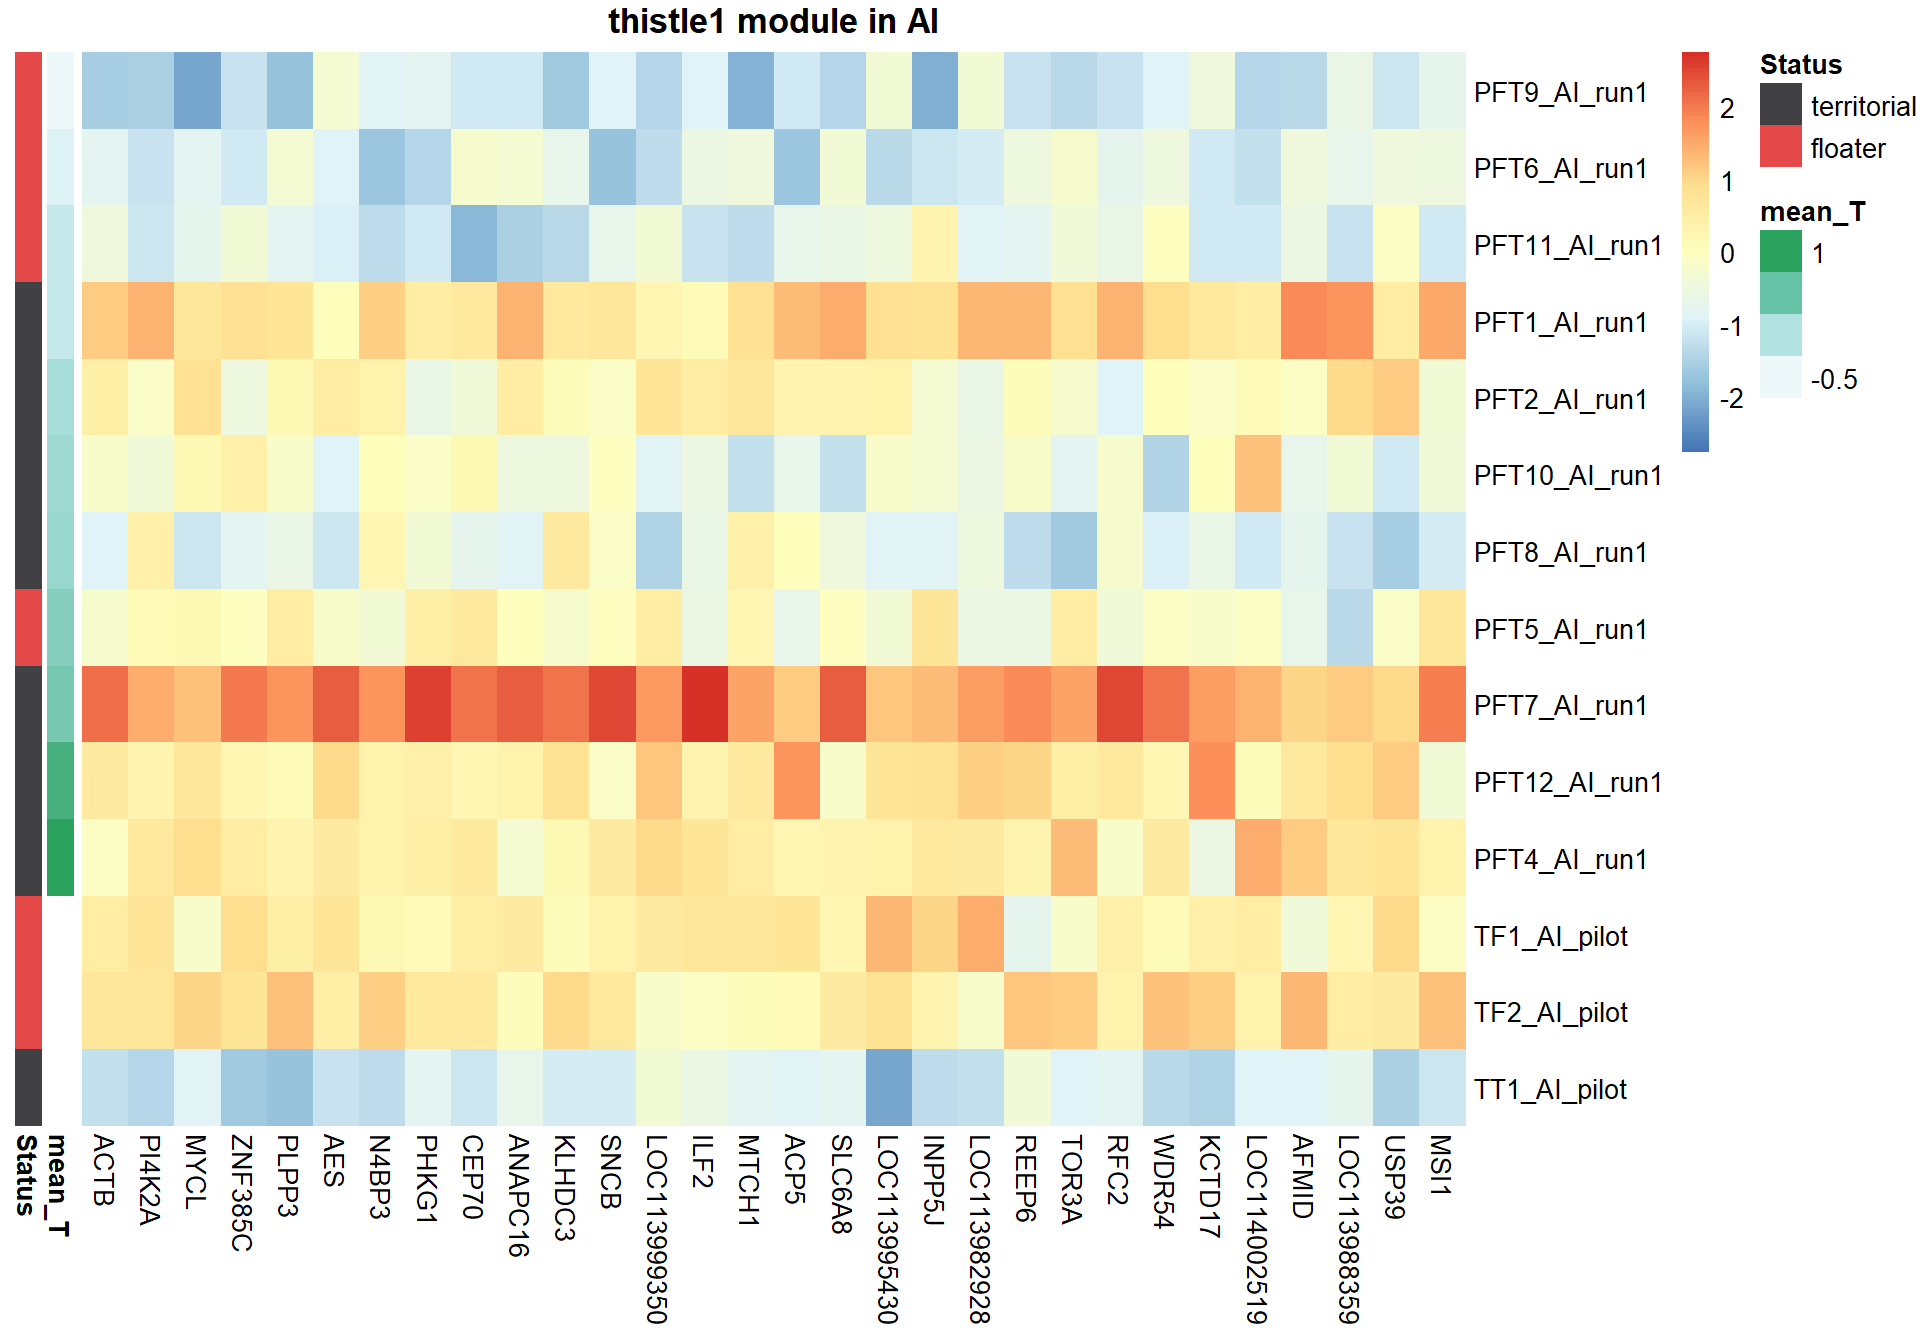
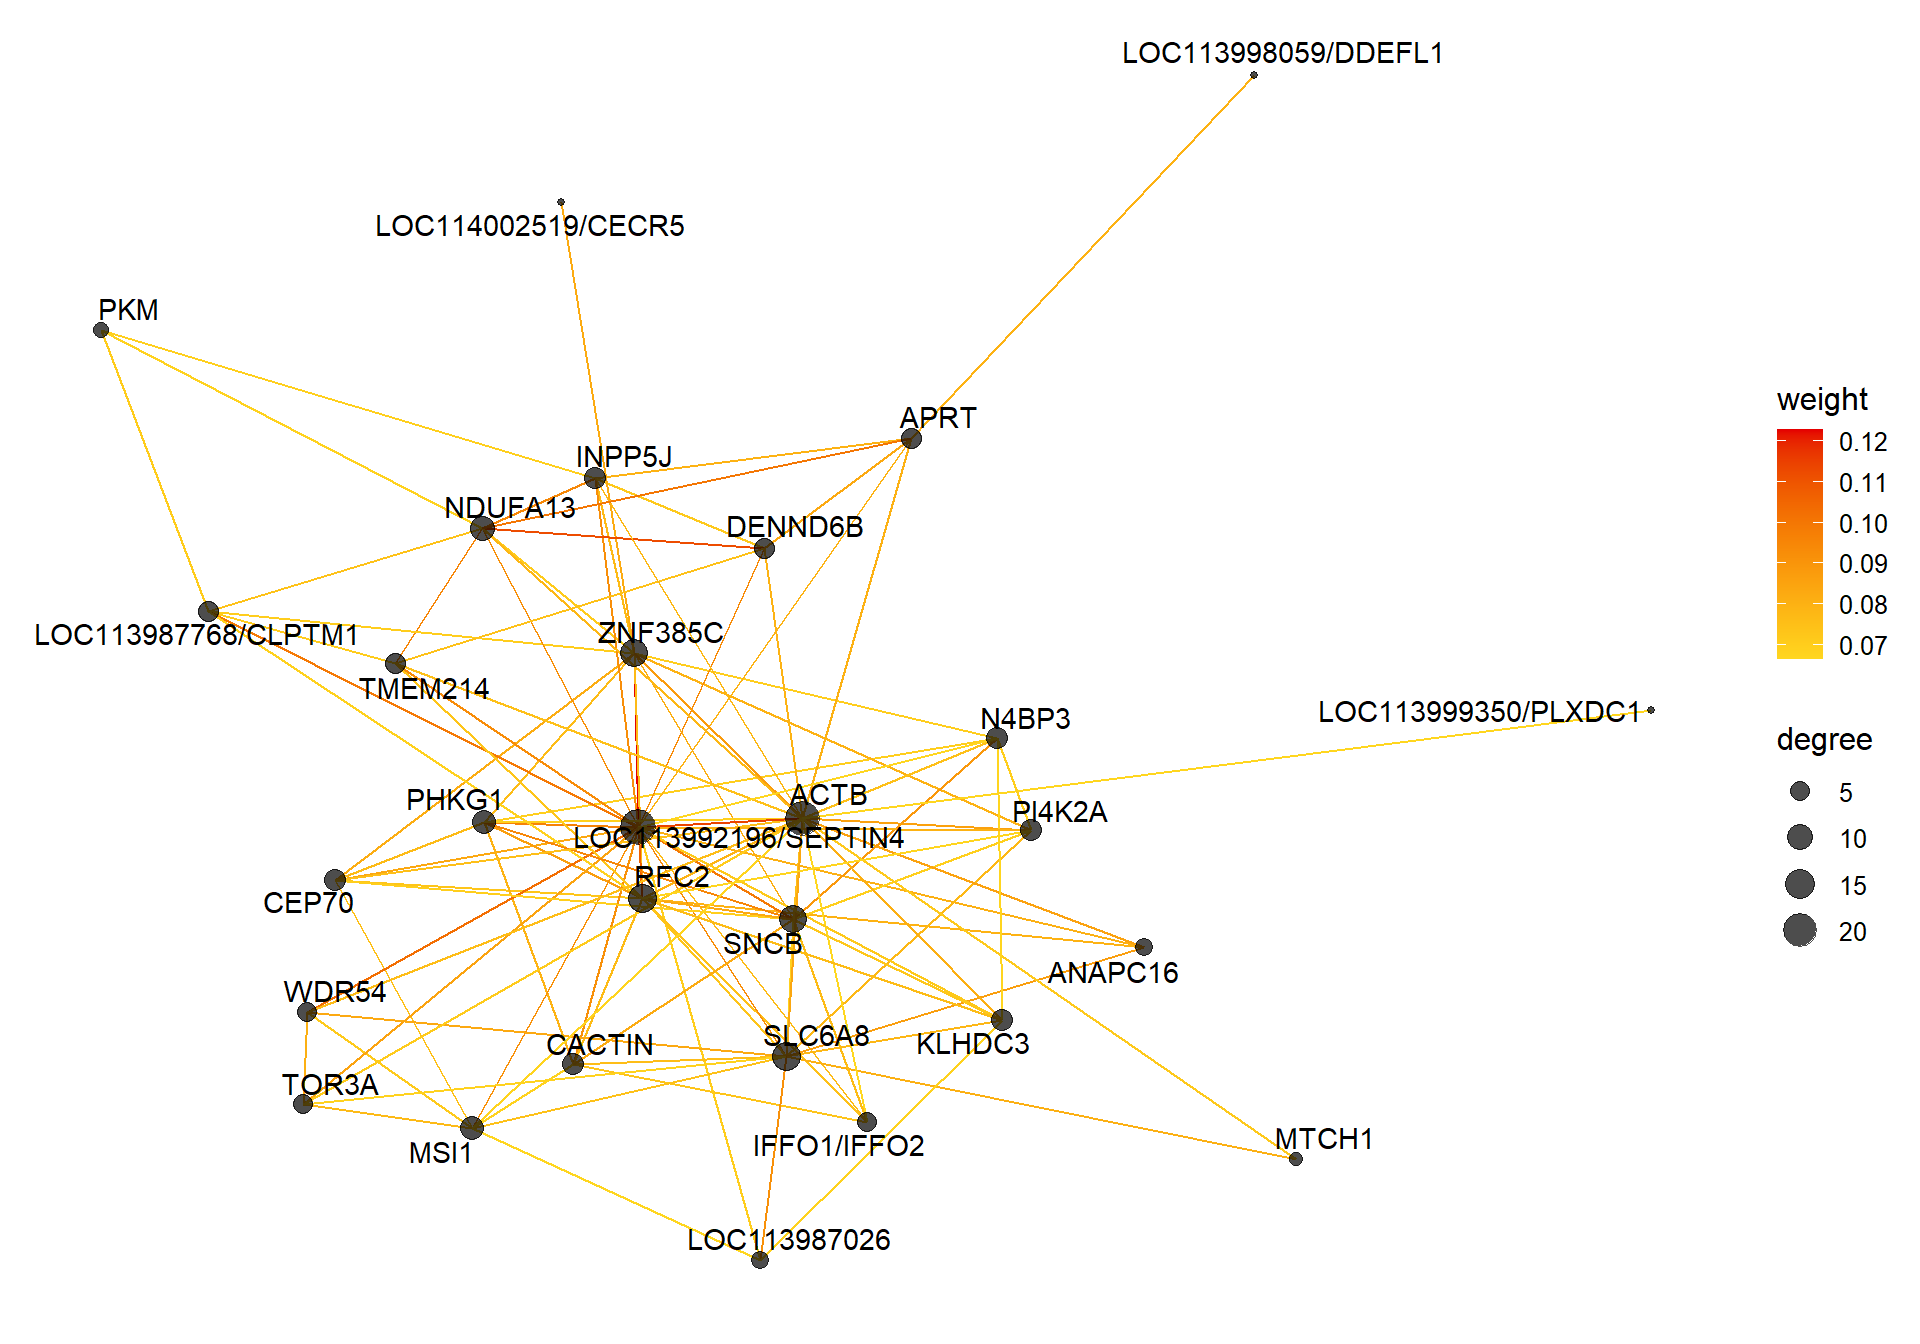
10.1.1.1 Gene Ontology
| ID | Description | GeneRatio | BgRatio | pvalue | p.adjust | qvalue | geneID | Count |
|---|---|---|---|---|---|---|---|---|
| GO:0006783 | heme biosynthetic process | 3/84 | 23/11917 | 0.0005404 | 0.1945428 | 0.1939740 | ALAS1/CPOX/SLC25A39 | 3 |
| GO:0007005 | mitochondrion organization | 4/84 | 84/11917 | 0.0028888 | 0.3805802 | 0.3794674 | ALAS1/DNAJA3/PYROXD2/SIRT3 | 4 |
| GO:0045453 | bone resorption | 2/84 | 14/11917 | 0.0042287 | 0.3805802 | 0.3794674 | ACP5/NCDN | 2 |
| GO:1900181 | negative regulation of protein localization to nucleus | 2/84 | 14/11917 | 0.0042287 | 0.3805802 | 0.3794674 | LZTS2/TRIM29 | 2 |
| GO:0001921 | positive regulation of receptor recycling | 2/84 | 16/11917 | 0.0055255 | 0.3924384 | 0.3912909 | ANXA2/LOC113996134 | 2 |
| GO:0072593 | reactive oxygen species metabolic process | 2/84 | 23/11917 | 0.0112839 | 0.3924384 | 0.3912909 | LOC113988359/NDUFA13 | 2 |
| GO:0007131 | reciprocal meiotic recombination | 2/84 | 26/11917 | 0.0142987 | 0.3924384 | 0.3912909 | KLHDC3/RAD51D | 2 |
| GO:0016525 | negative regulation of angiogenesis | 3/84 | 74/11917 | 0.0152921 | 0.3924384 | 0.3912909 | COL4A3/ISM1/LOC114002556 | 3 |
| GO:2000134 | negative regulation of G1/S transition of mitotic cell cycle | 2/84 | 28/11917 | 0.0164802 | 0.3924384 | 0.3912909 | CDKN2C/RBL1 | 2 |
| GO:0009408 | response to heat | 2/84 | 30/11917 | 0.0187941 | 0.3924384 | 0.3912909 | DNAJA3/RPS6KB1 | 2 |
## preparing gene to GO mapping data...## preparing IC data...## Warning in if (class(try(col2rgb(palette), silent = TRUE)) == "try-error")
## stop("color palette is not correct"): the condition has length > 1 and only the
## first element will be used
10.1.2 skyblue2 - mean testosterone
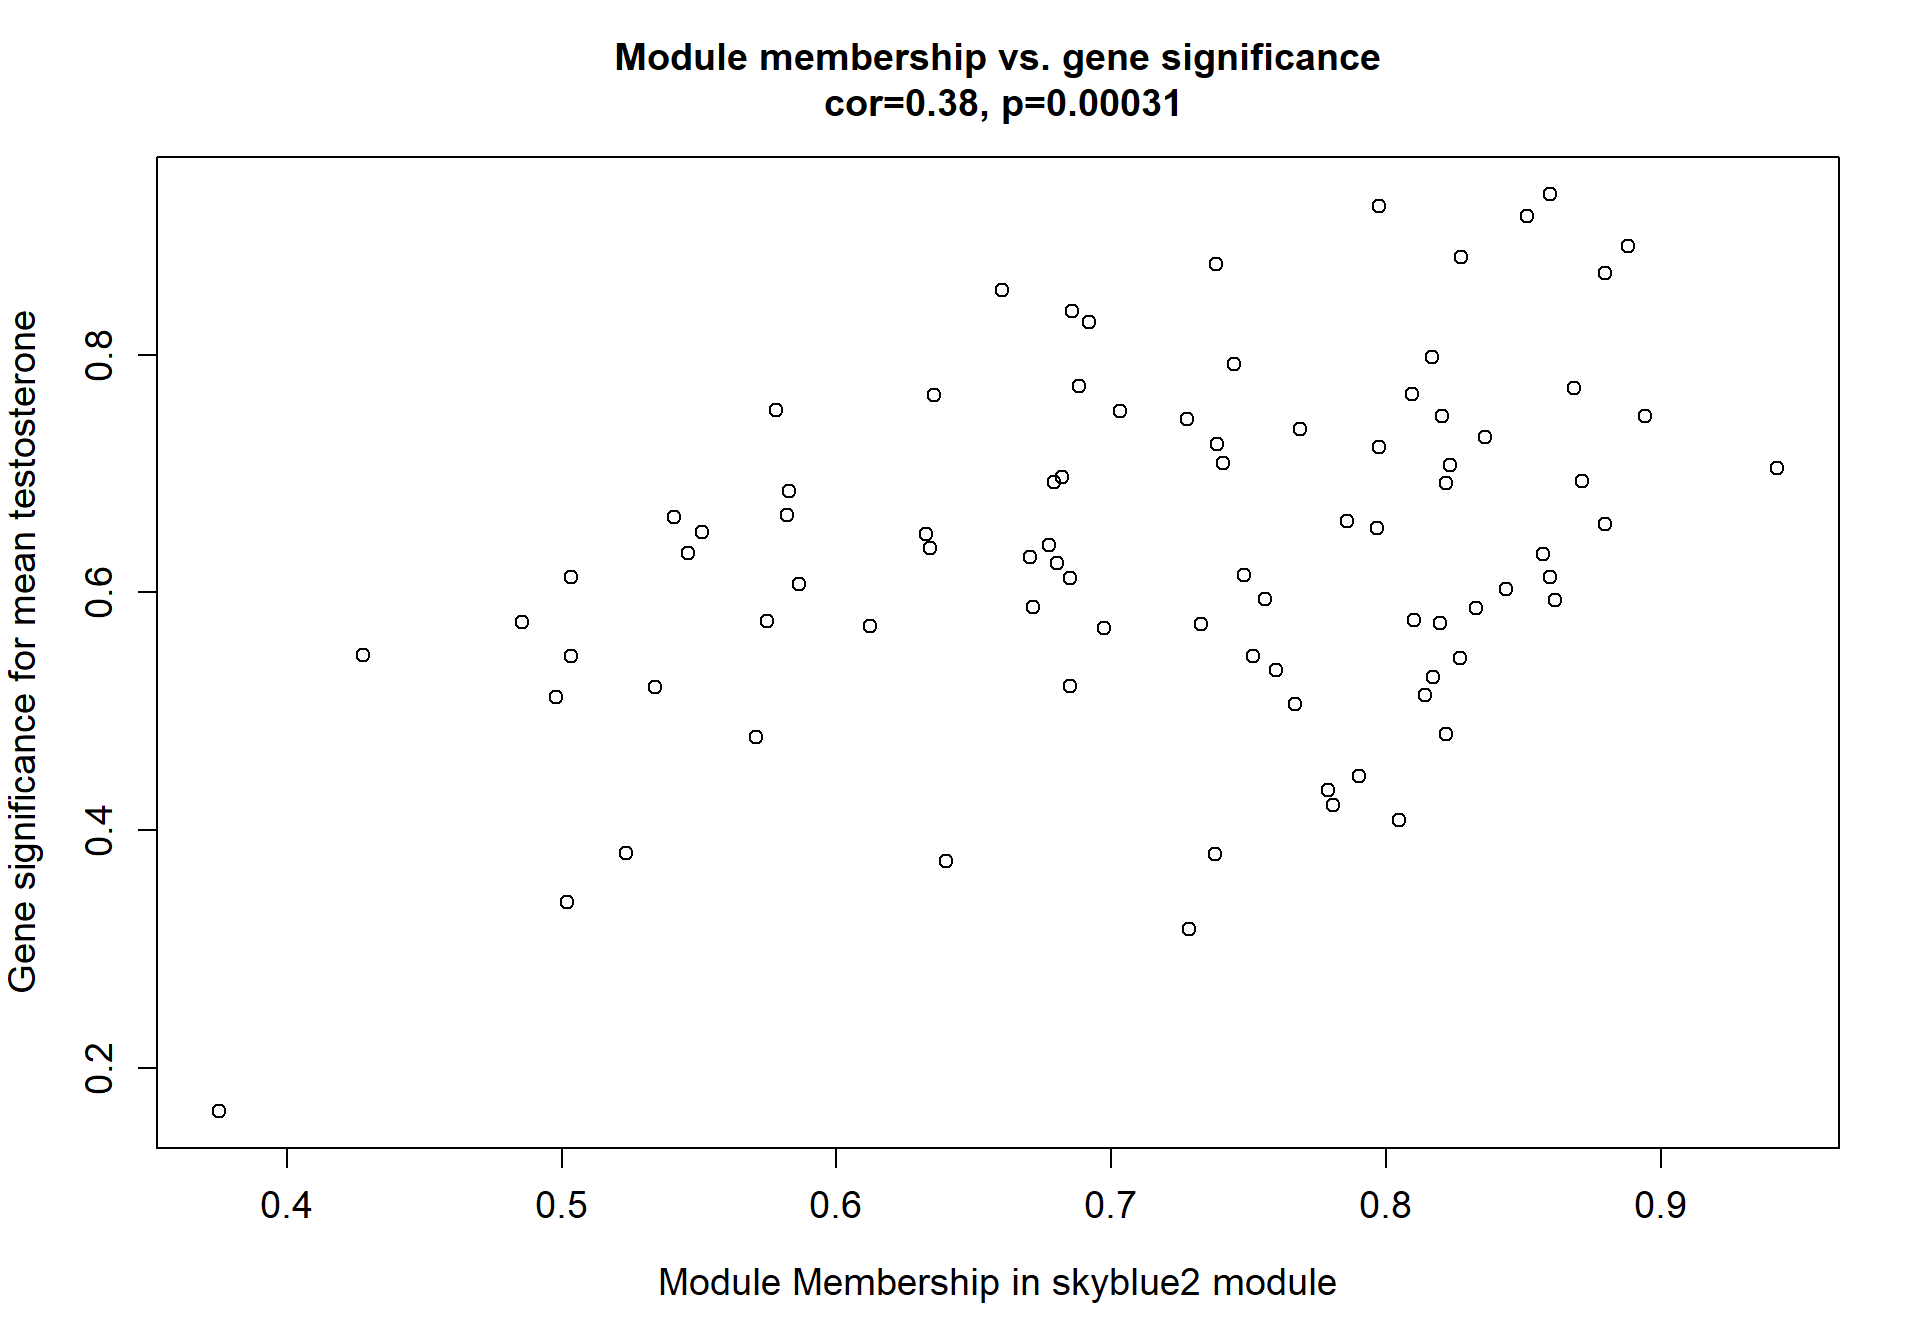
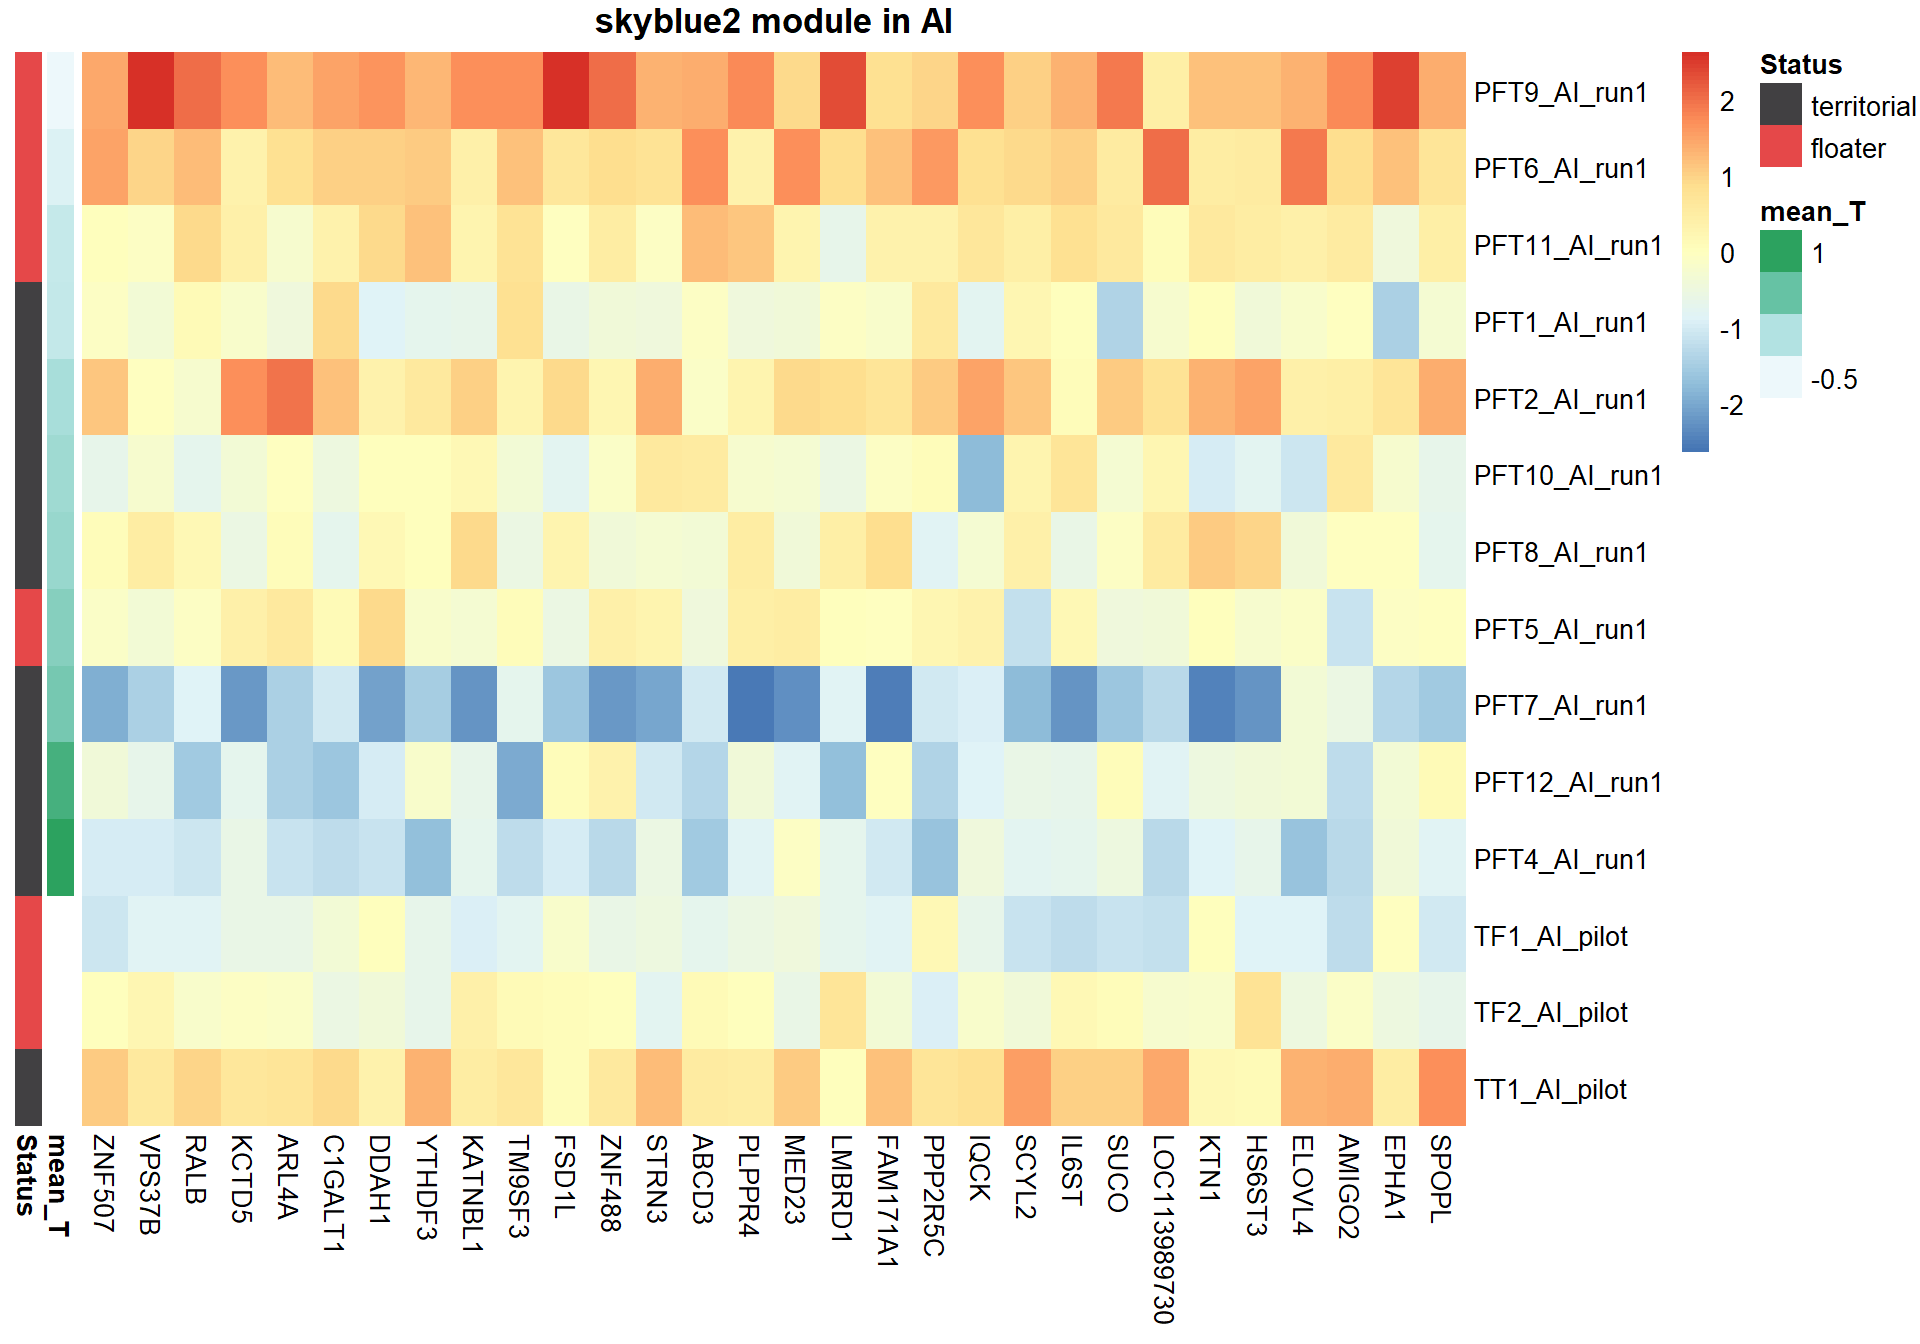
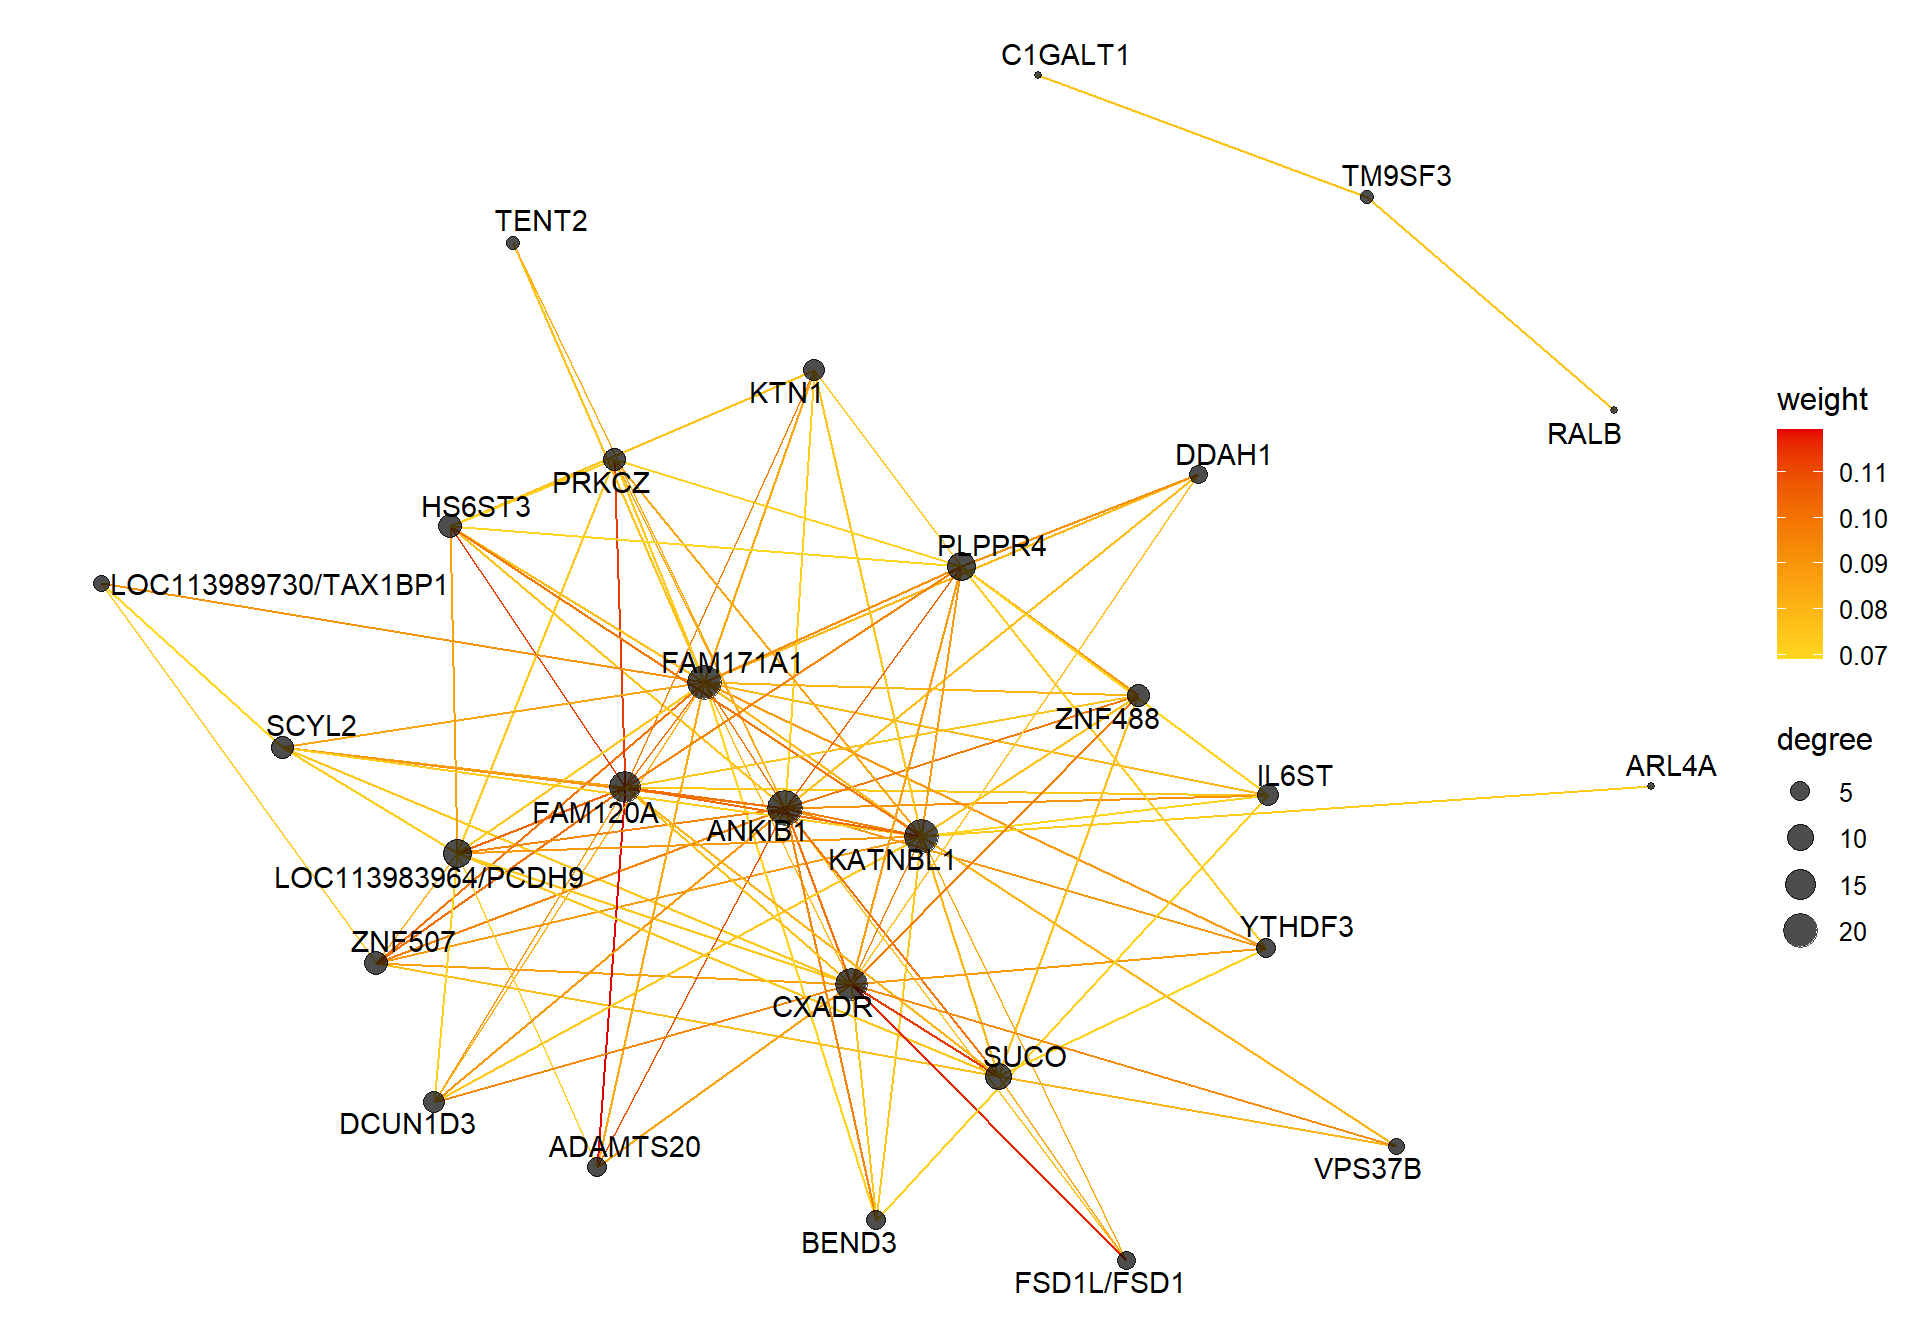
10.1.2.1 Gene Ontology
| ID | Description | GeneRatio | BgRatio | pvalue | p.adjust | qvalue | geneID | Count |
|---|---|---|---|---|---|---|---|---|
| GO:0098696 | regulation of neurotransmitter receptor localization to postsynaptic specialization membrane | 2/80 | 10/11917 | 0.0019340 | 0.3458354 | 0.3407388 | ADAM10/PRKCZ | 2 |
| GO:0006509 | membrane protein ectodomain proteolysis | 2/80 | 19/11917 | 0.0070672 | 0.3458354 | 0.3407388 | ADAM10/SPPL2A | 2 |
| GO:0001954 | positive regulation of cell-matrix adhesion | 2/80 | 20/11917 | 0.0078185 | 0.3458354 | 0.3407388 | EPHA1/PRKCZ | 2 |
| GO:0097194 | execution phase of apoptosis | 2/80 | 20/11917 | 0.0078185 | 0.3458354 | 0.3407388 | CFLAR/STK24 | 2 |
| GO:0001817 | regulation of cytokine production | 2/80 | 21/11917 | 0.0086041 | 0.3458354 | 0.3407388 | IGF2BP3/LRRC19 | 2 |
| GO:0005977 | glycogen metabolic process | 2/80 | 23/11917 | 0.0102765 | 0.3458354 | 0.3407388 | IL6ST/LOC113990070 | 2 |
| GO:0010803 | regulation of tumor necrosis factor-mediated signaling pathway | 2/80 | 23/11917 | 0.0102765 | 0.3458354 | 0.3407388 | LOC113989730/SPPL2A | 2 |
| GO:0032715 | negative regulation of interleukin-6 production | 2/80 | 26/11917 | 0.0130308 | 0.3458354 | 0.3407388 | FOXJ1/SOCS5 | 2 |
| GO:0021510 | spinal cord development | 2/80 | 28/11917 | 0.0150254 | 0.3458354 | 0.3407388 | PTN/SUZ12 | 2 |
| GO:0051781 | positive regulation of cell division | 2/80 | 31/11917 | 0.0182459 | 0.3458354 | 0.3407388 | GAREM1/PTN | 2 |
## preparing gene to GO mapping data...## preparing IC data...## Warning in if (class(try(col2rgb(palette), silent = TRUE)) == "try-error")
## stop("color palette is not correct"): the condition has length > 1 and only the
## first element will be used
10.1.3 palevioletred3 - mean testosterone
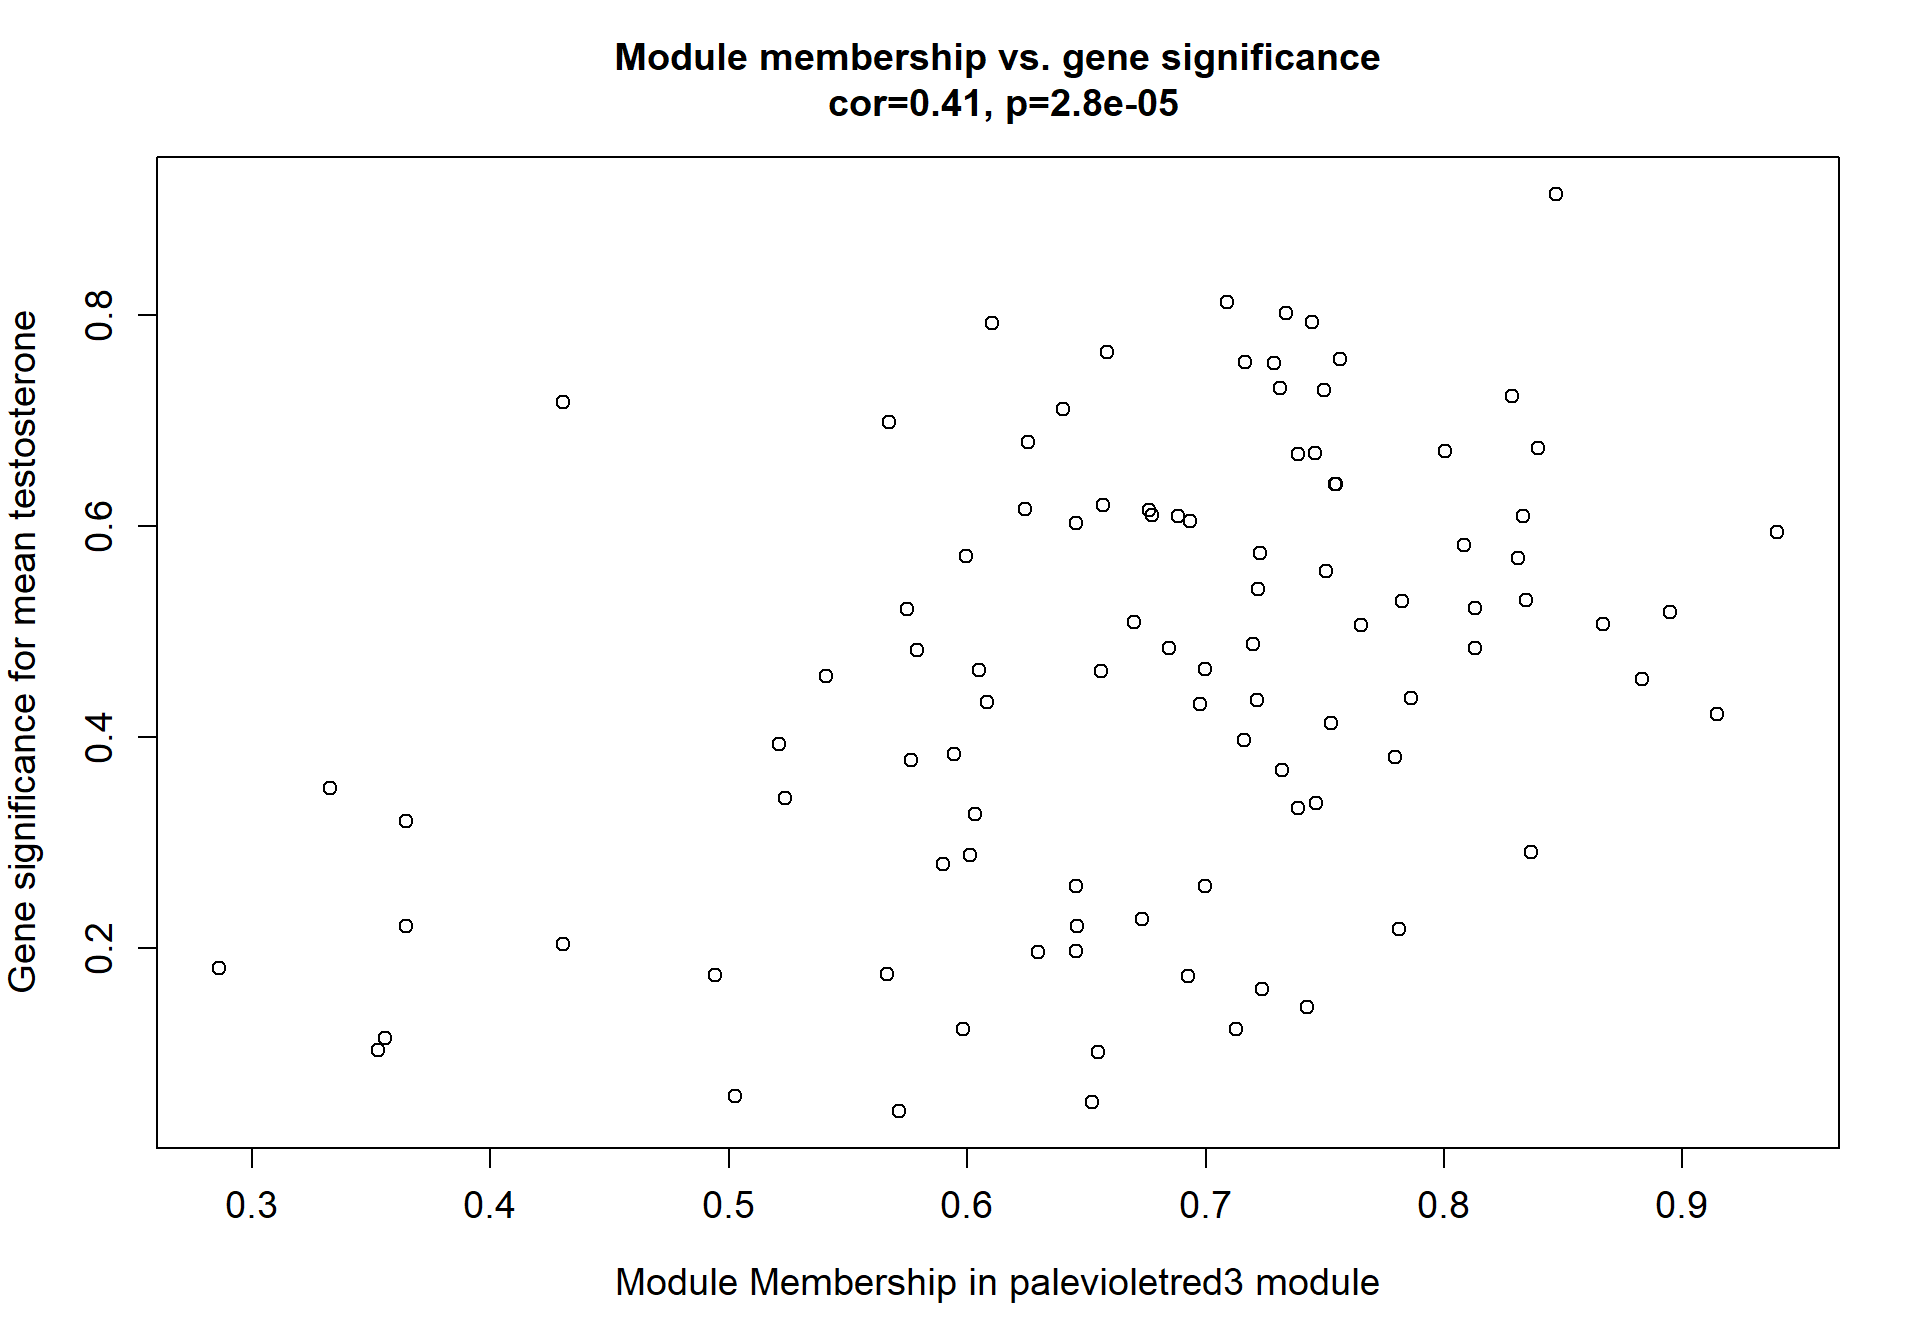
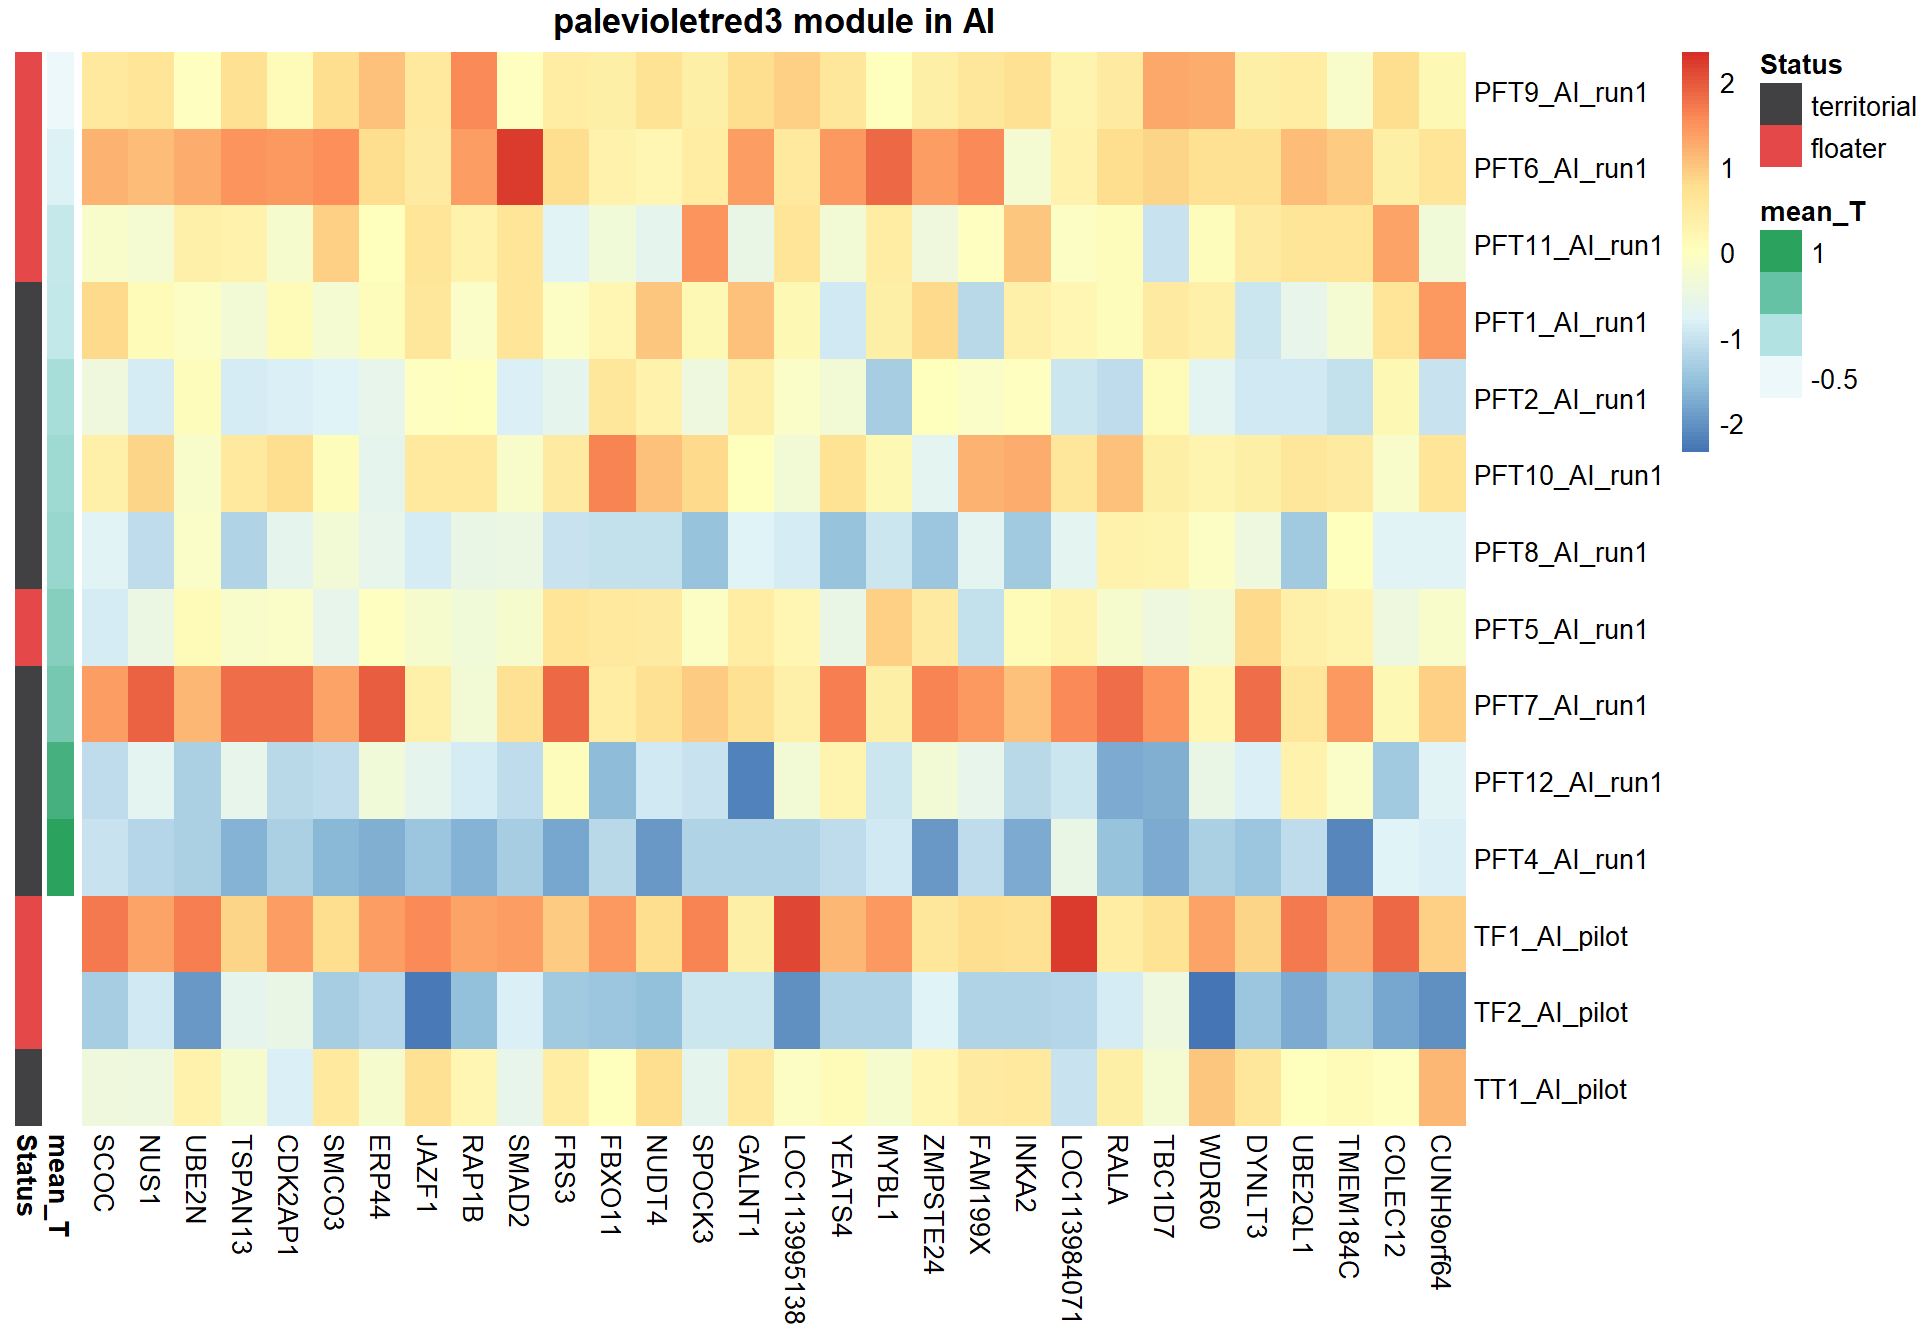
Not very convincing relationship
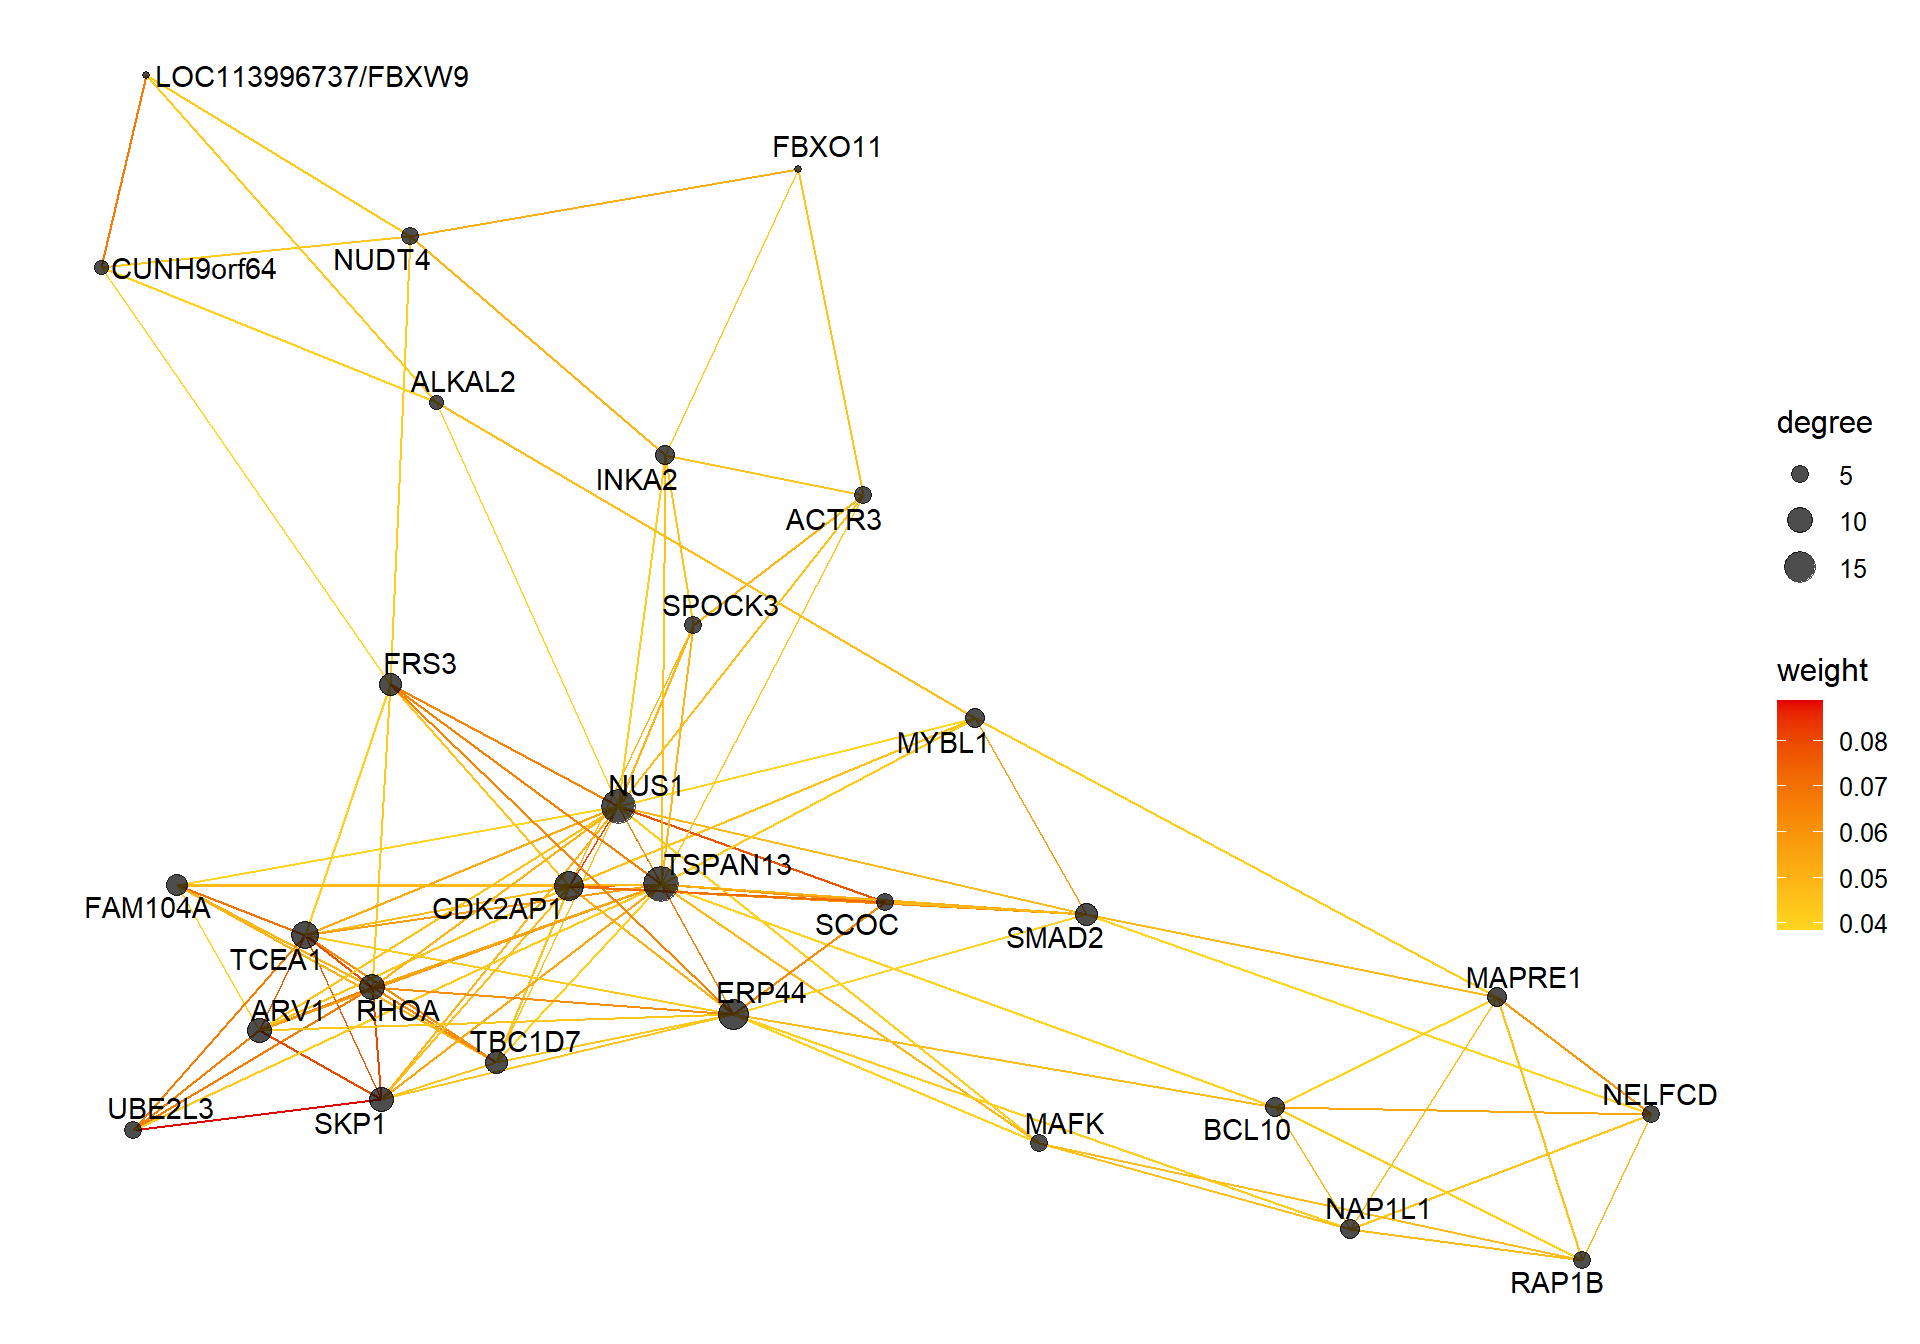
10.1.3.1 Gene Ontology
| ID | Description | GeneRatio | BgRatio | pvalue | p.adjust | qvalue | geneID | Count |
|---|---|---|---|---|---|---|---|---|
| GO:2000772 | regulation of cellular senescence | 2/80 | 11/11917 | 0.0023535 | 0.3208474 | 0.3203173 | RSL1D1/ZMPSTE24 | 2 |
| GO:2001214 | positive regulation of vasculogenesis | 2/80 | 12/11917 | 0.0028120 | 0.3208474 | 0.3203173 | ADM/CD34 | 2 |
| GO:0042632 | cholesterol homeostasis | 3/80 | 52/11917 | 0.0050824 | 0.3208474 | 0.3203173 | LOC113994745/NPC2/NUS1 | 3 |
| GO:0031398 | positive regulation of protein ubiquitination | 3/80 | 66/11917 | 0.0098415 | 0.3208474 | 0.3203173 | BCL10/TBC1D7/UBE2L3 | 3 |
| GO:0010951 | negative regulation of endopeptidase activity | 3/80 | 67/11917 | 0.0102538 | 0.3208474 | 0.3203173 | LOC113992168/PROS1/SPOCK3 | 3 |
| GO:0001889 | liver development | 3/80 | 68/11917 | 0.0106759 | 0.3208474 | 0.3203173 | FPGS/SRD5A1/ZMPSTE24 | 3 |
| GO:0008360 | regulation of cell shape | 4/80 | 135/11917 | 0.0128347 | 0.3208474 | 0.3203173 | CDC42SE2/RHOA/TBCCD1/ZMPSTE24 | 4 |
| GO:0016239 | positive regulation of macroautophagy | 2/80 | 27/11917 | 0.0140126 | 0.3208474 | 0.3203173 | SCOC/SESN2 | 2 |
| GO:0000209 | protein polyubiquitination | 5/80 | 220/11917 | 0.0160870 | 0.3208474 | 0.3203173 | FBXO11/LOC113996737/SKP1/UBE2L3/UBE2V1 | 5 |
| GO:0030449 | regulation of complement activation | 2/80 | 30/11917 | 0.0171426 | 0.3208474 | 0.3203173 | LOC113992168/PROS1 | 2 |
## preparing gene to GO mapping data...## preparing IC data...## Warning in if (class(try(col2rgb(palette), silent = TRUE)) == "try-error")
## stop("color palette is not correct"): the condition has length > 1 and only the
## first element will be used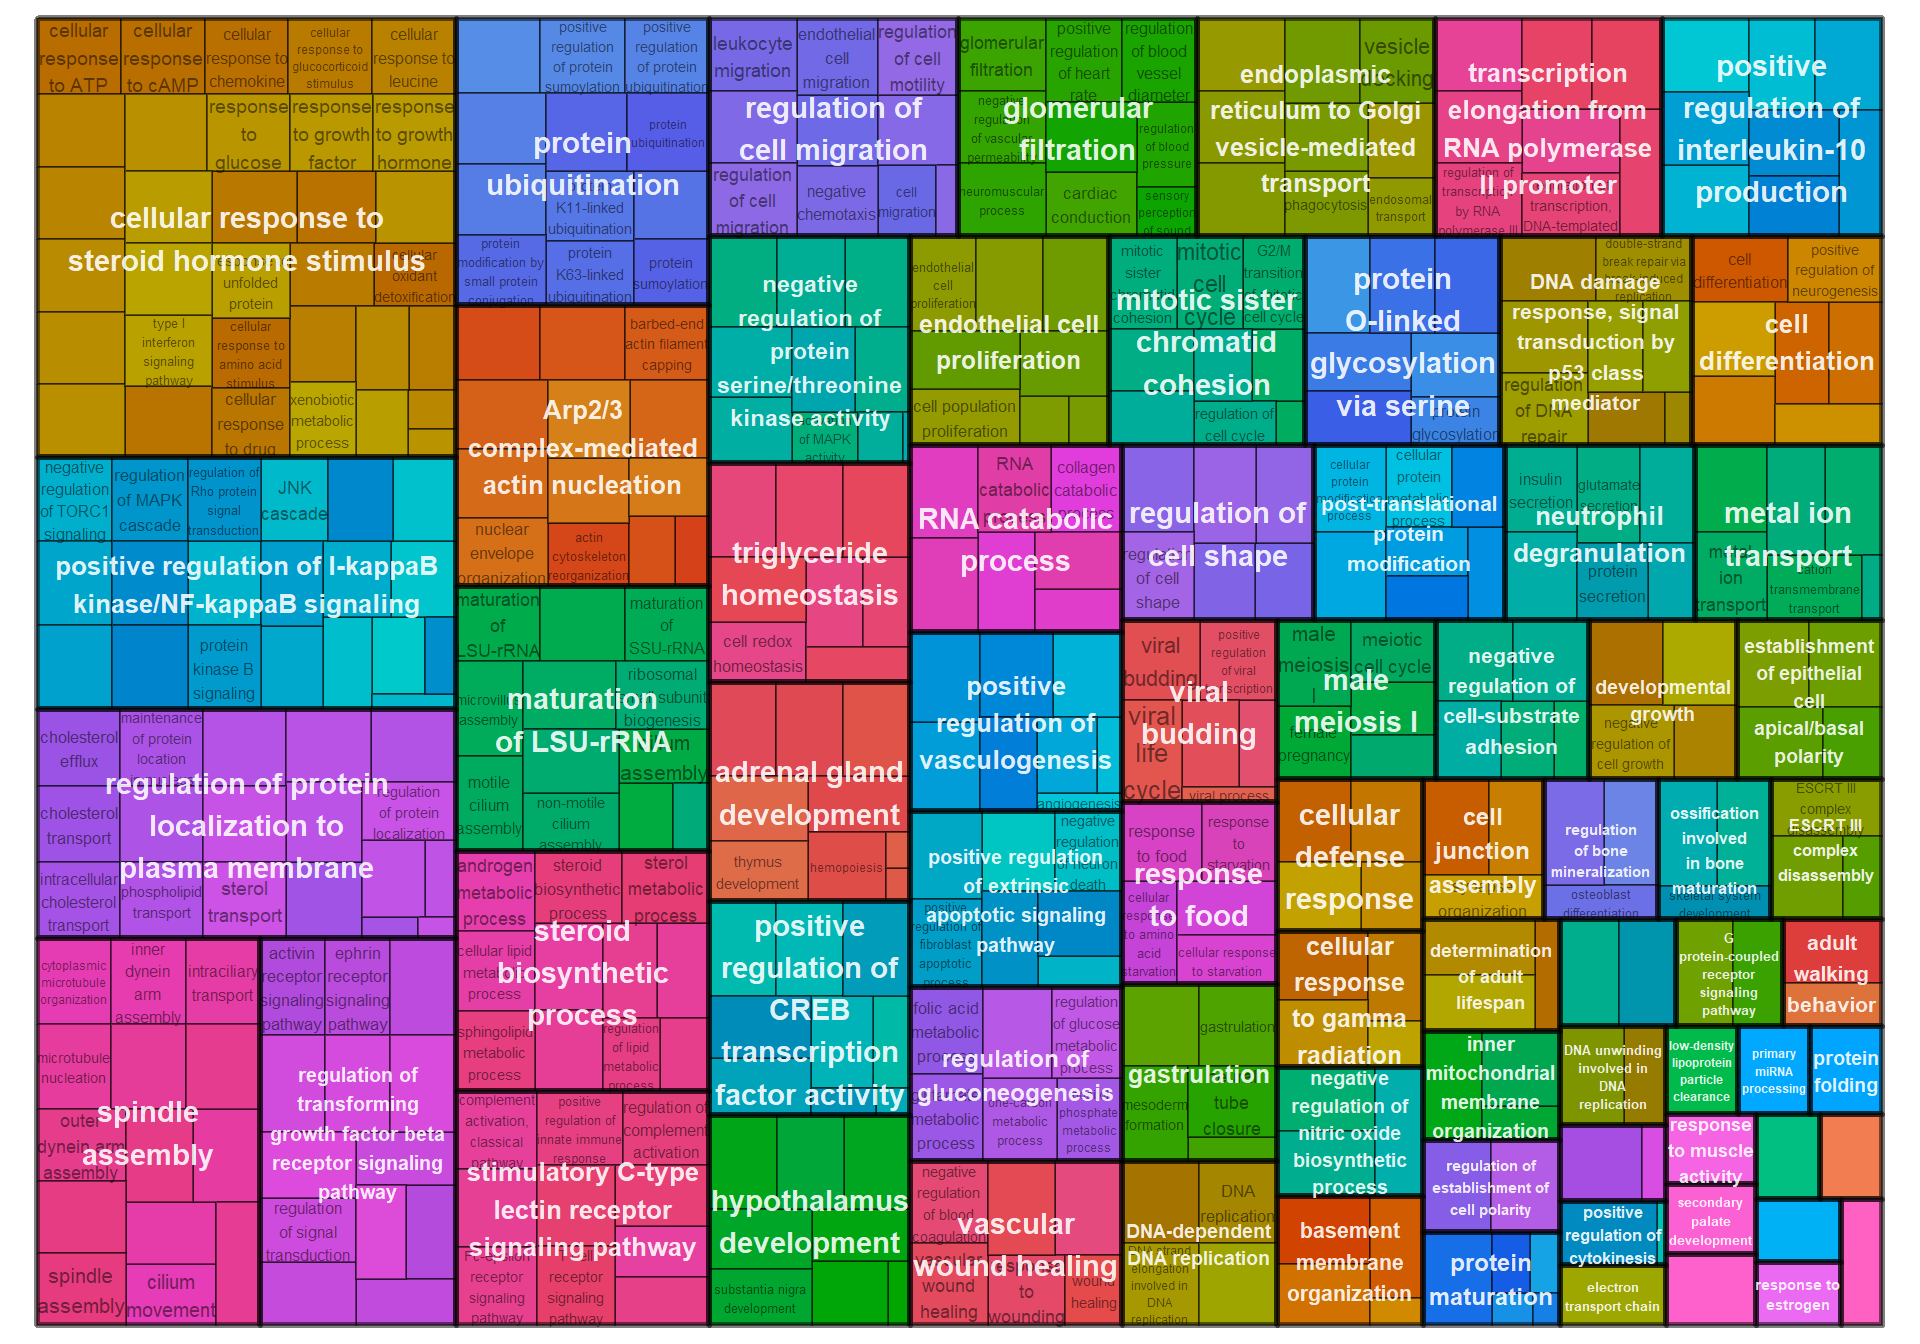
10.1.4 lightcoral - mean testosterone
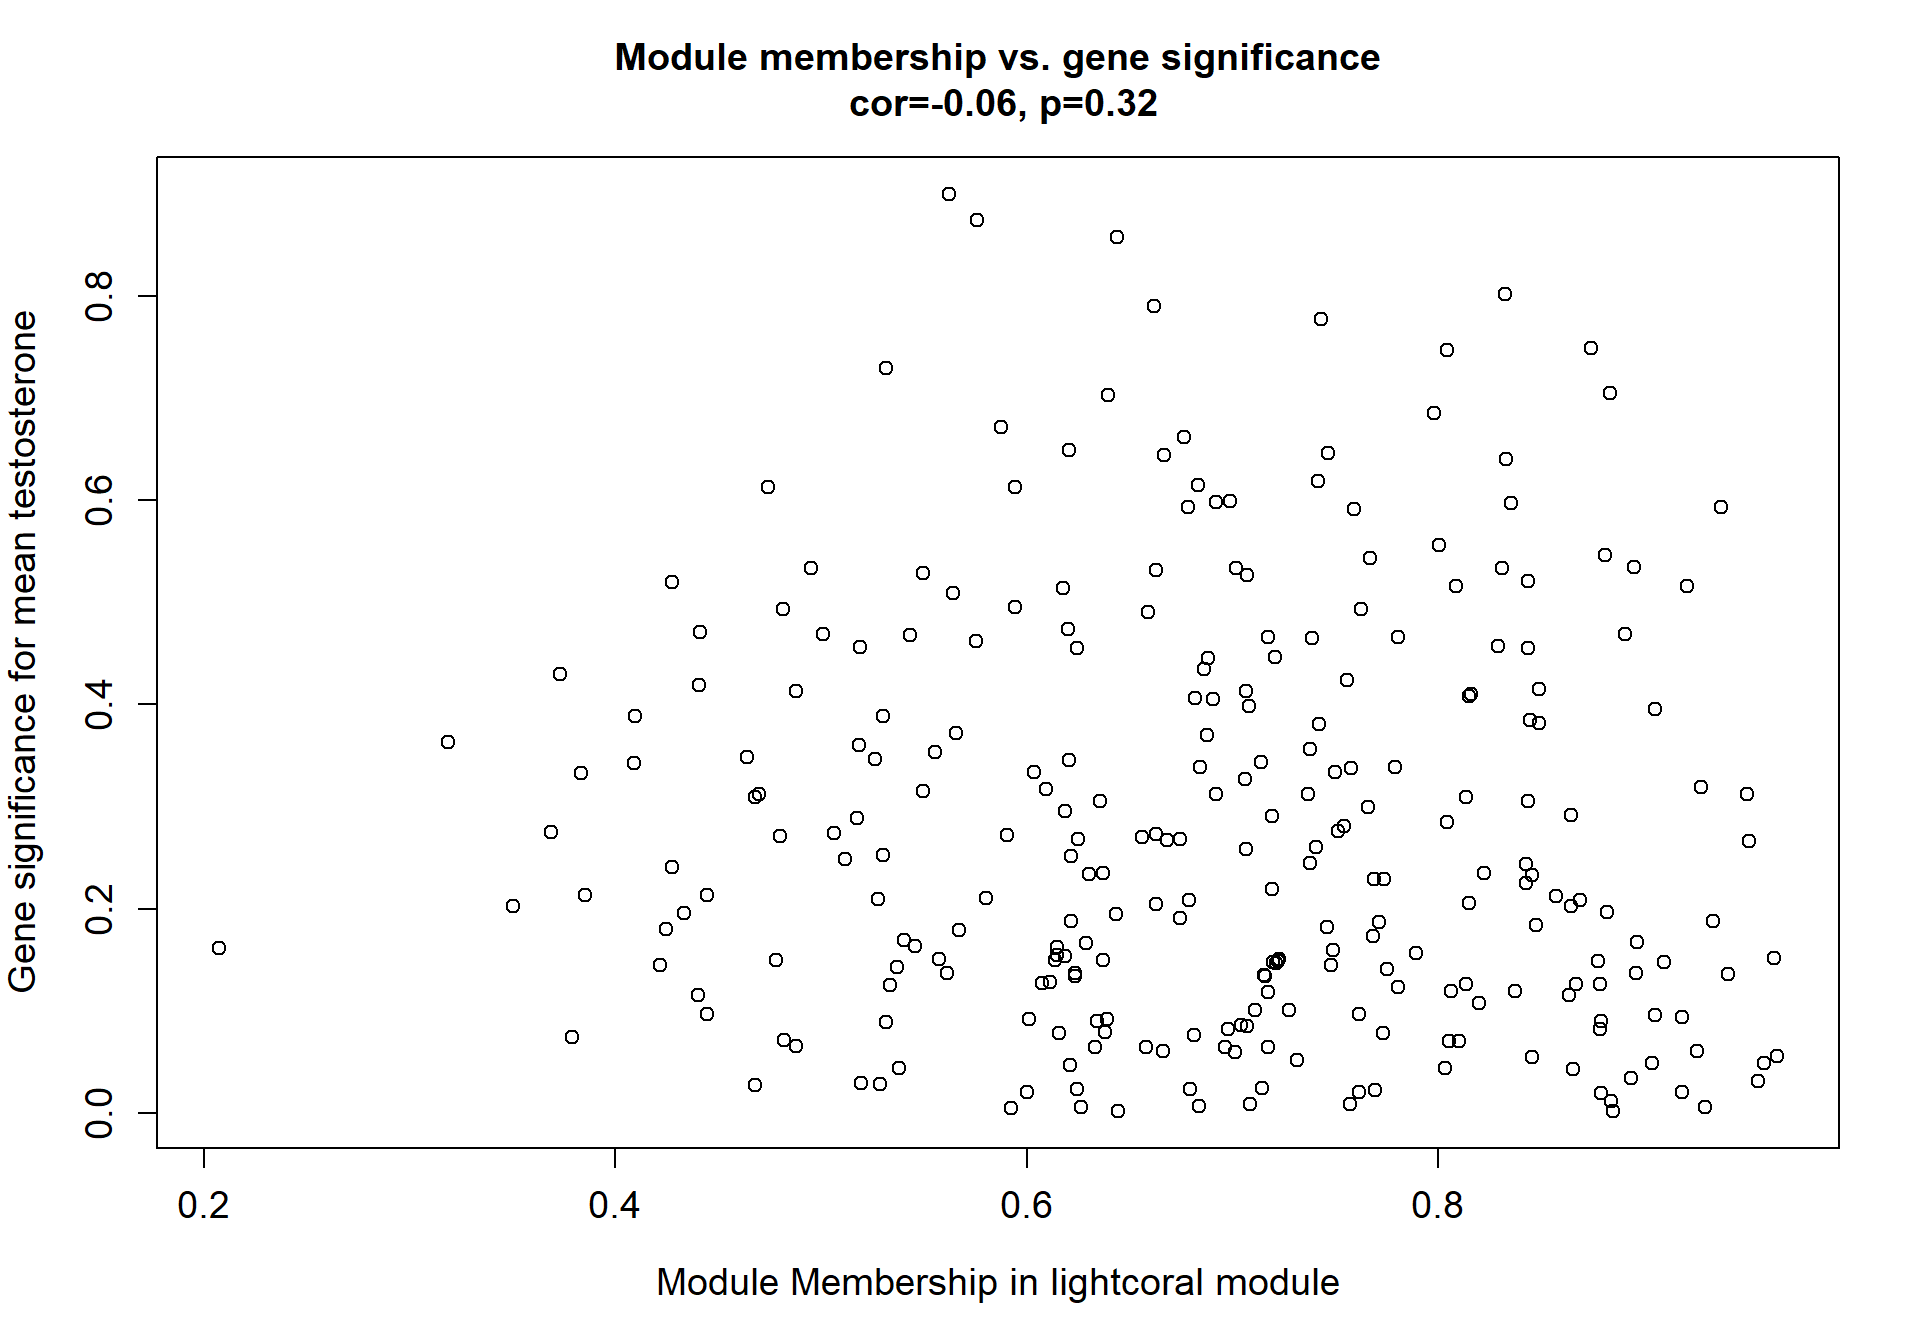
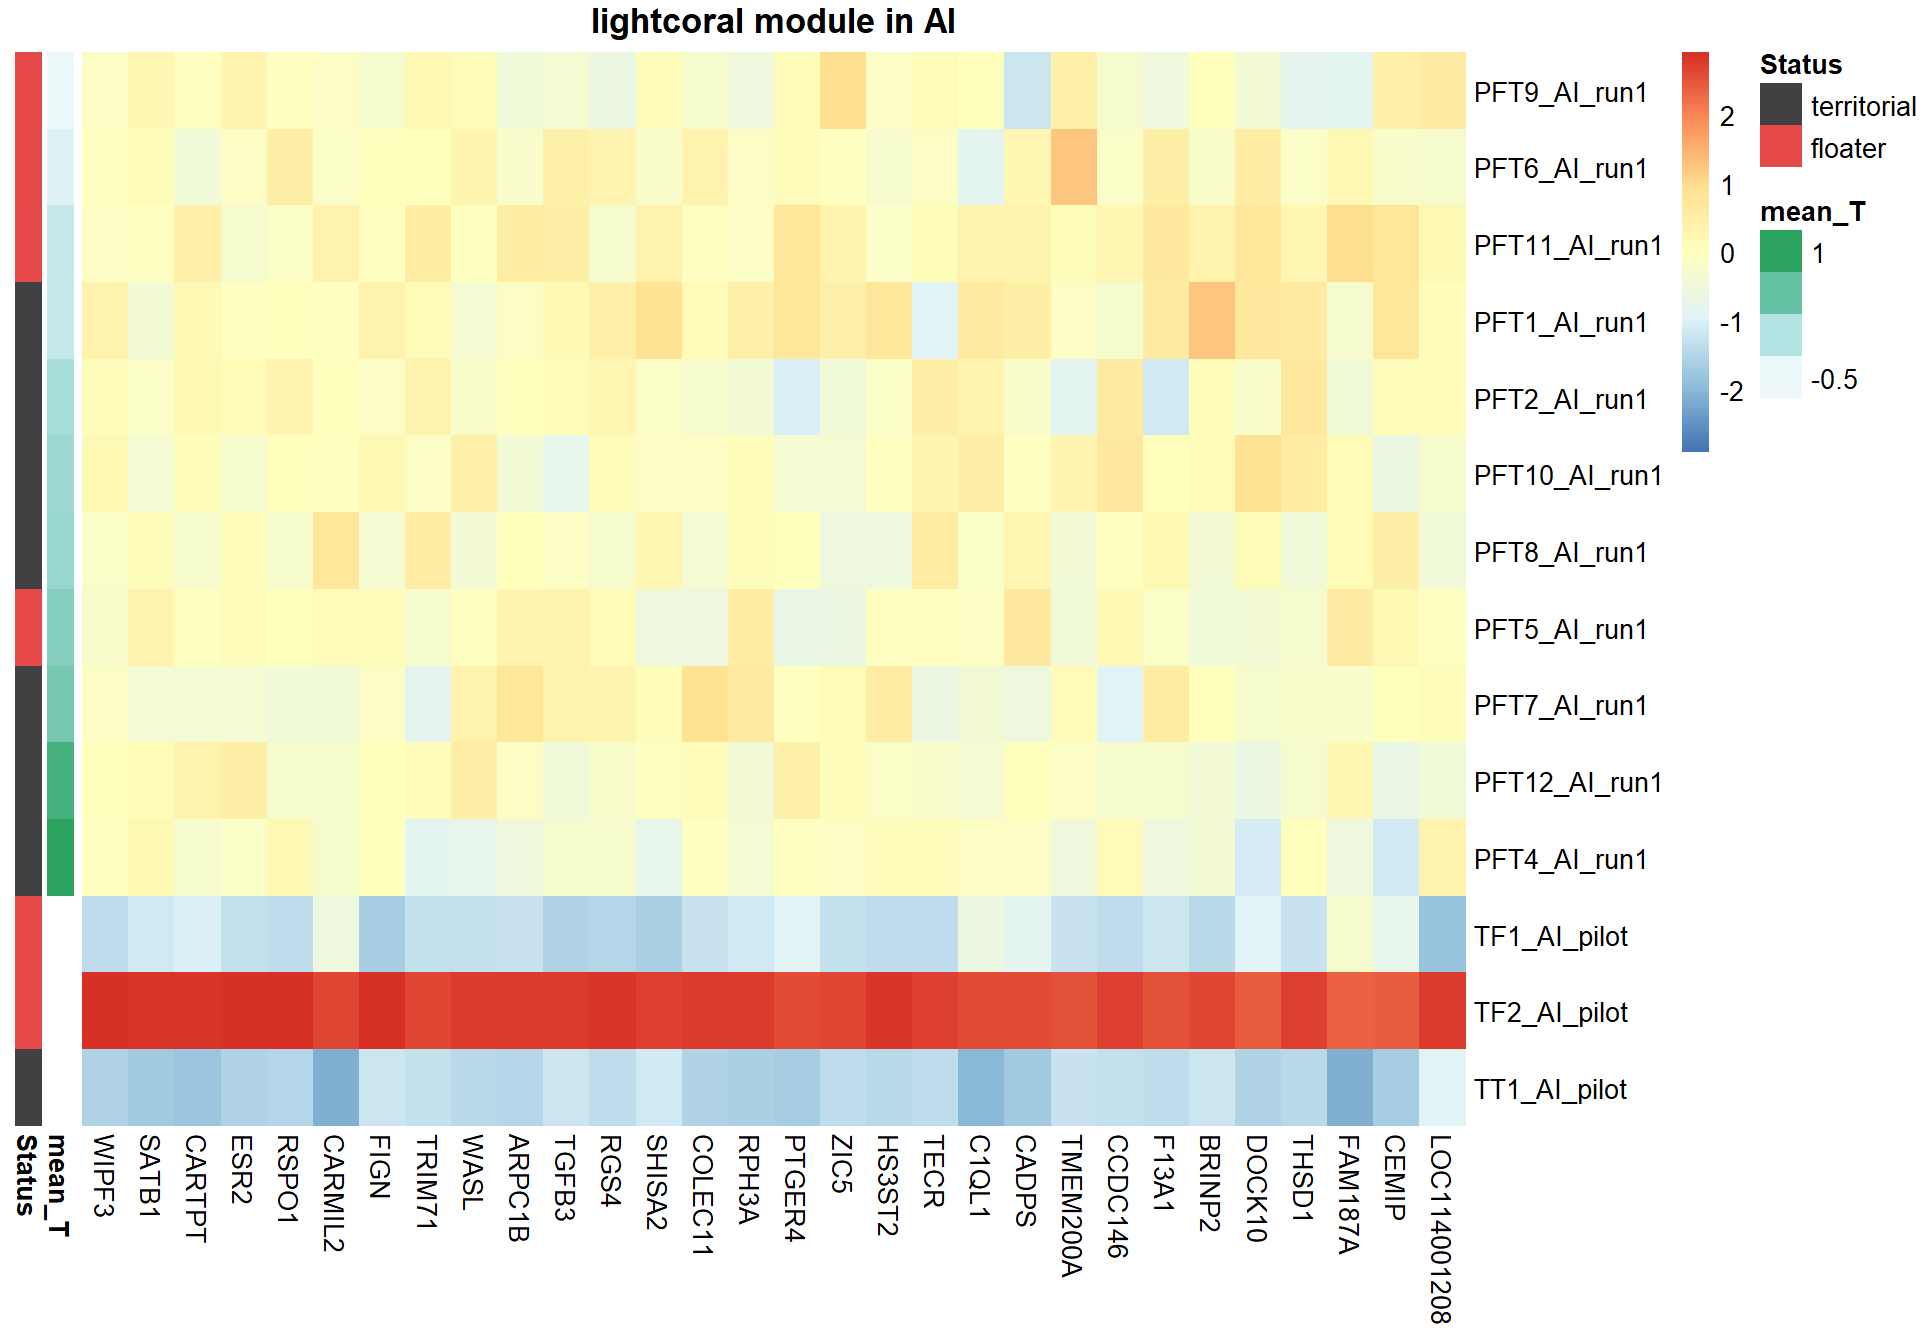
Not a convincing relationship.
11 Lateral Septum (Ls)
## [1] 14901## Warning in DESeqDataSet(se, design = design, ignoreRank): some variables in
## design formula are characters, converting to factors## estimating size factors## estimating dispersions## gene-wise dispersion estimates## mean-dispersion relationship## final dispersion estimates## fitting model and testing## -- replacing outliers and refitting for 56 genes
## -- DESeq argument 'minReplicatesForReplace' = 7
## -- original counts are preserved in counts(dds)## estimating dispersions## fitting model and testing## Power SFT.R.sq slope truncated.R.sq mean.k. median.k. max.k.
## 1 1 0.0556 39.00 0.907 7450.0 7450.00 7570
## 2 2 0.0483 -5.20 0.860 4130.0 4110.00 4480
## 3 3 0.1620 -4.09 0.900 2460.0 2450.00 3000
## 4 4 0.2850 -3.28 0.937 1560.0 1540.00 2160
## 5 5 0.4100 -2.85 0.962 1040.0 1010.00 1640
## 6 6 0.5170 -2.61 0.976 716.0 689.00 1290
## 7 7 0.6110 -2.48 0.985 510.0 483.00 1050
## 8 8 0.6900 -2.40 0.992 373.0 347.00 869
## 9 9 0.7470 -2.33 0.994 280.0 254.00 734
## 10 10 0.7940 -2.31 0.996 214.0 190.00 631
## 11 11 0.8250 -2.29 0.998 167.0 144.00 549
## 12 12 0.8450 -2.28 0.996 132.0 111.00 484
## 13 14 0.8770 -2.25 0.995 85.7 67.70 384
## 14 16 0.9000 -2.21 0.997 58.3 43.10 313
## 15 18 0.9140 -2.17 0.997 41.1 28.30 260
## 16 20 0.9240 -2.13 0.998 29.9 19.10 219
## 17 22 0.9300 -2.10 0.997 22.3 13.20 187
## 18 24 0.9340 -2.07 0.998 17.0 9.34 161
## 19 26 0.9330 -2.04 0.996 13.2 6.71 141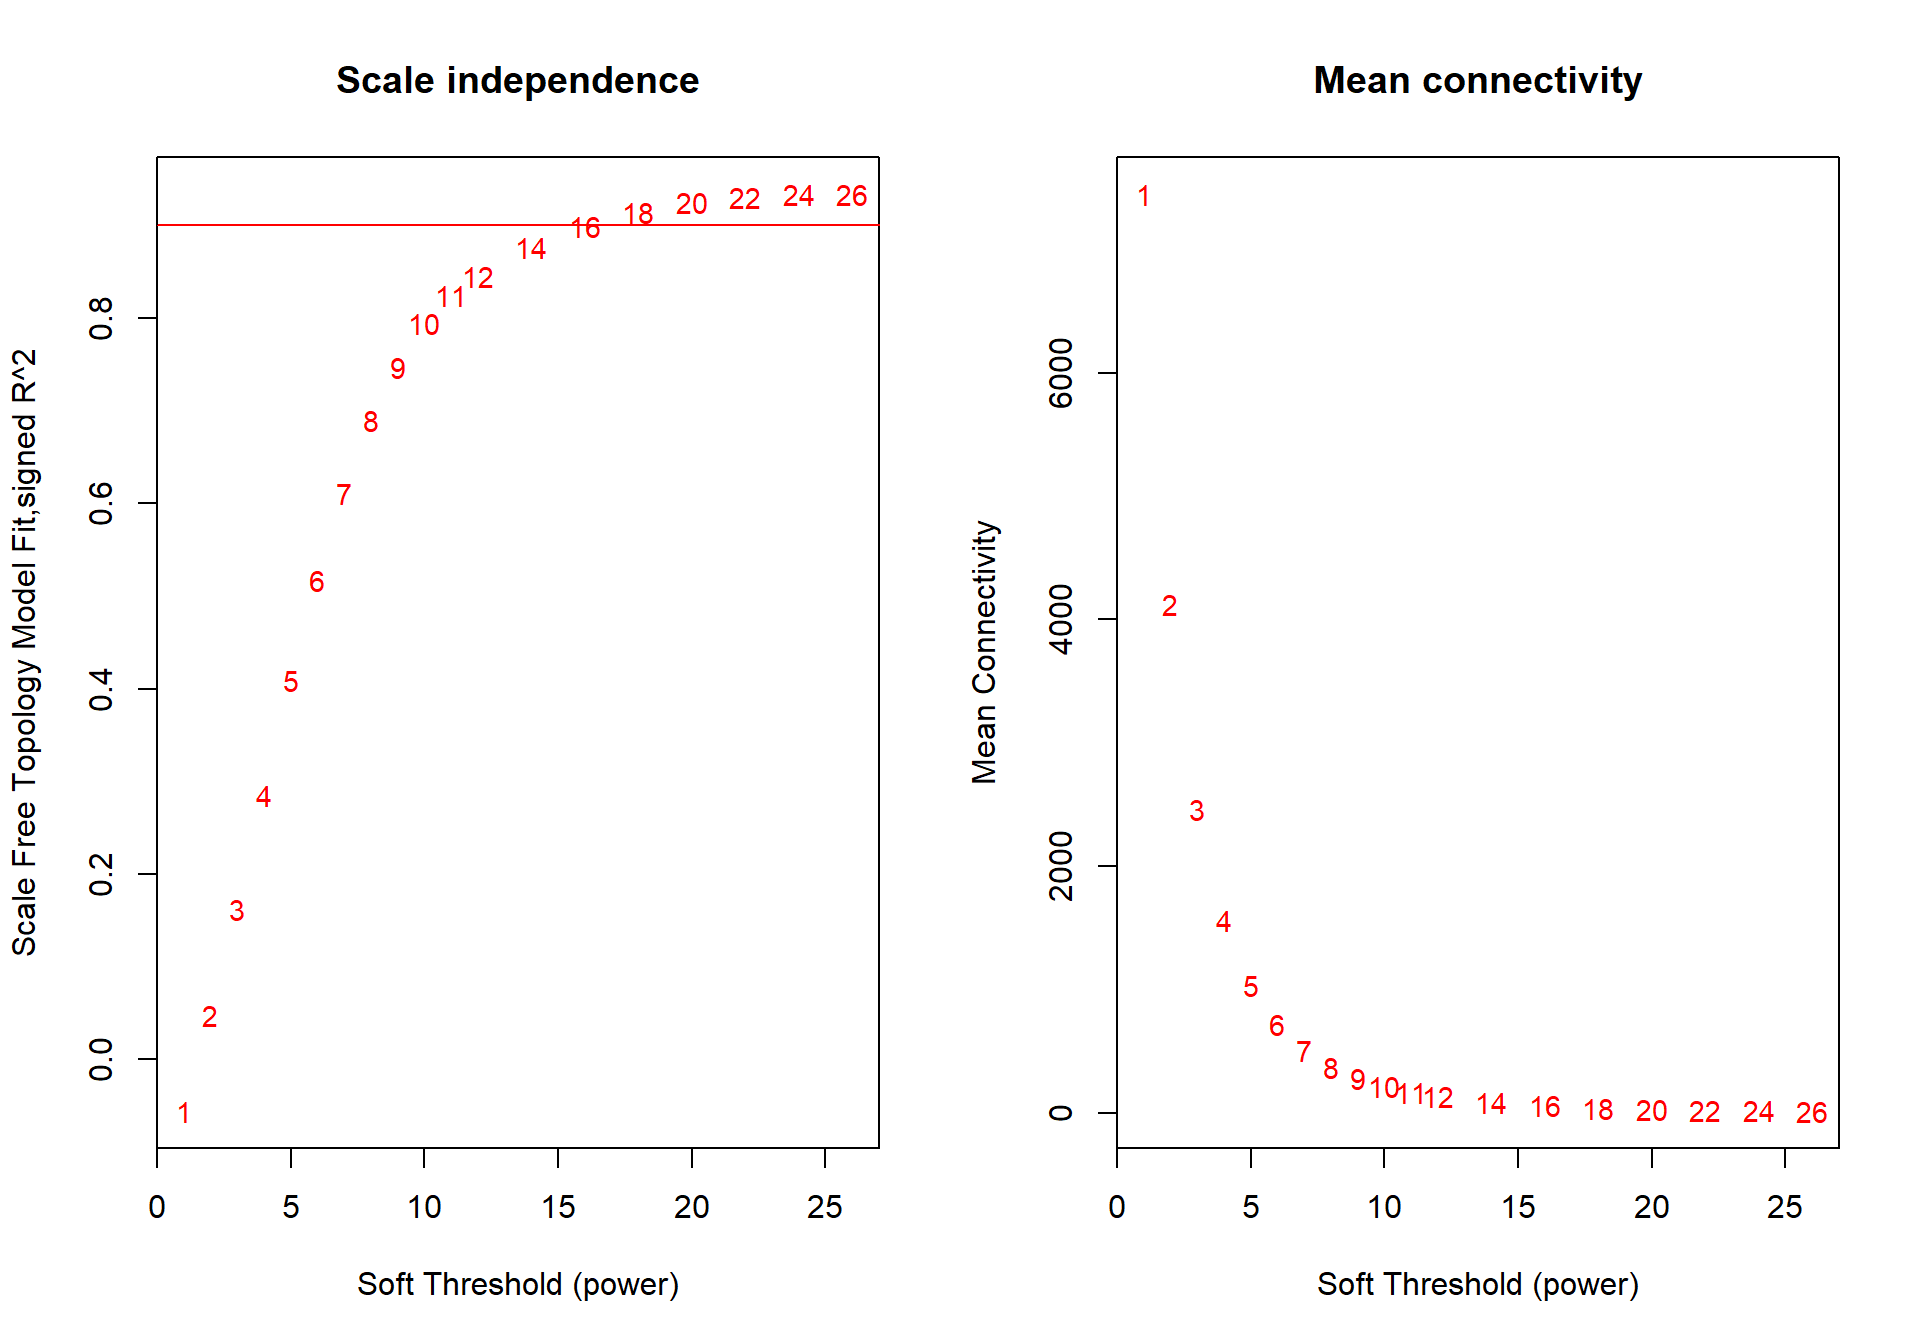
The soft-power selected for LS is 16.
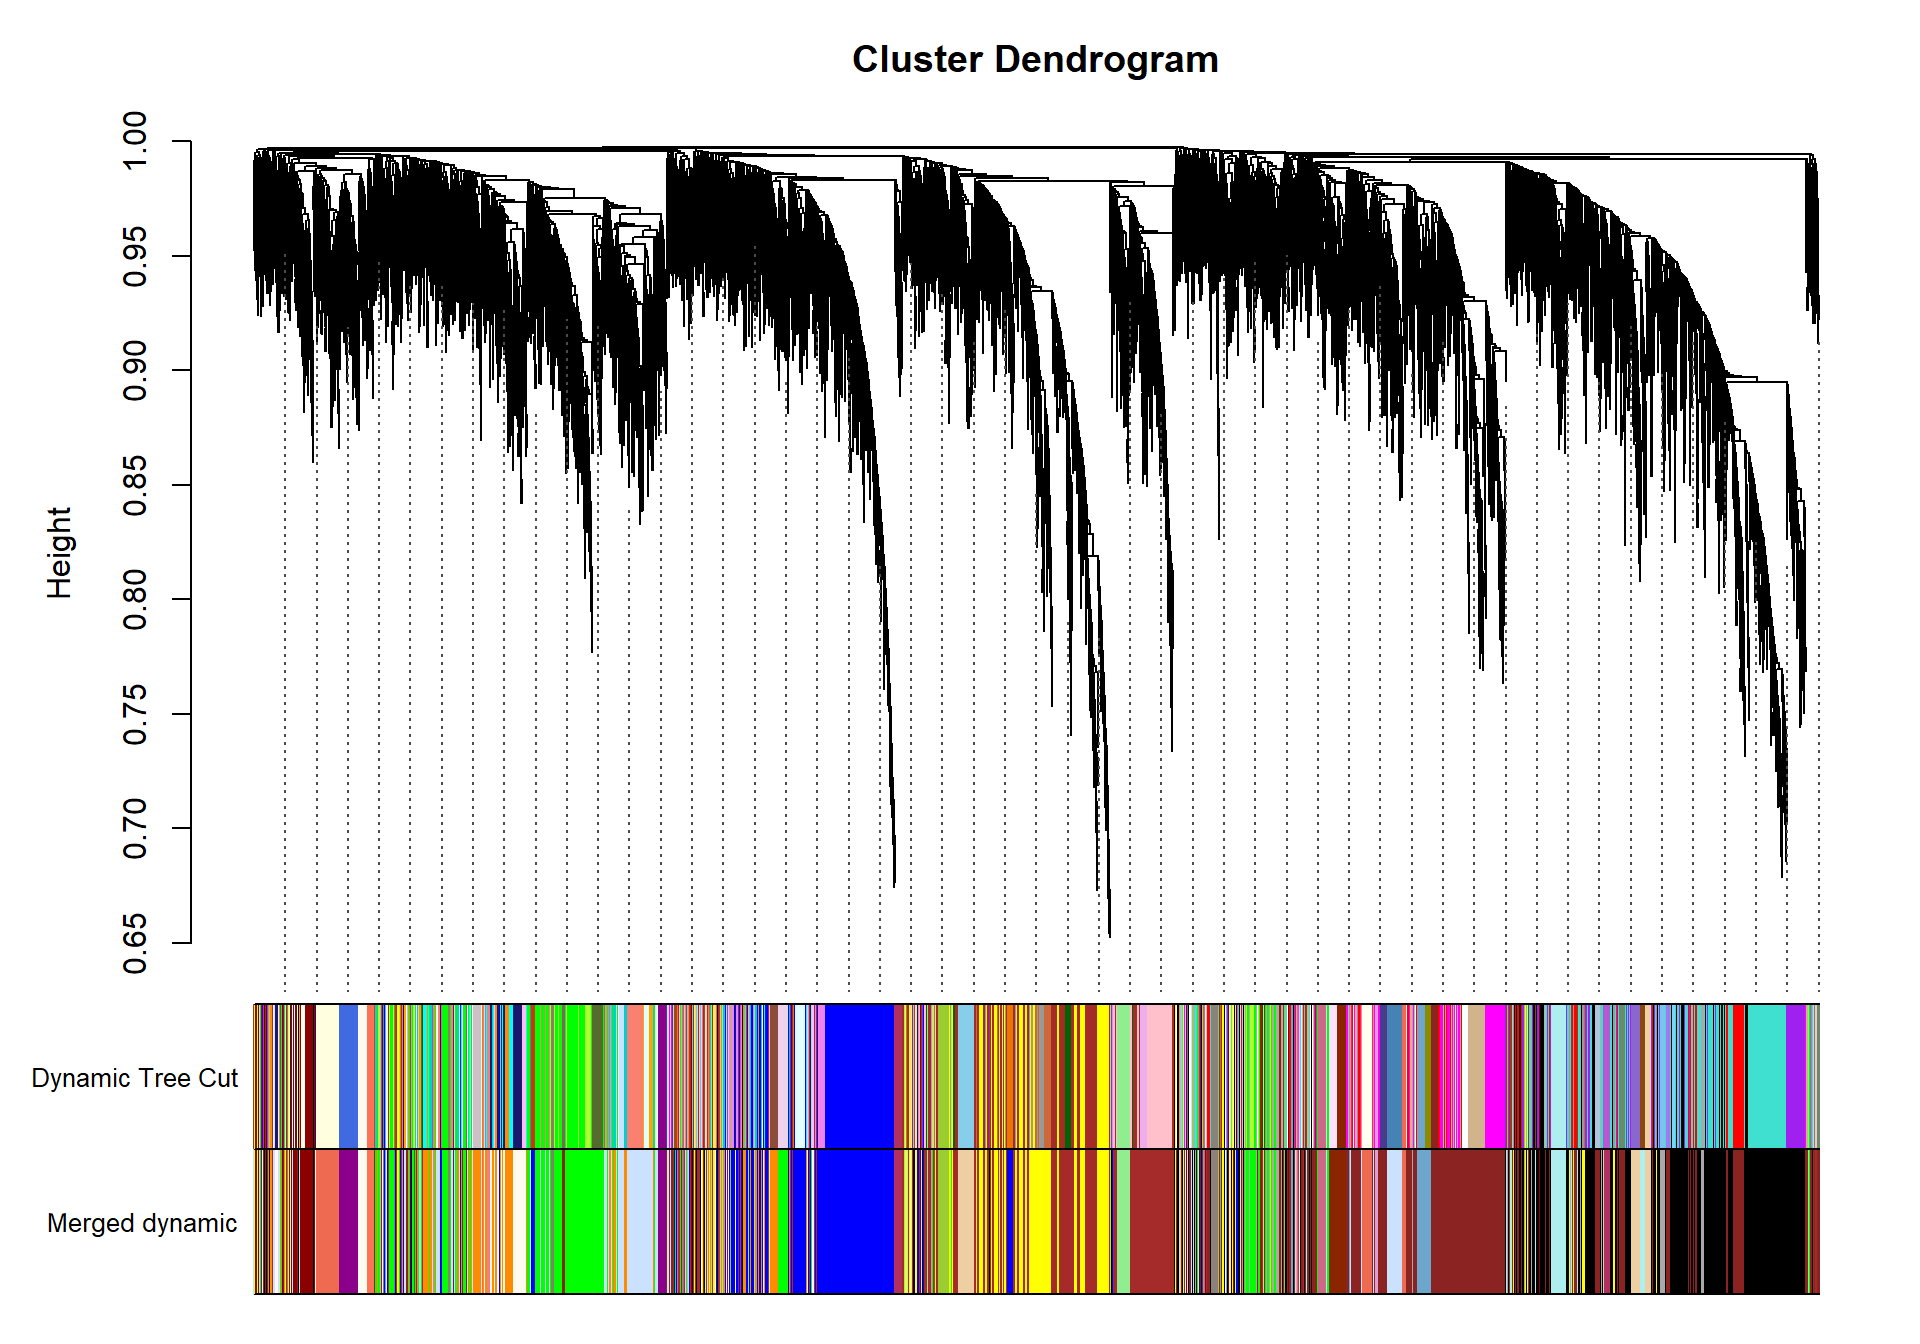
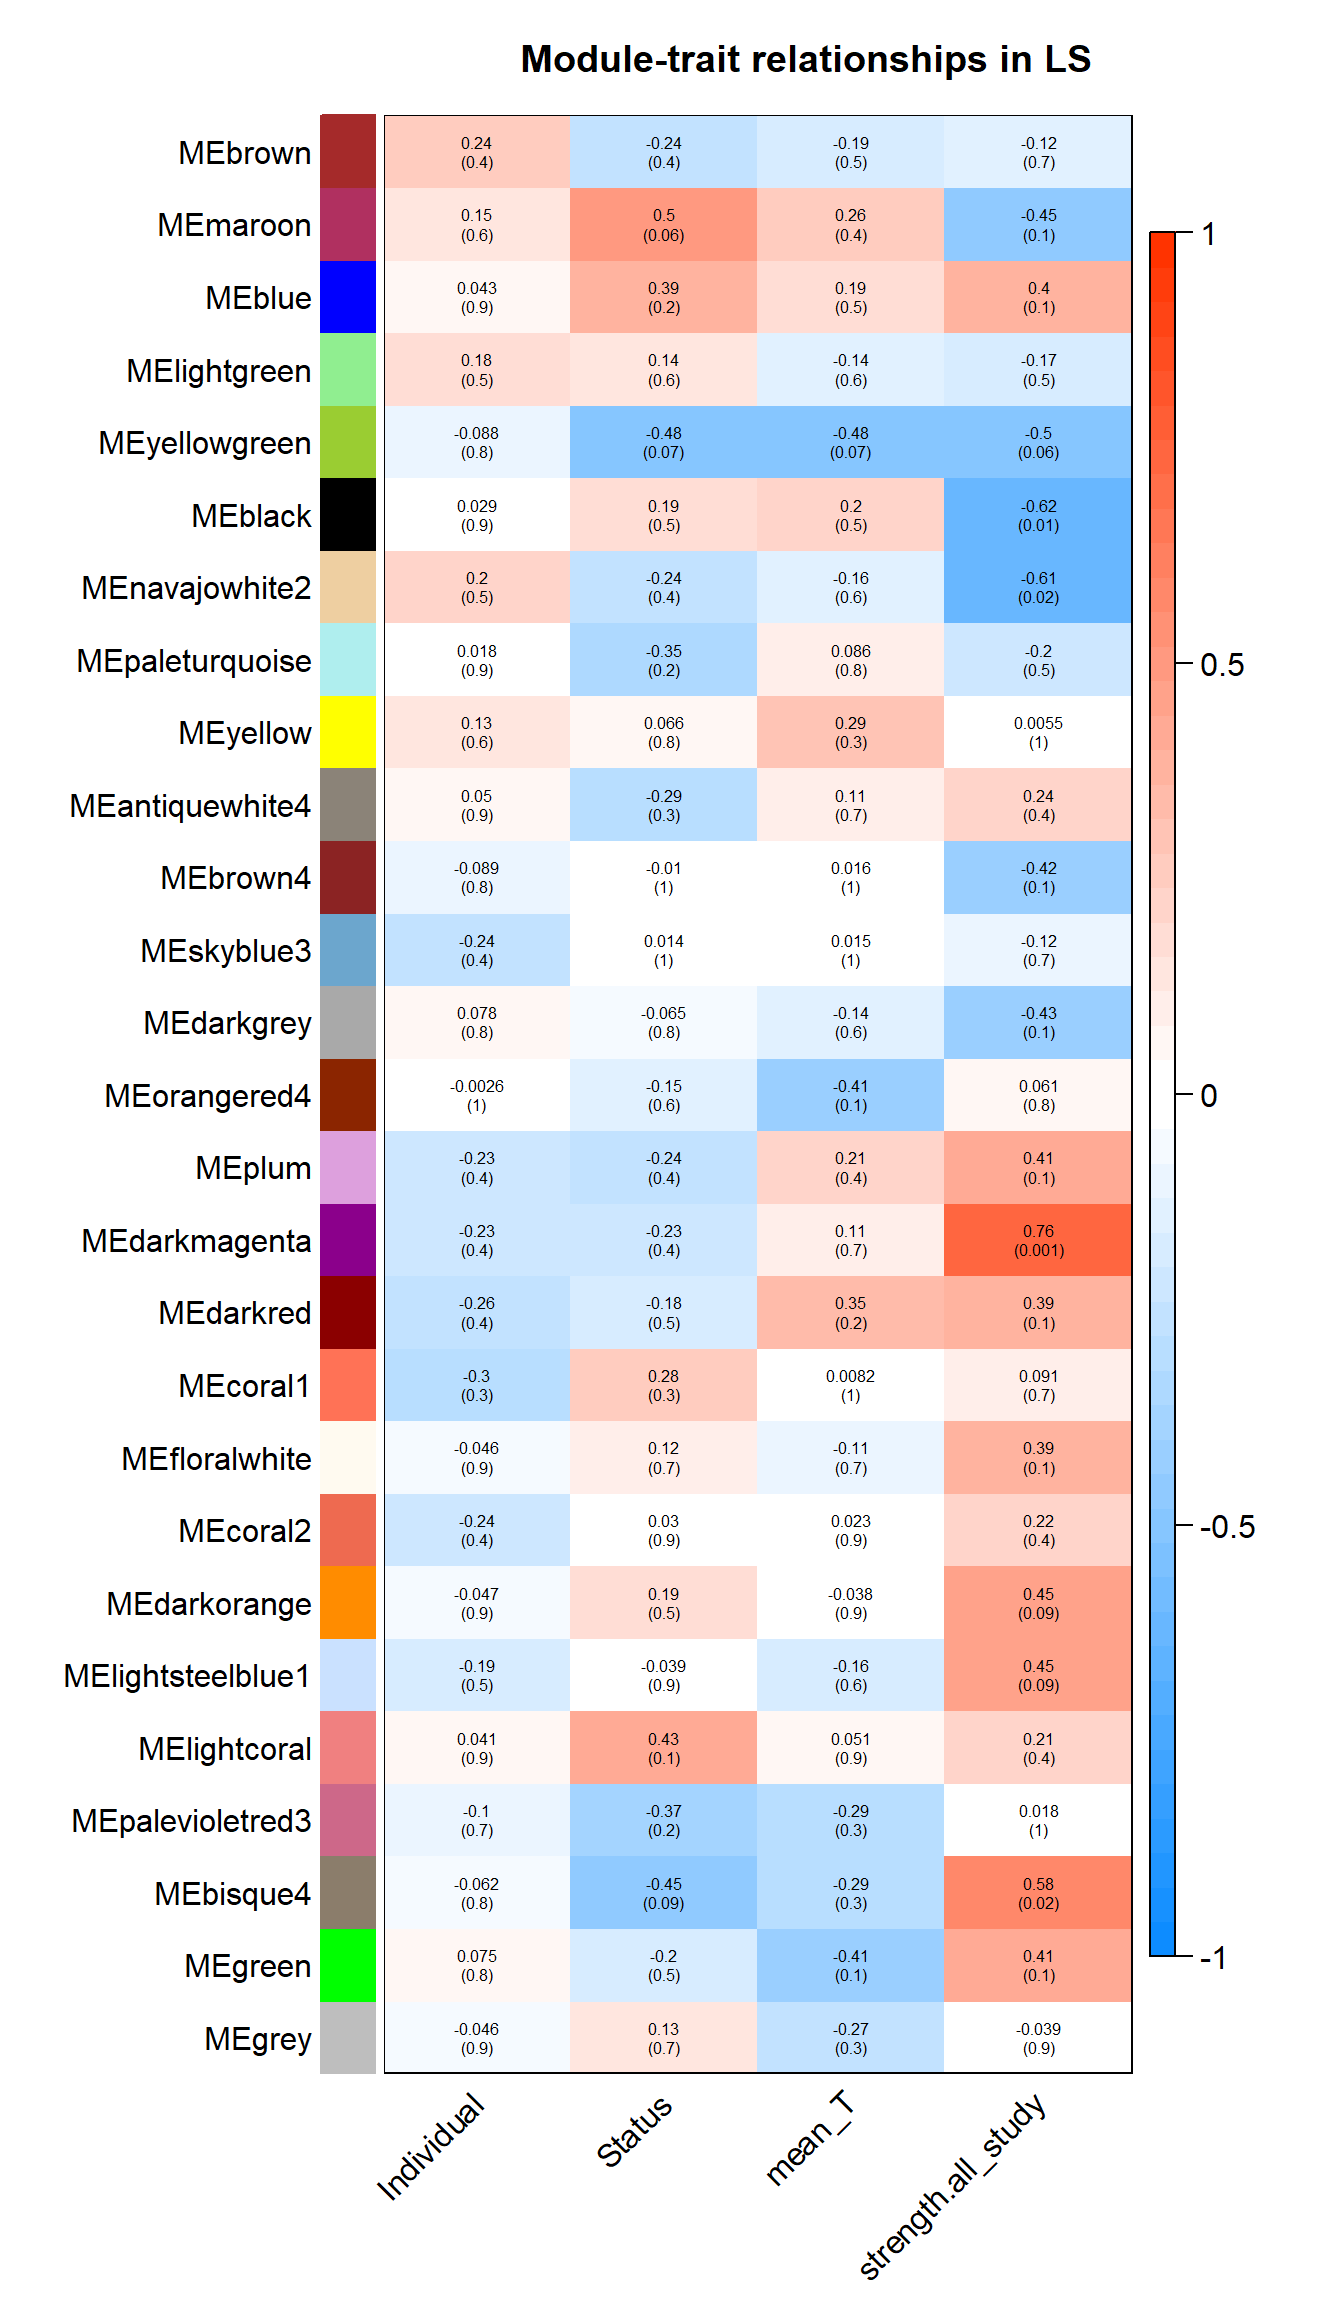
| moduleColors | Freq |
|---|---|
| antiquewhite4 | 78 |
| bisque4 | 98 |
| black | 2039 |
| blue | 1386 |
| brown | 1569 |
| brown4 | 1884 |
| coral1 | 80 |
| coral2 | 398 |
| darkgrey | 256 |
| darkmagenta | 352 |
| darkorange | 818 |
| darkred | 284 |
| floralwhite | 466 |
| green | 1271 |
| grey | 2 |
| lightcoral | 50 |
| lightgreen | 223 |
| lightsteelblue1 | 961 |
| maroon | 161 |
| navajowhite2 | 357 |
| orangered4 | 294 |
| paleturquoise | 309 |
| palevioletred3 | 90 |
| plum | 62 |
| skyblue3 | 200 |
| yellow | 1083 |
| yellowgreen | 128 |
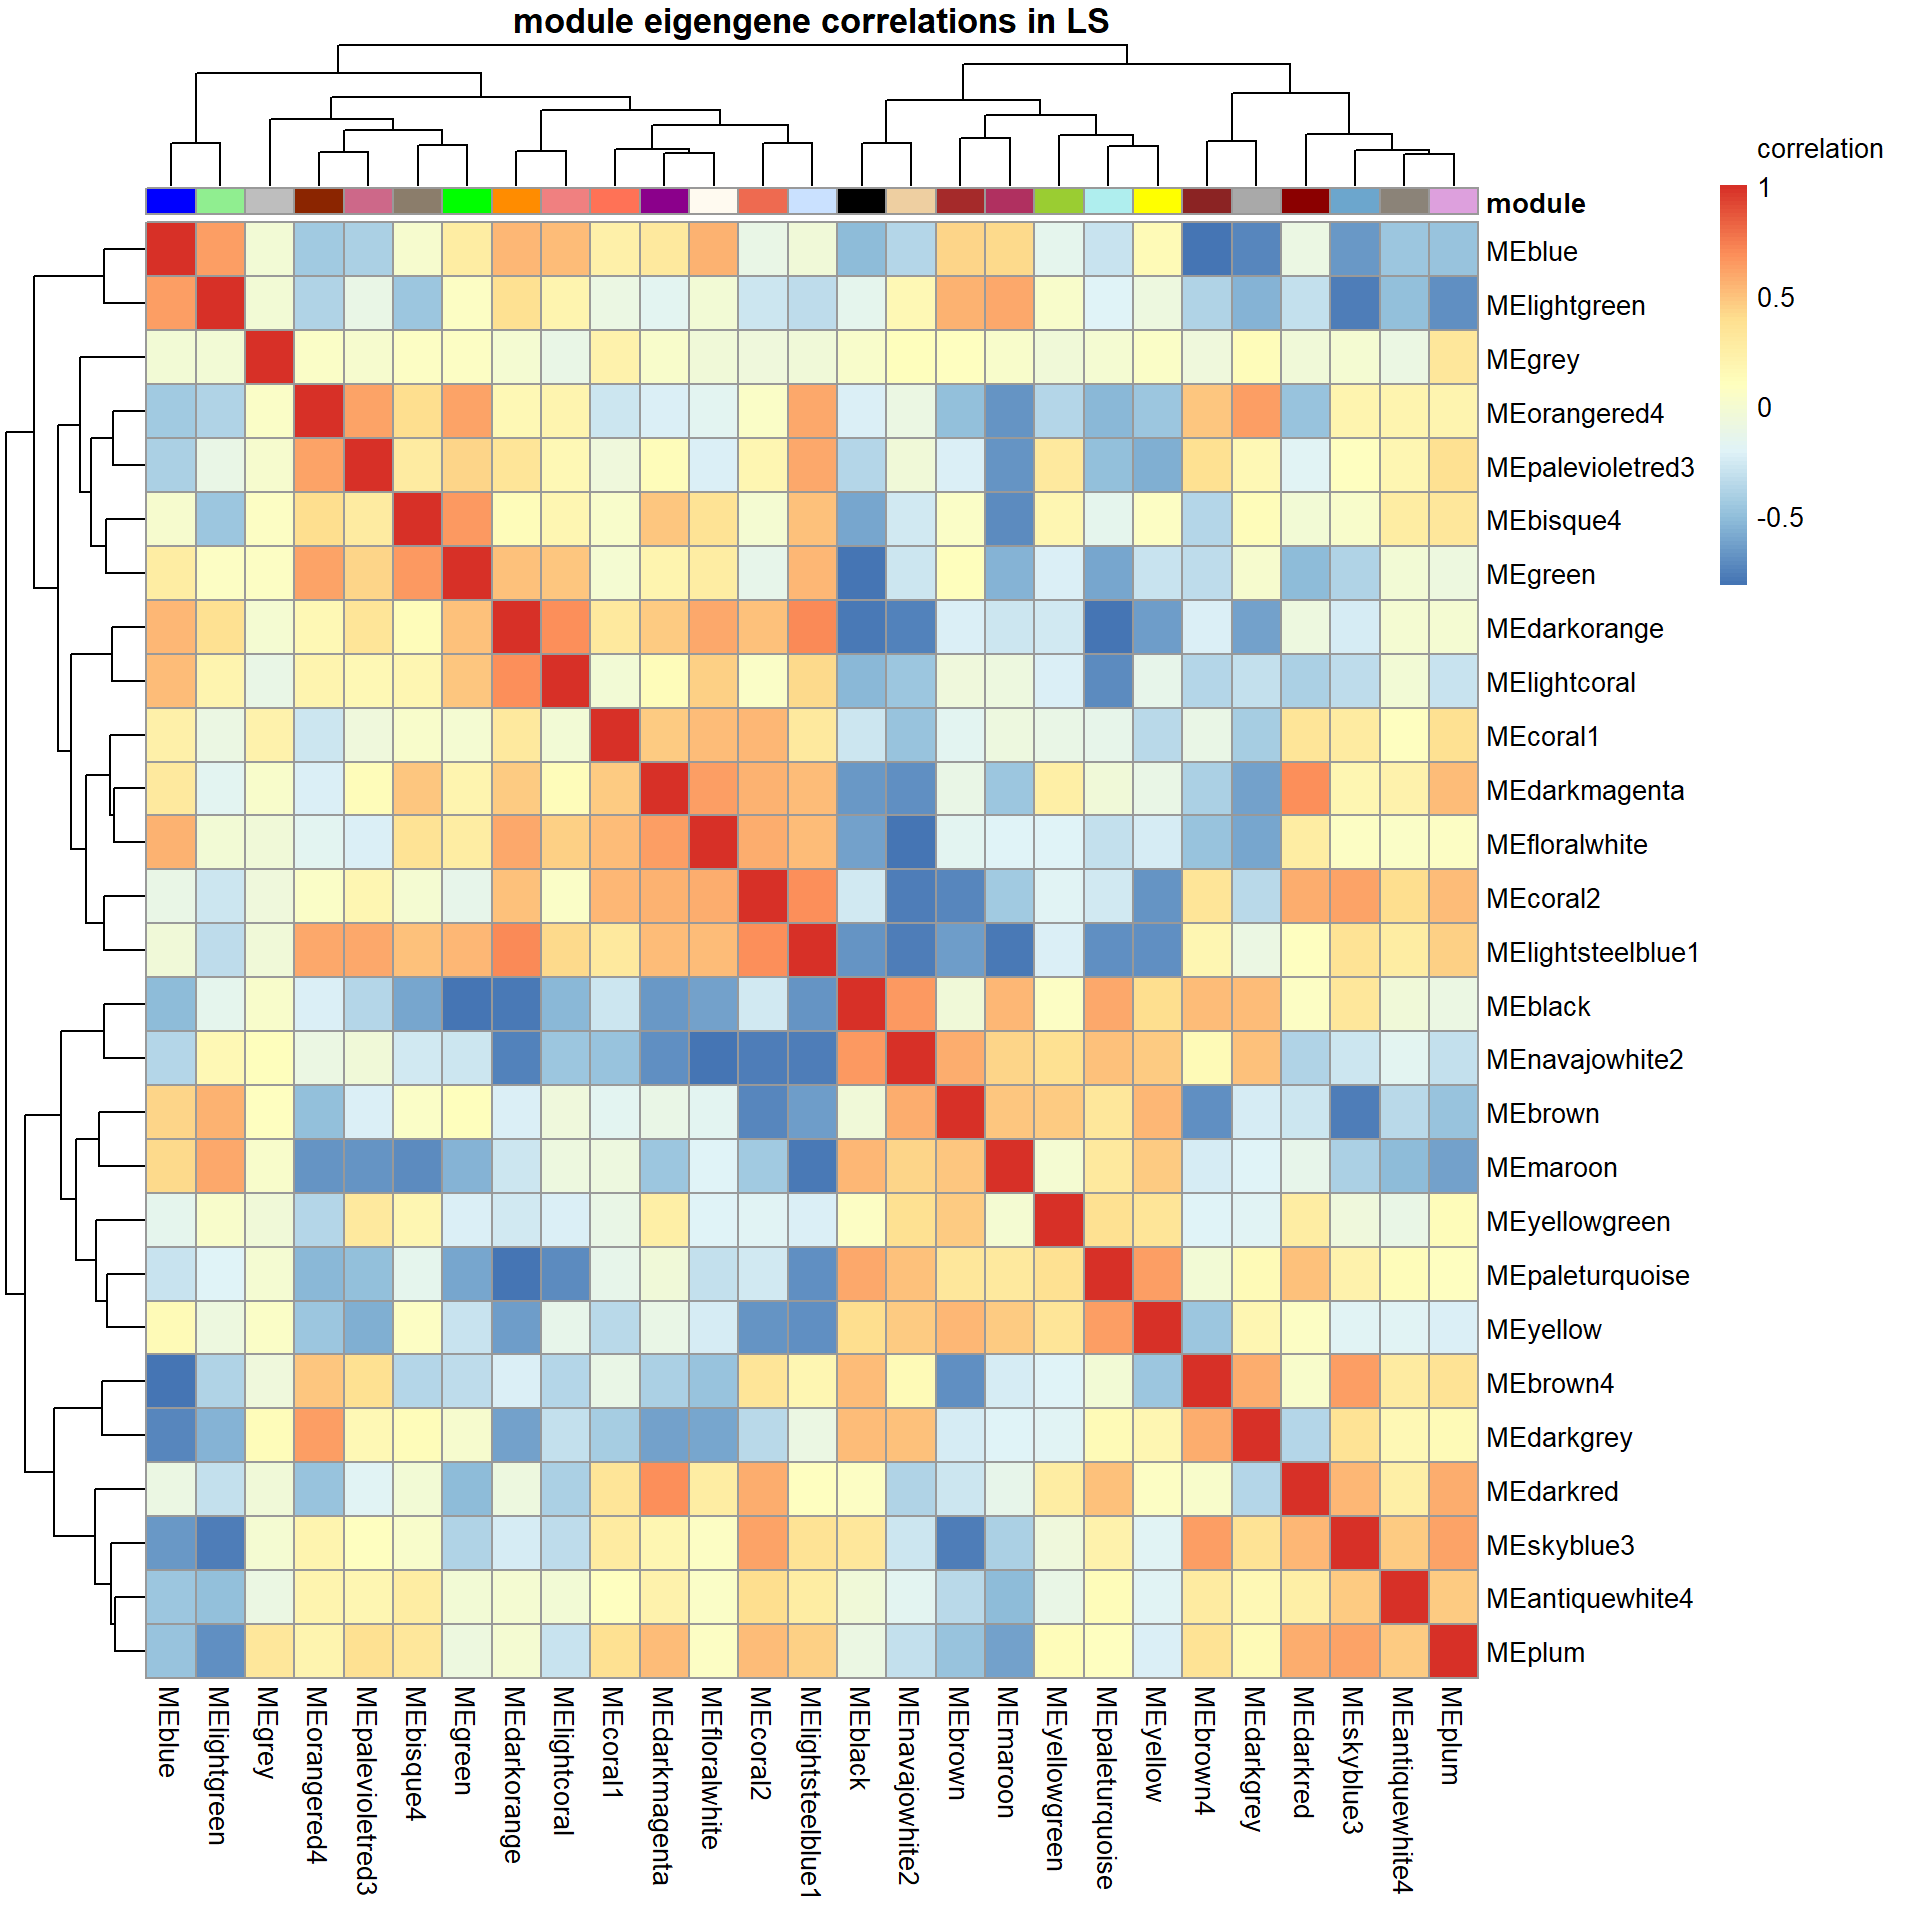
There doesn’t appear to be any obviously negative correlations with our modules of interest.
11.1 Interesting Modules
11.1.1 darkmagenta - strength
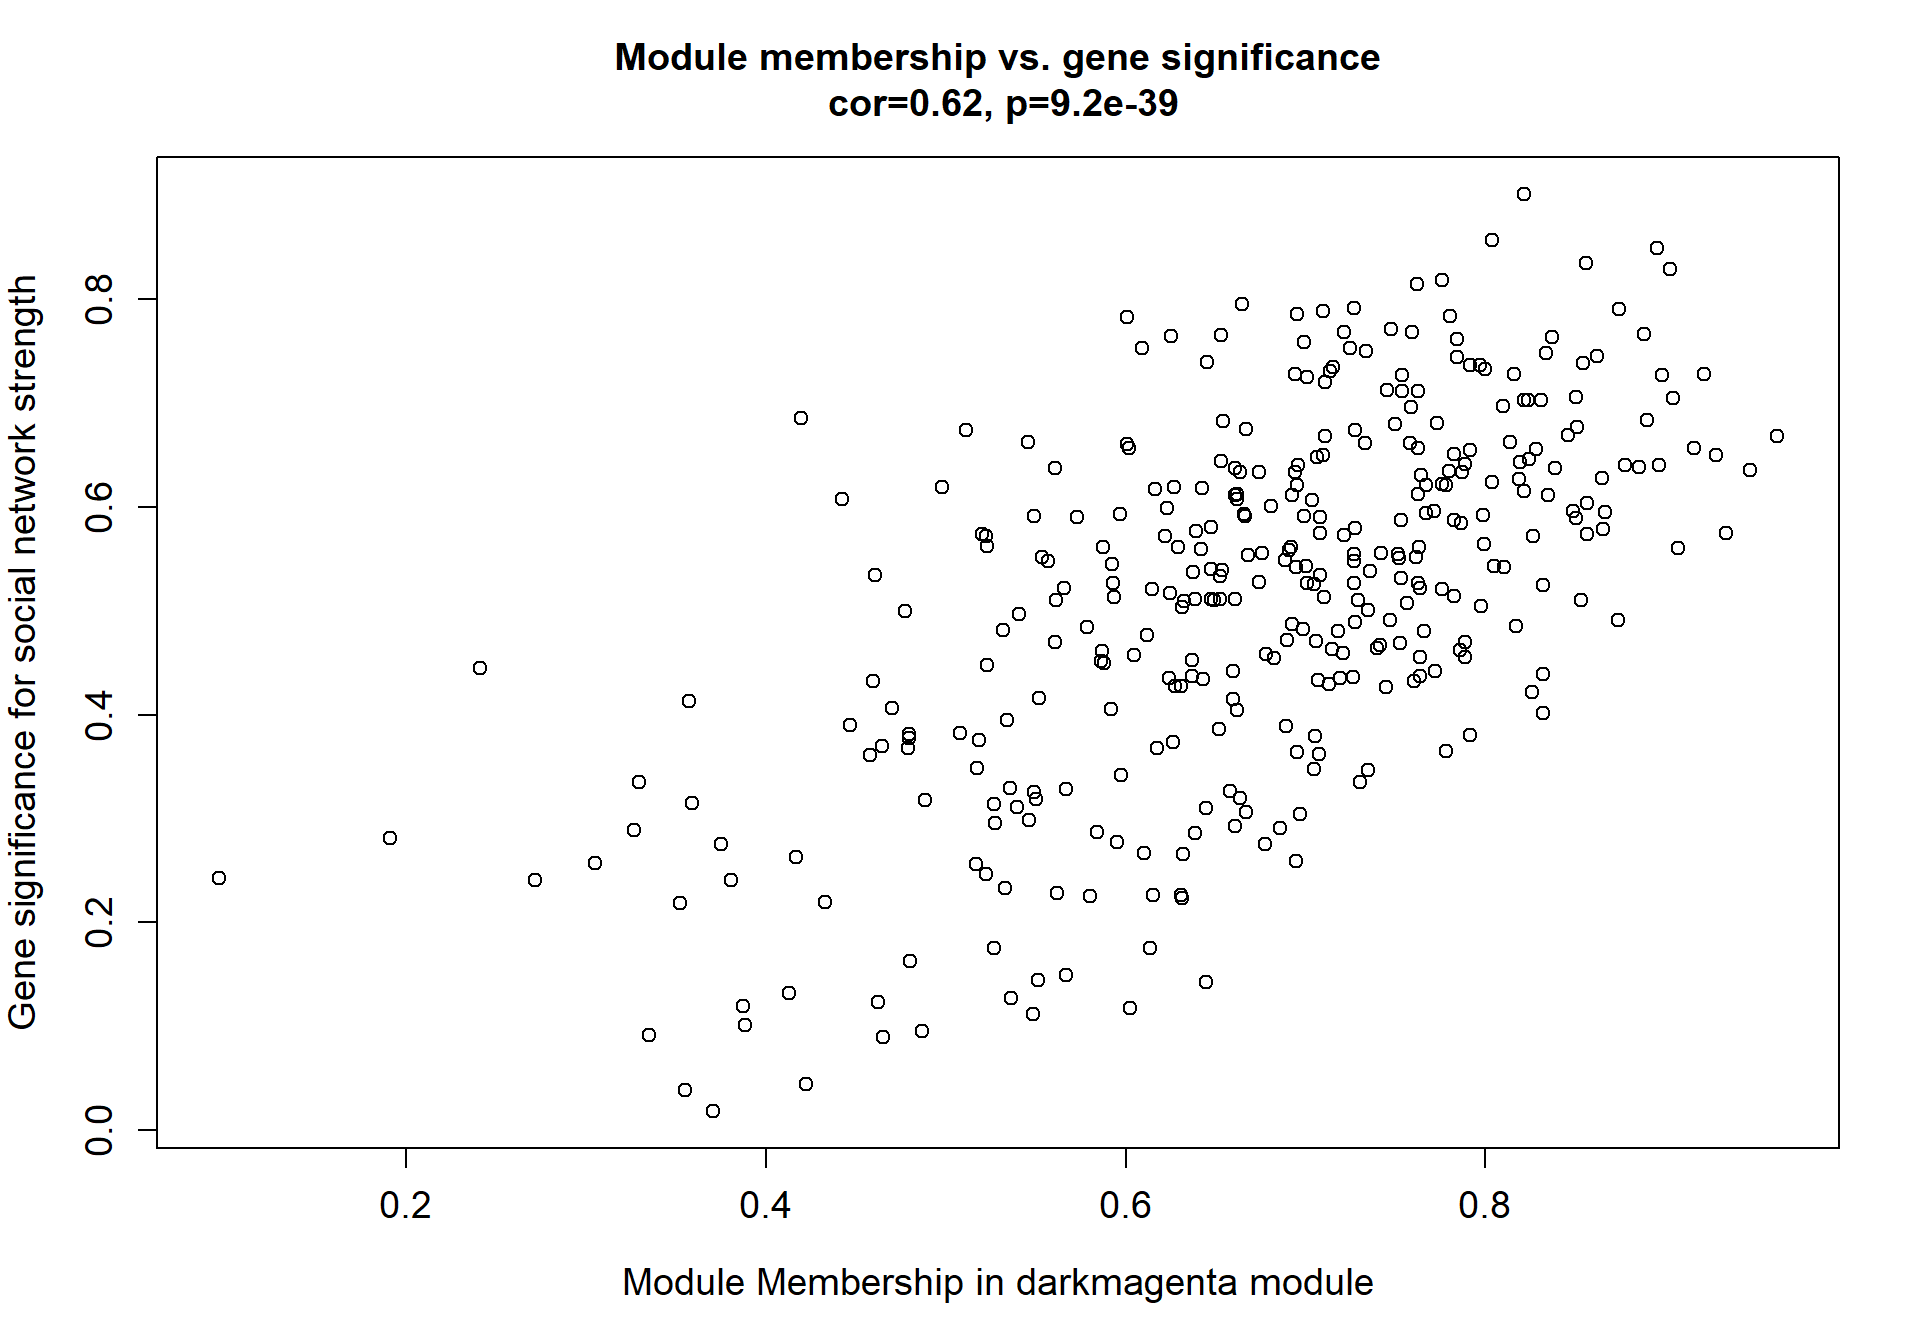
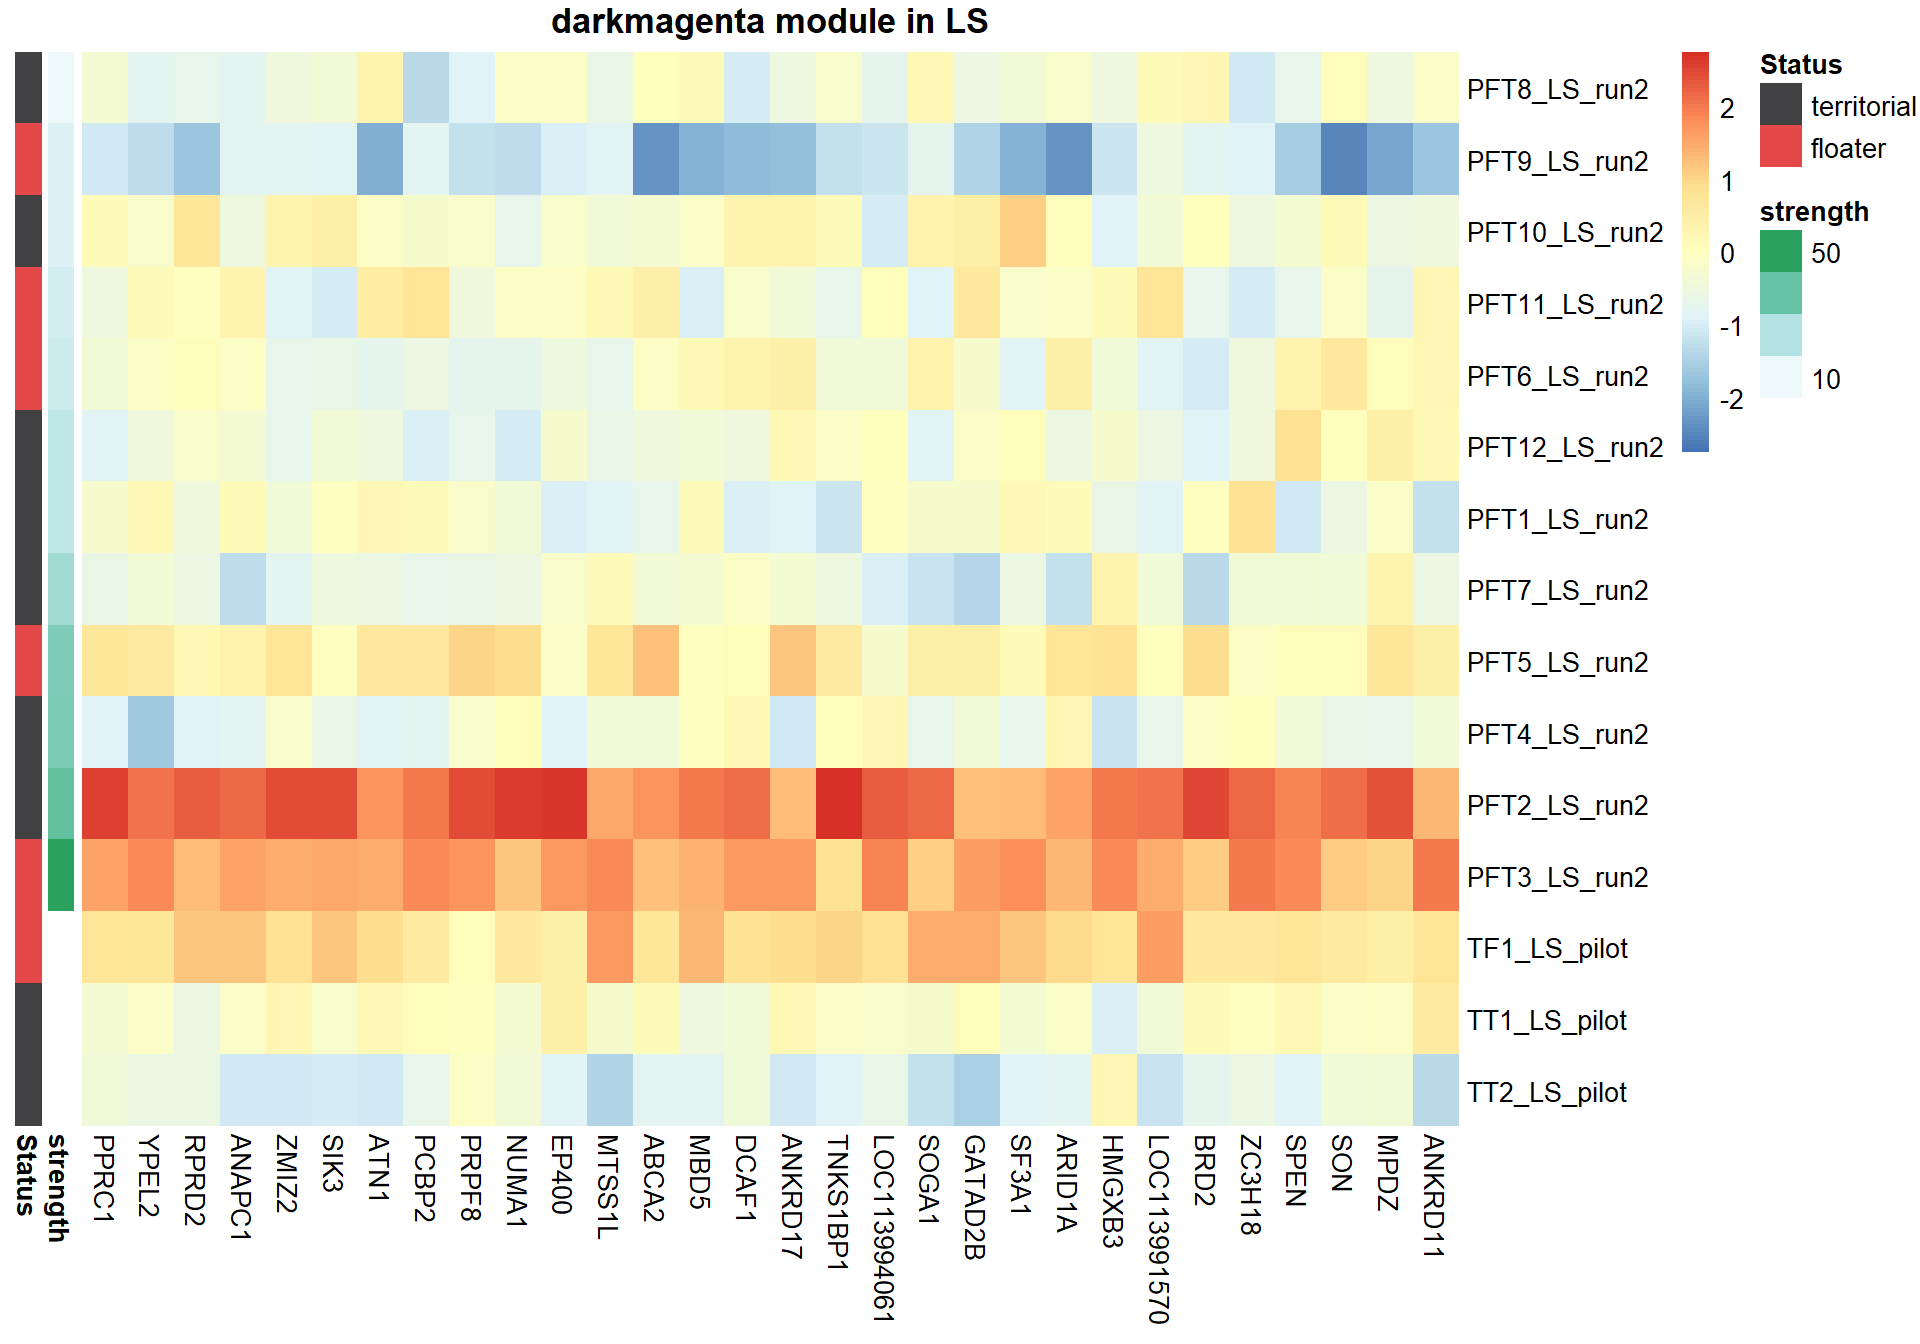
## Warning: Removed 3 rows containing missing values
## (`geom_point()`).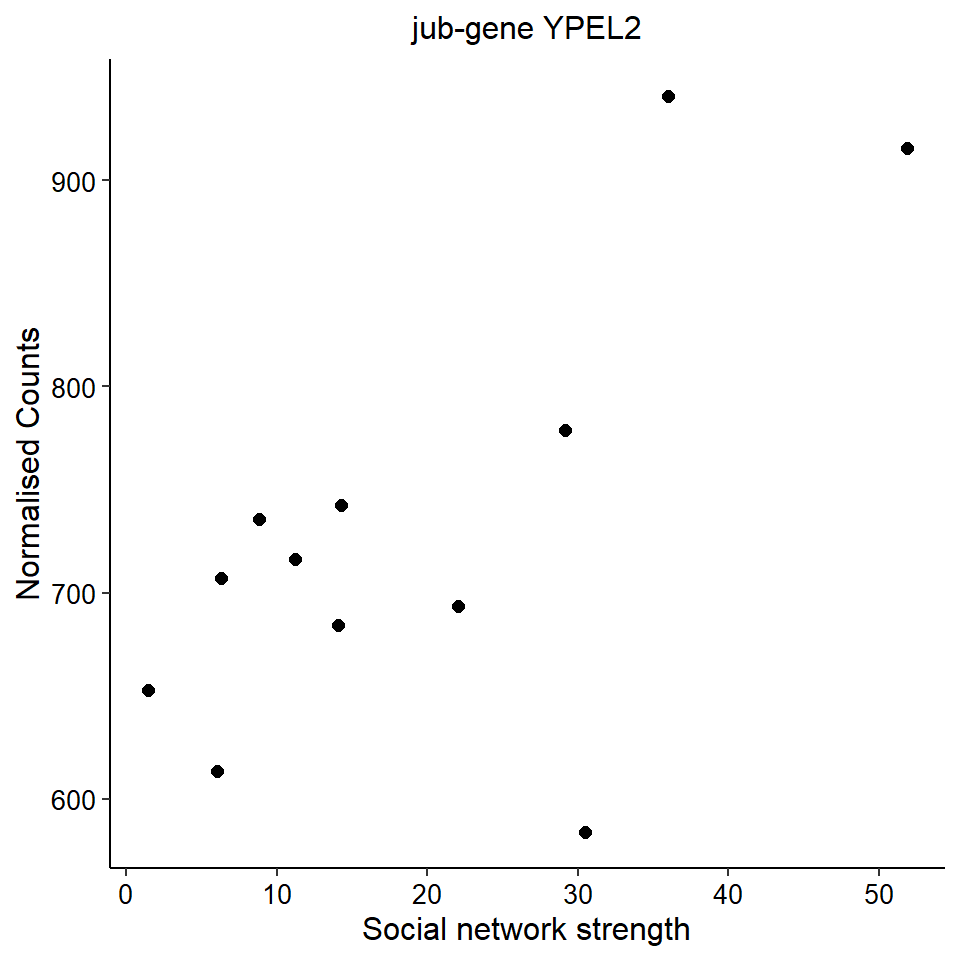
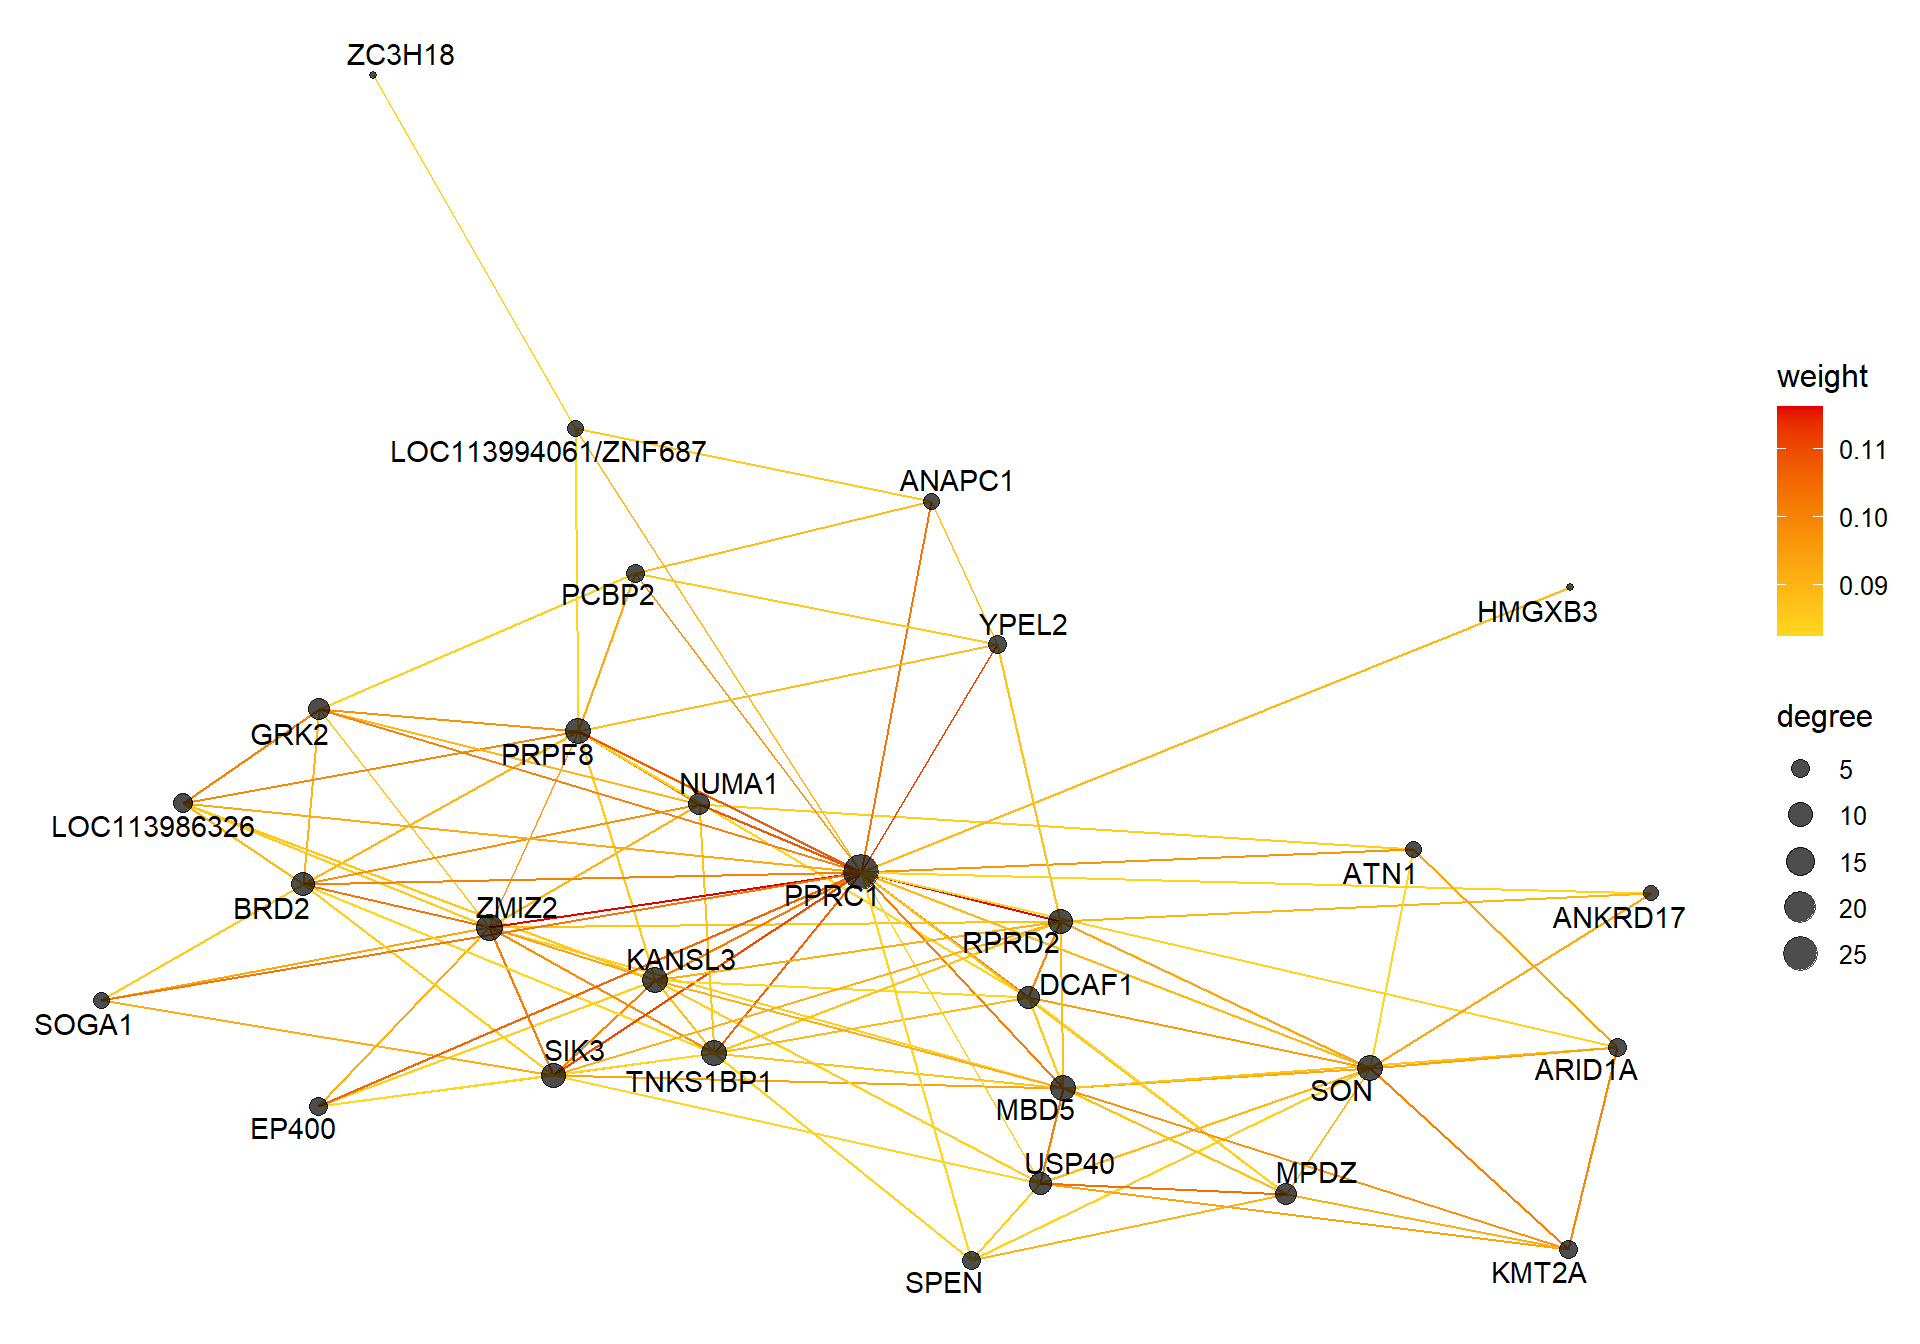
11.1.1.1 Gene Ontology
| ID | Description | GeneRatio | BgRatio | pvalue | p.adjust | qvalue | geneID | Count |
|---|---|---|---|---|---|---|---|---|
| GO:0016032 | viral process | 21/295 | 406/12091 | 0.0009823 | 0.2529708 | 0.2436046 | AAAS/ANKRD17/ATF7/BRD2/DCAF1/DNAJB12/E4F1/EP300/IL2RB/KAT2A/LOC113985512/LOC113989518/LOC113999689/LOC114003727/MPDZ/NUP214/SETD2/SPEN/SSRP1/TPR/UBR4 | 21 |
| GO:0043967 | histone H4 acetylation | 5/295 | 33/12091 | 0.0011321 | 0.2529708 | 0.2436046 | EP300/EP400/LOC113997056/LOC113998036/LOC113998501 | 5 |
| GO:0046854 | phosphatidylinositol phosphorylation | 6/295 | 50/12091 | 0.0012919 | 0.2529708 | 0.2436046 | LOC113983741/LOC113988212/LOC113992314/PI4K2A/PIK3R2/SOCS7 | 6 |
| GO:0045652 | regulation of megakaryocyte differentiation | 5/295 | 35/12091 | 0.0014882 | 0.2529708 | 0.2436046 | EP300/KMT2A/L3MBTL1/TNRC6B/TNRC6C | 5 |
| GO:0035194 | post-transcriptional gene silencing by RNA | 3/295 | 10/12091 | 0.0015190 | 0.2529708 | 0.2436046 | HELZ/TNRC6B/TNRC6C | 3 |
| GO:0051726 | regulation of cell cycle | 8/295 | 96/12091 | 0.0023630 | 0.2529708 | 0.2436046 | BOP1/CSNK2A2/EP300/HIPK2/L3MBTL1/NUP214/PRDM11/SON | 8 |
| GO:0010761 | fibroblast migration | 3/295 | 12/12091 | 0.0026857 | 0.2529708 | 0.2436046 | ARID5B/LOC113988212/LOC113992314 | 3 |
| GO:0006110 | regulation of glycolytic process | 5/295 | 40/12091 | 0.0027317 | 0.2529708 | 0.2436046 | AAAS/EP300/LOC113999689/NUP214/TPR | 5 |
| GO:0007595 | lactation | 5/295 | 42/12091 | 0.0033944 | 0.2529708 | 0.2436046 | CAD/LOC113997056/LOC113998036/MED1/NCOR2 | 5 |
| GO:0019827 | stem cell population maintenance | 5/295 | 42/12091 | 0.0033944 | 0.2529708 | 0.2436046 | EIF4ENIF1/LOC113993147/LOC113999502/MED30/RIF1 | 5 |
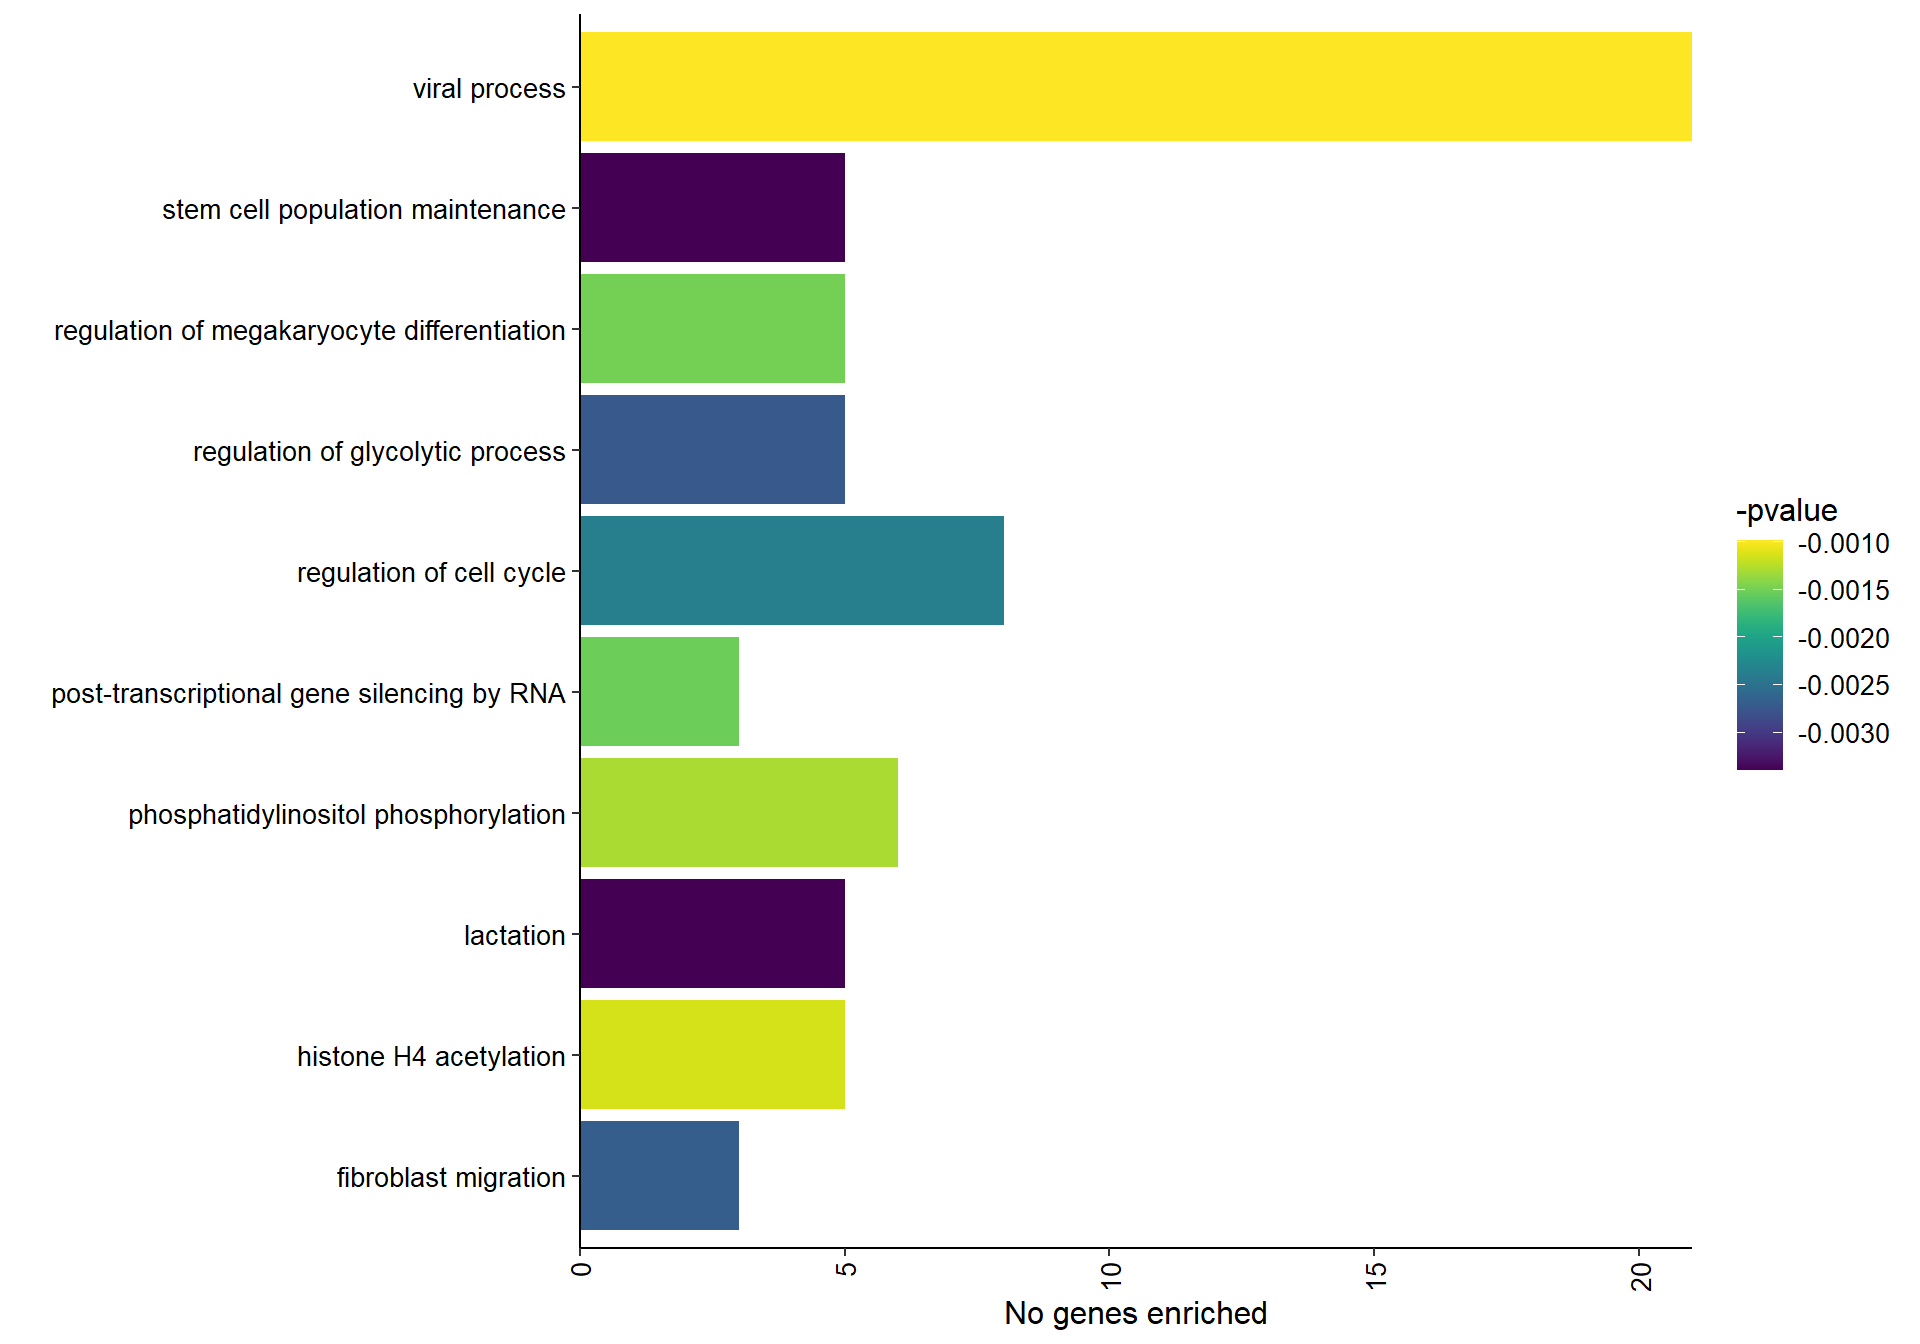
## preparing gene to GO mapping data...## preparing IC data...## Warning in if (class(try(col2rgb(palette), silent = TRUE)) == "try-error")
## stop("color palette is not correct"): the condition has length > 1 and only the
## first element will be used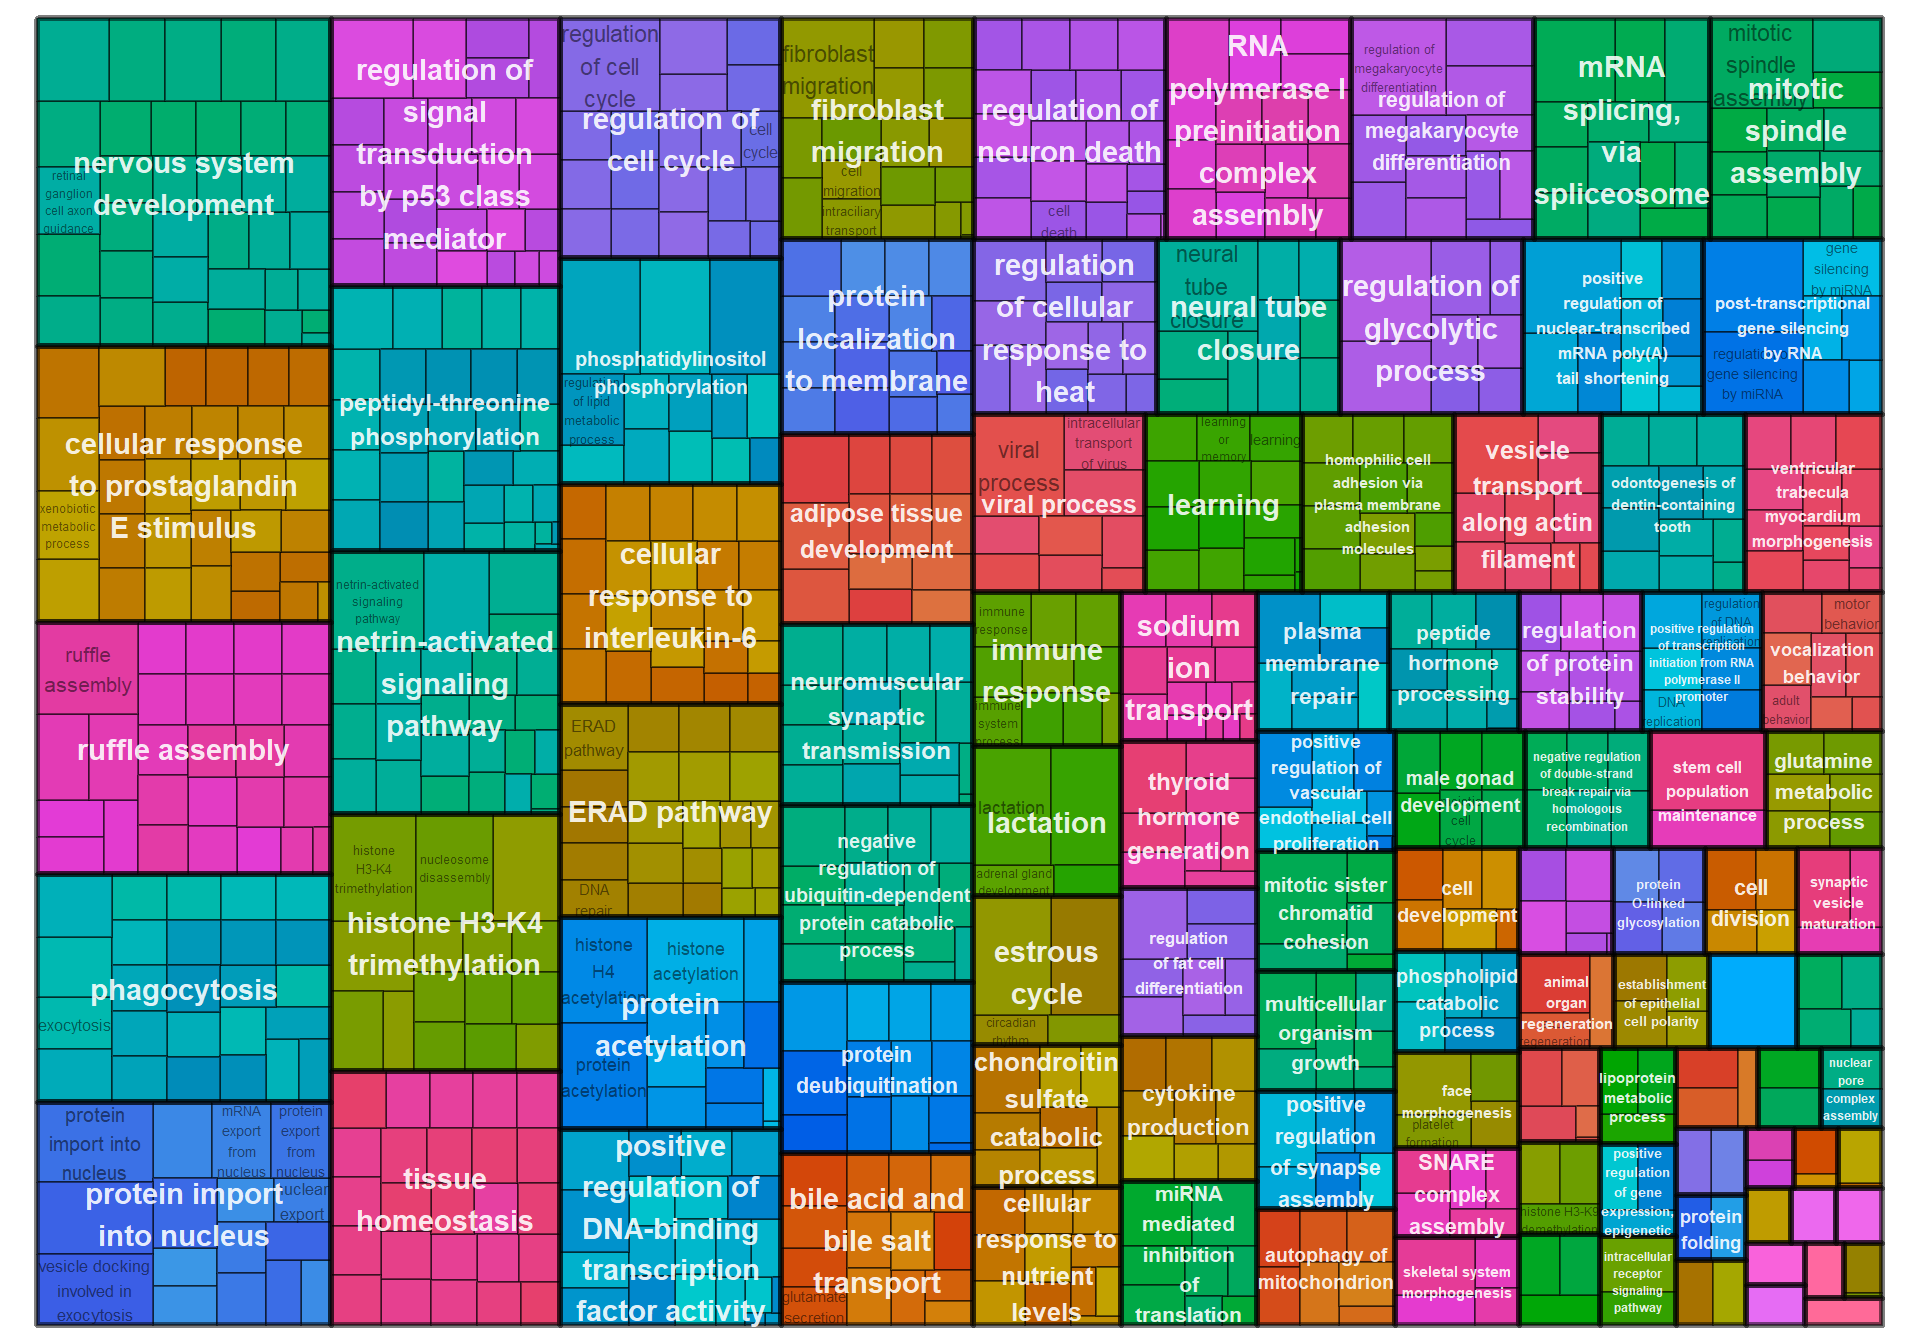
11.1.2 black - strength
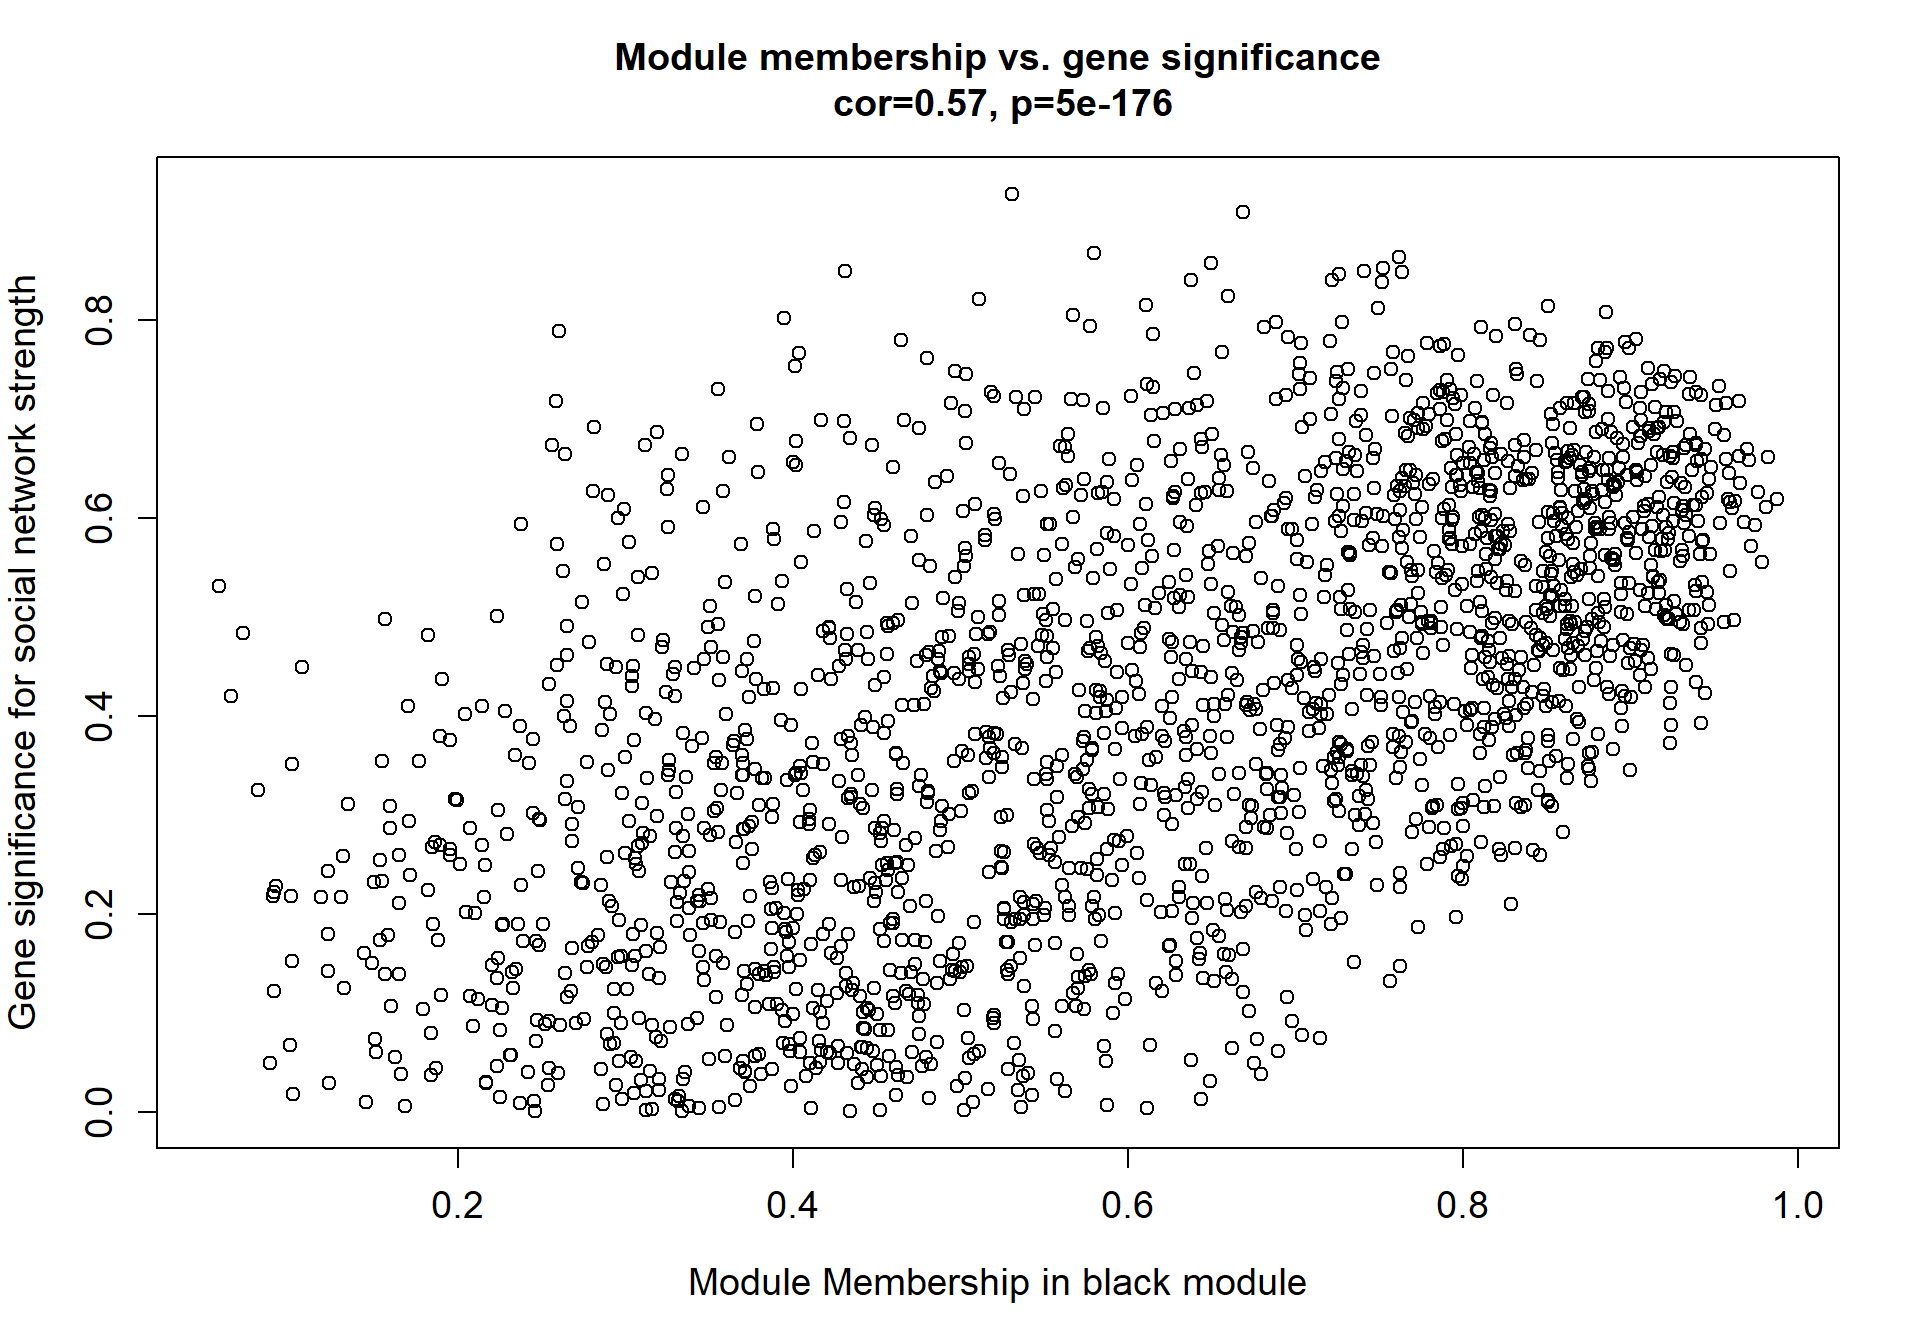
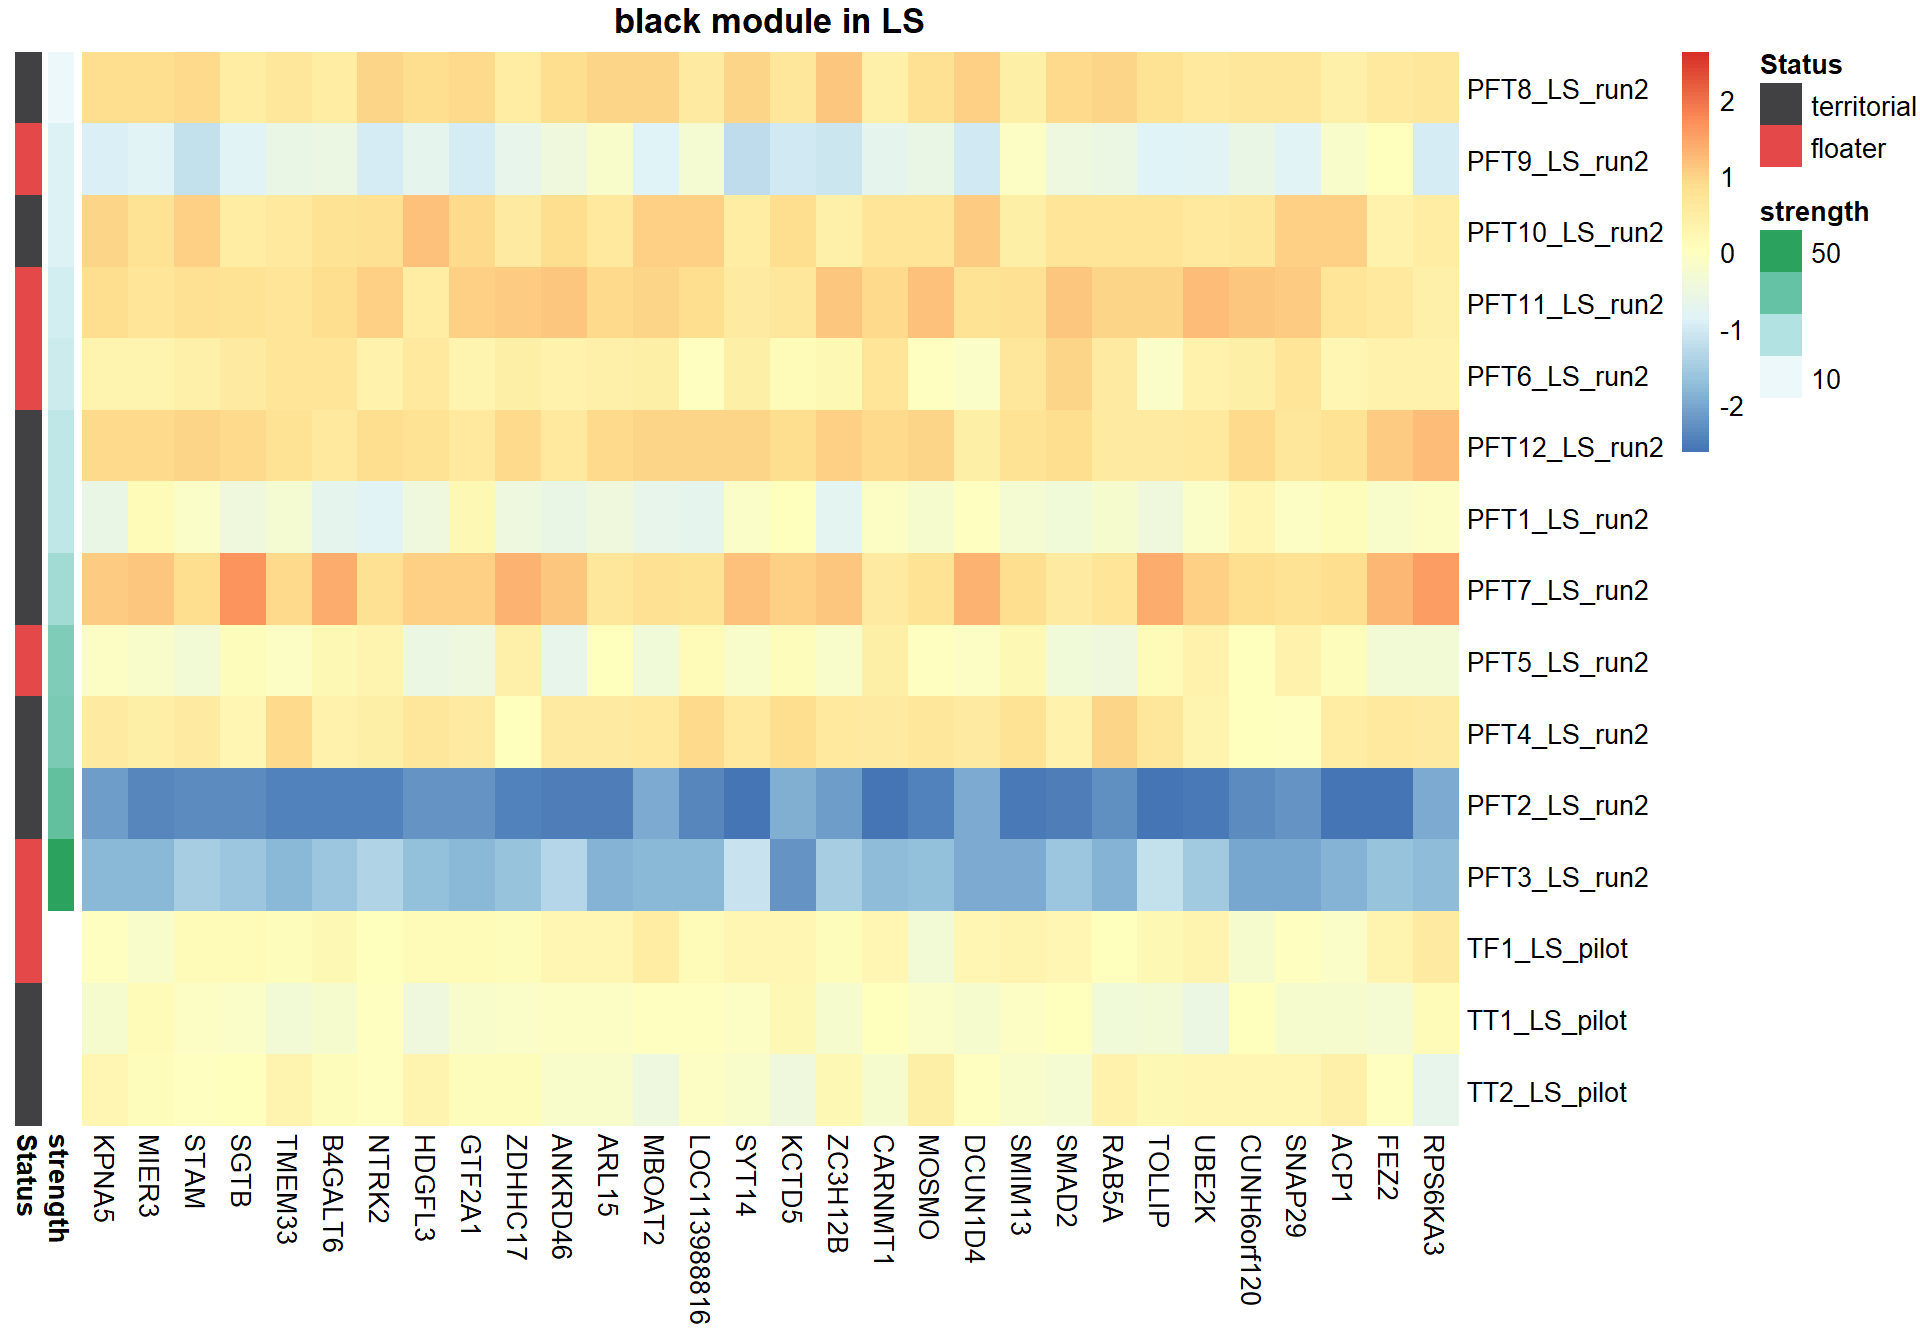
## Warning: Removed 3 rows containing missing values
## (`geom_point()`).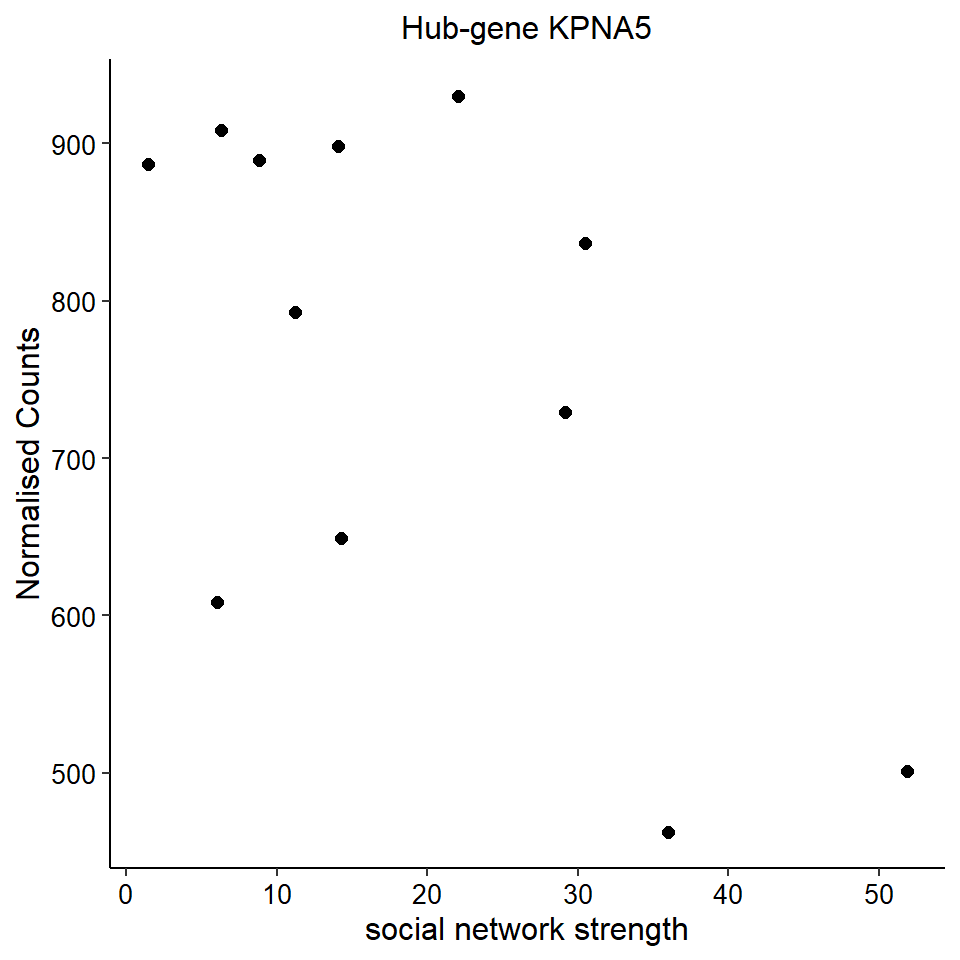
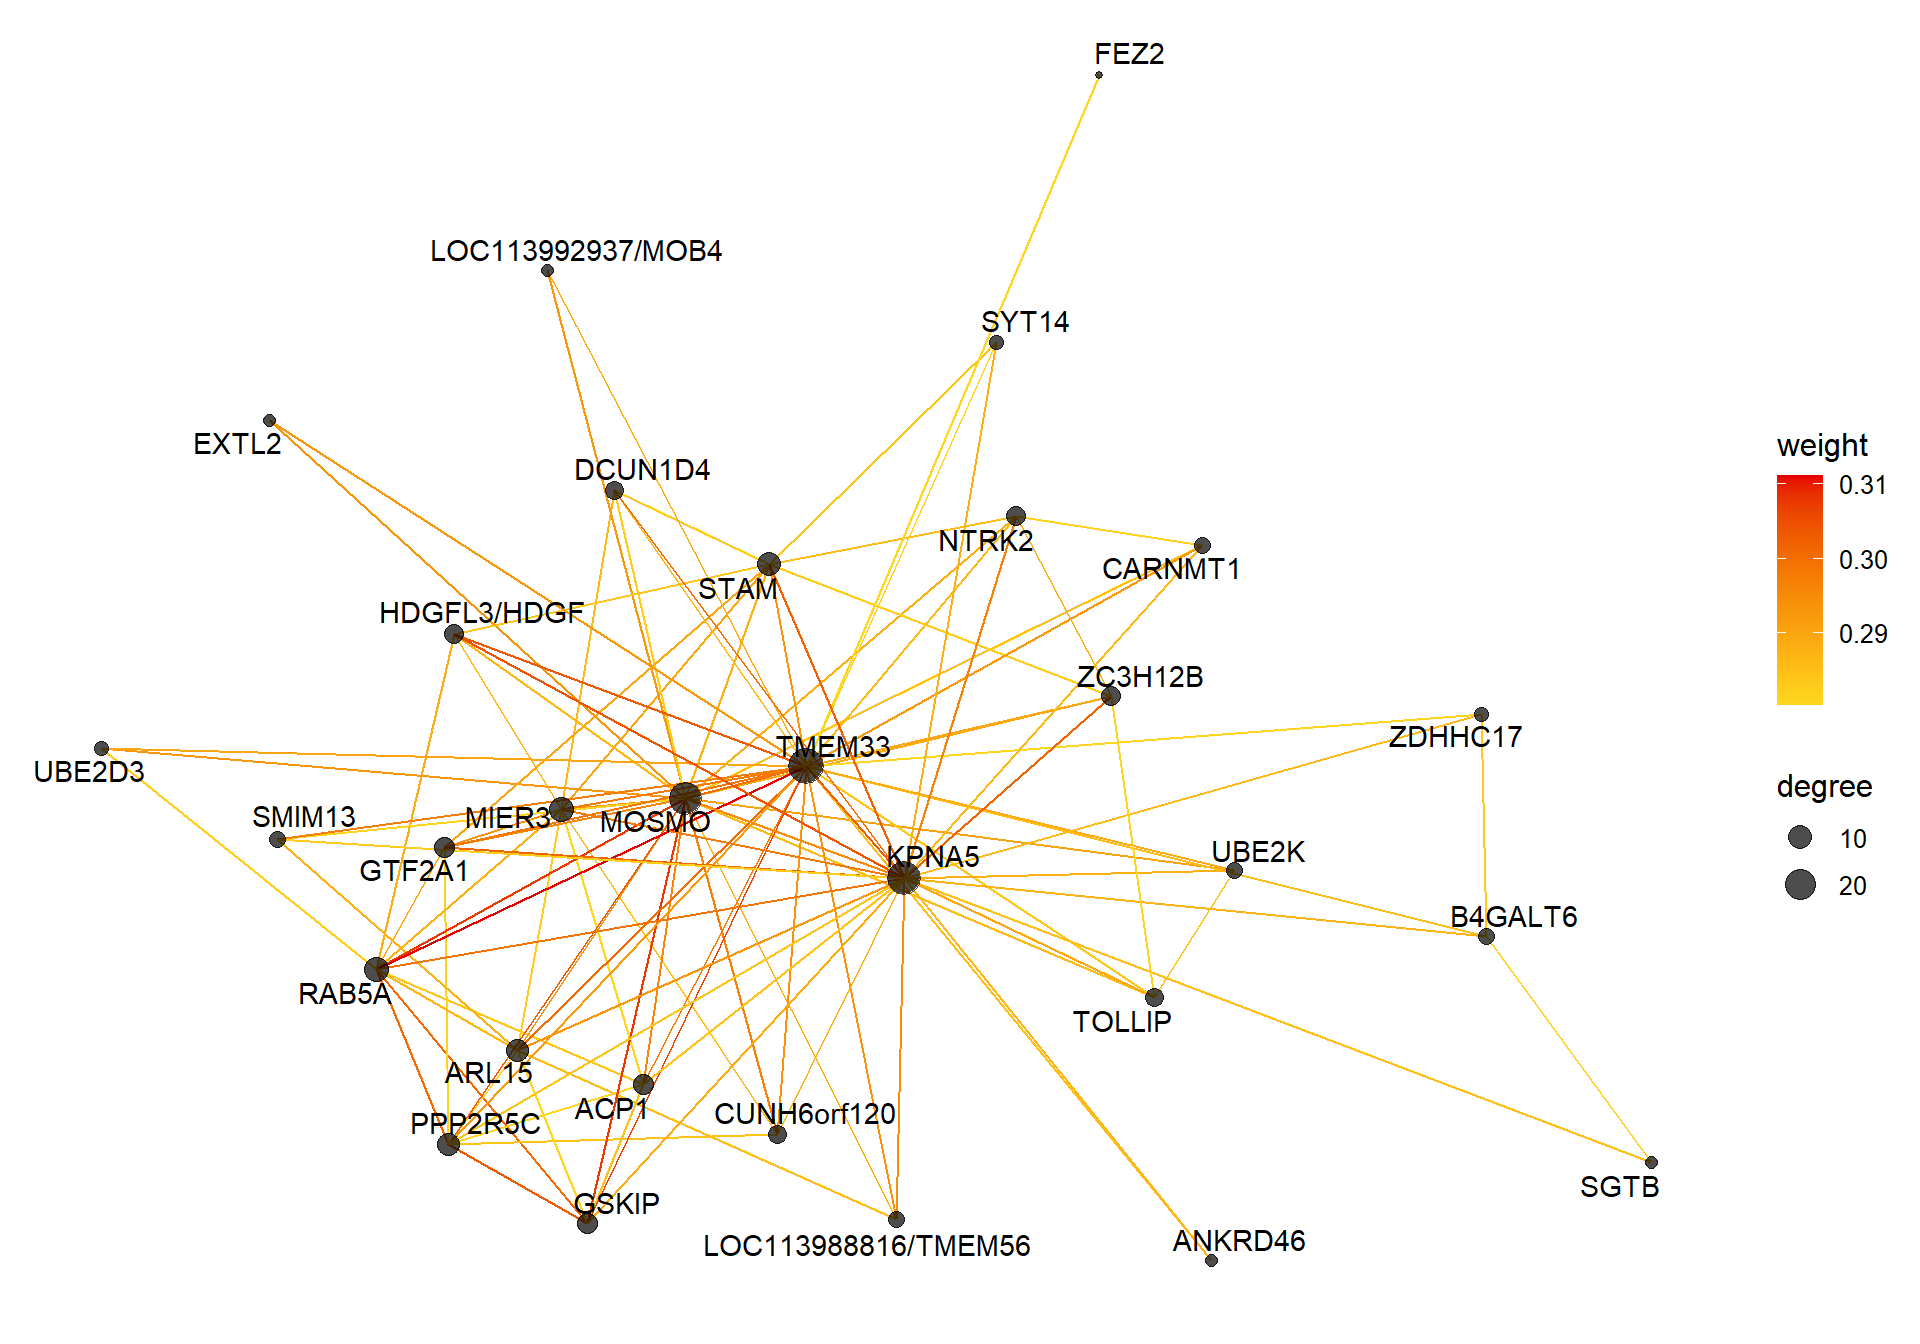
11.1.2.1 Gene Ontology
| ID | Description | GeneRatio | BgRatio | pvalue | p.adjust | qvalue | geneID | Count |
|---|---|---|---|---|---|---|---|---|
| GO:0007281 | germ cell development | 10/1654 | 19/12091 | 0.0000635 | 0.1183396 | 0.1180611 | ACVR1/AKT1/ANGPT2/BMP4/CELF4/FBXW11/PAFAH1B1/RPS6KB1/SMAD5/TDRD1 | 10 |
| GO:0006376 | mRNA splice site selection | 10/1654 | 20/12091 | 0.0001114 | 0.1183396 | 0.1180611 | CELF2/CELF4/LOC113985802/LOC113985815/LOC114002198/LUC7L/LUC7L3/RBMX/SRSF1/SRSF6 | 10 |
| GO:0005979 | regulation of glycogen biosynthetic process | 6/1654 | 10/12091 | 0.0008323 | 0.5895228 | 0.5881357 | AKT1/INPP5K/PPP1CB/PPP1R3C/PPP1R3D/PPP1R3G | 6 |
| GO:0035338 | long-chain fatty-acyl-CoA biosynthetic process | 8/1654 | 18/12091 | 0.0014705 | 0.7811873 | 0.7793493 | ACSL3/ACSL4/ELOVL2/ELOVL4/ELOVL5/ELOVL6/HSD17B12/TECR | 8 |
| GO:0032869 | cellular response to insulin stimulus | 21/1654 | 84/12091 | 0.0038217 | 0.8005247 | 0.7986411 | AKT1/C2CD5/CAPN10/CPEB2/FER/HDAC9/INPP5K/INSIG2/LOC113985802/LOC113985815/LPIN2/PTEN/RAB12/RAB8B/RHOQ/RPS6KB1/SORBS1/STAR/SYAP1/TRARG1/YWHAG | 21 |
| GO:0006661 | phosphatidylinositol biosynthetic process | 19/1654 | 74/12091 | 0.0042222 | 0.8005247 | 0.7986411 | CDIPT/CDS1/DGKE/FIG4/INPP4A/INPP5K/MTMR12/MTMR6/MTMR8/PIK3CA/PIK3R4/PIP4K2A/PIP4K2B/PITPNM3/PLEKHA3/PTEN/RAB4A/RAB5A/SACM1L | 19 |
| GO:0016024 | CDP-diacylglycerol biosynthetic process | 6/1654 | 13/12091 | 0.0047103 | 0.8005247 | 0.7986411 | AGPAT3/AGPAT5/CDS1/LCLAT1/LOC113995899/TAMM41 | 6 |
| GO:0032482 | Rab protein signal transduction | 6/1654 | 13/12091 | 0.0047103 | 0.8005247 | 0.7986411 | RAB12/RAB21/RAB33B/RAB39A/RAB4A/RAB9A | 6 |
| GO:0045842 | positive regulation of mitotic metaphase/anaphase transition | 6/1654 | 13/12091 | 0.0047103 | 0.8005247 | 0.7986411 | ANAPC11/ANAPC4/ESPL1/LOC113991003/NSMCE2/RB1 | 6 |
| GO:0071470 | cellular response to osmotic stress | 6/1654 | 13/12091 | 0.0047103 | 0.8005247 | 0.7986411 | DDX3X/LOC113991482/LOC113991485/LOC113991486/LRRC8D/ZFAND1 | 6 |
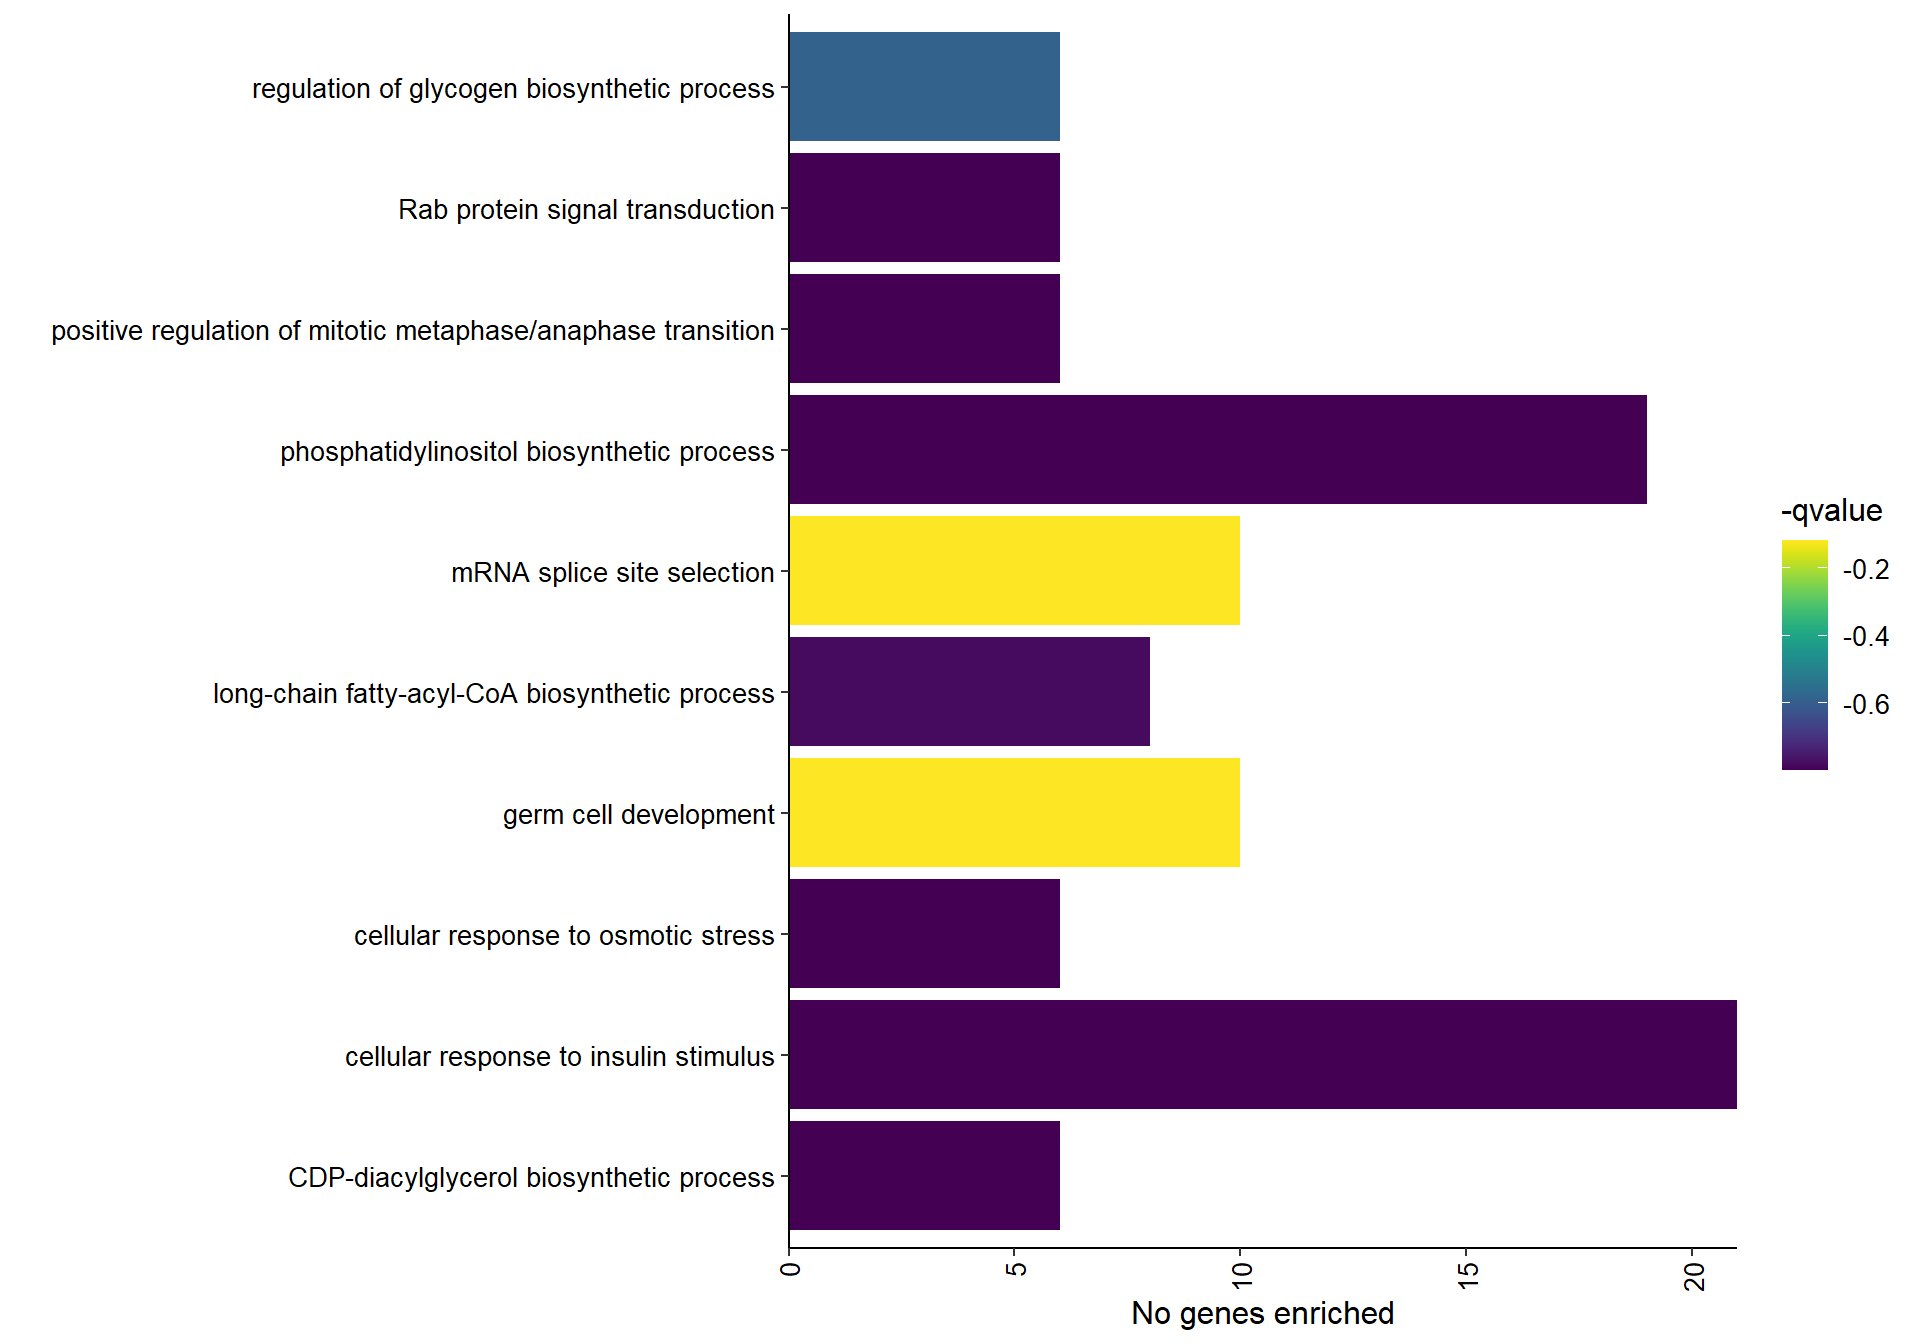
## preparing gene to GO mapping data...## preparing IC data...## Warning in if (class(try(col2rgb(palette), silent = TRUE)) == "try-error")
## stop("color palette is not correct"): the condition has length > 1 and only the
## first element will be used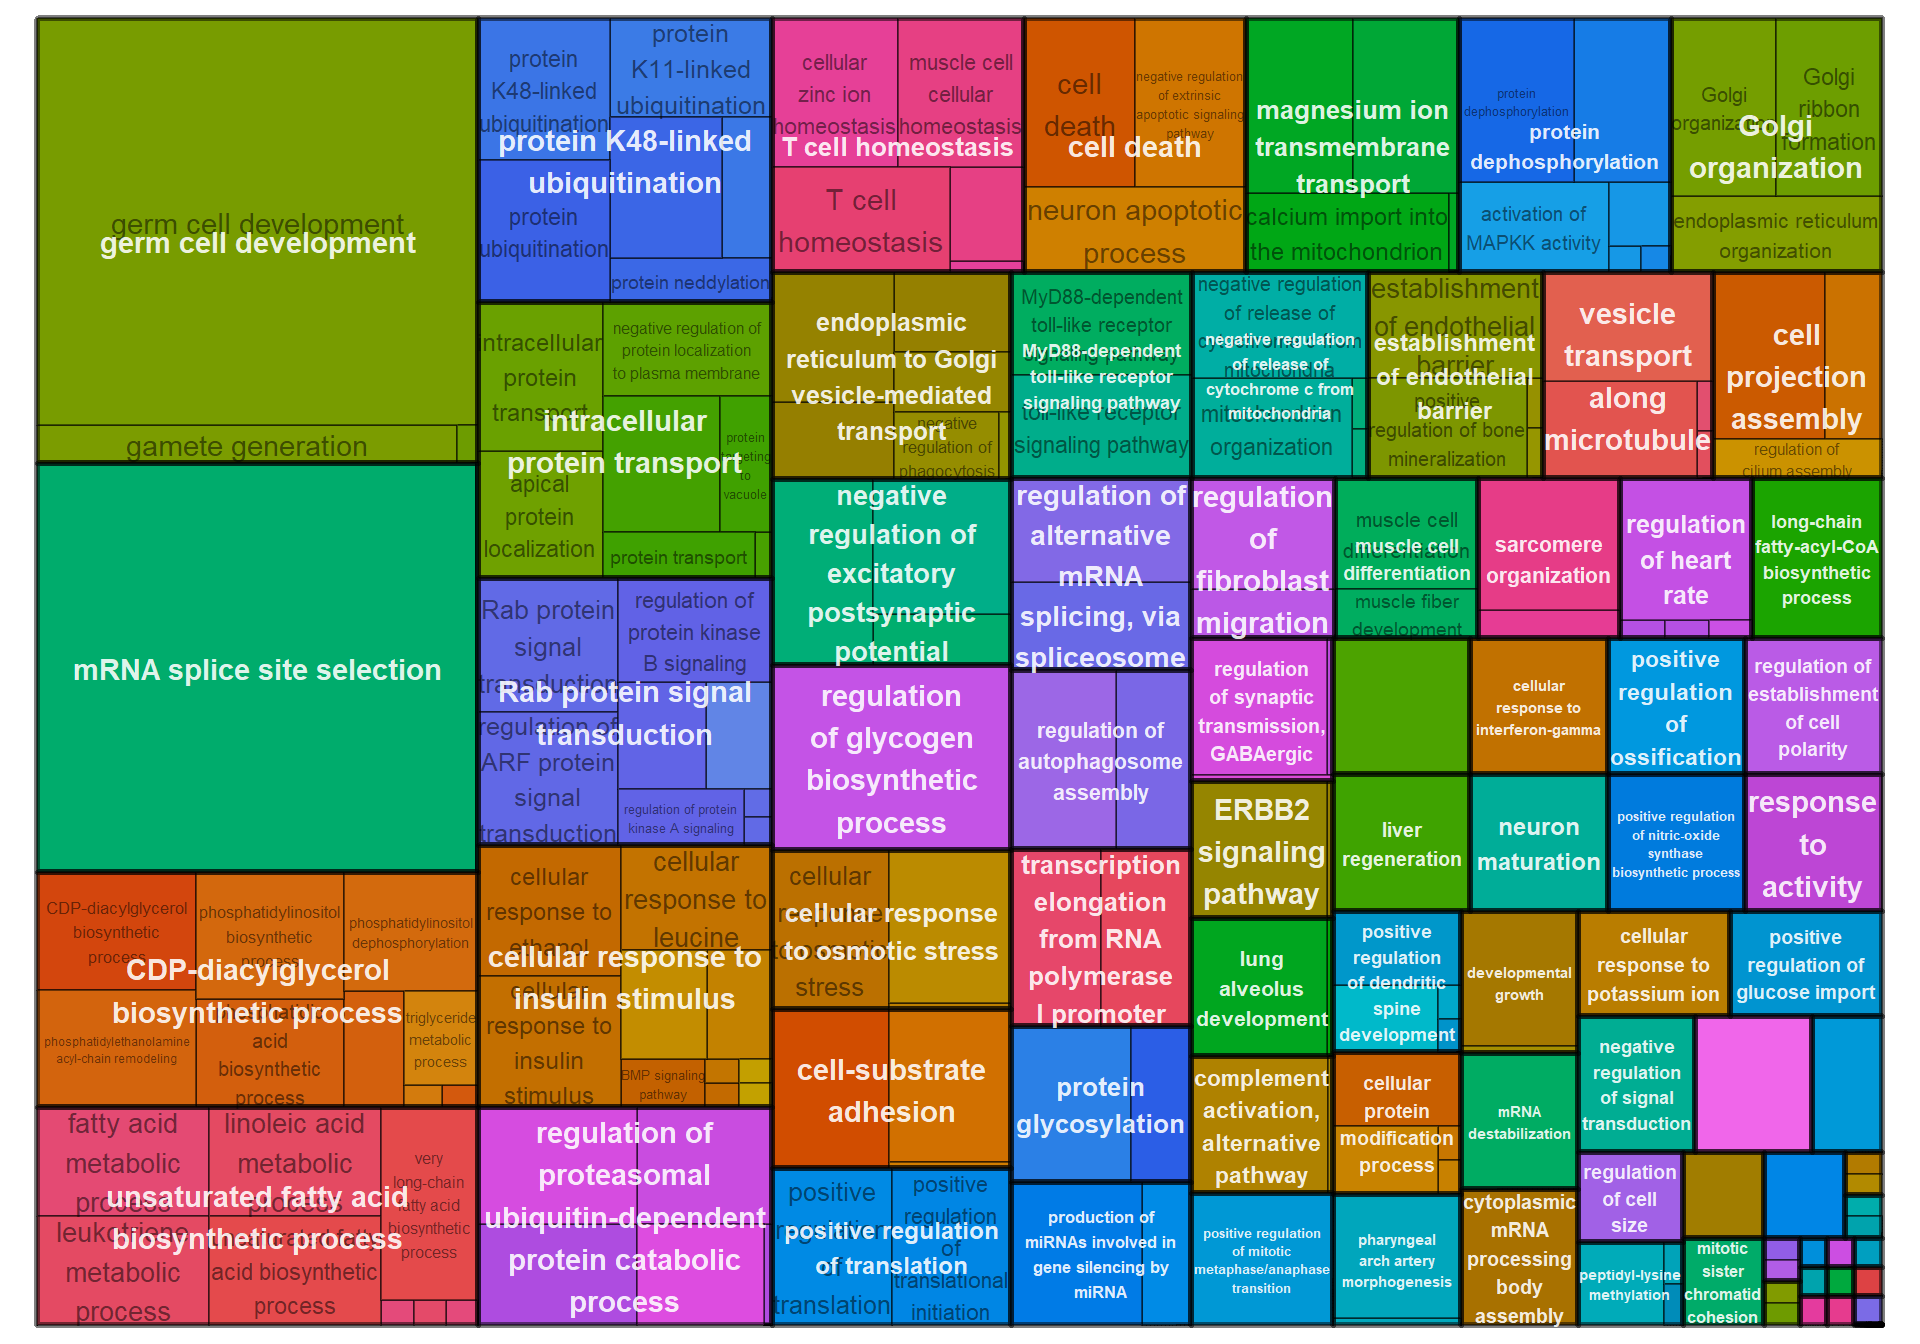
12 Bed Nucleus of the Stria Terminalis (BSTm)
## [1] 15033## Warning in DESeqDataSet(se, design = design, ignoreRank): some variables in
## design formula are characters, converting to factors## estimating size factors## estimating dispersions## gene-wise dispersion estimates## mean-dispersion relationship## final dispersion estimates## fitting model and testing## -- replacing outliers and refitting for 35 genes
## -- DESeq argument 'minReplicatesForReplace' = 7
## -- original counts are preserved in counts(dds)## estimating dispersions## fitting model and testing## Power SFT.R.sq slope truncated.R.sq mean.k. median.k. max.k.
## 1 1 8.90e-06 0.819 0.932 7520.0 7520.00 7570
## 2 2 4.60e-01 -19.200 0.919 4140.0 4120.00 4520
## 3 3 4.54e-01 -6.940 0.905 2450.0 2420.00 3000
## 4 4 4.95e-01 -4.130 0.915 1540.0 1500.00 2140
## 5 5 5.62e-01 -3.070 0.935 1010.0 973.00 1590
## 6 6 6.37e-01 -2.750 0.952 689.0 652.00 1250
## 7 7 6.93e-01 -2.670 0.960 486.0 450.00 1010
## 8 8 7.32e-01 -2.640 0.961 351.0 318.00 841
## 9 9 7.65e-01 -2.600 0.965 260.0 230.00 713
## 10 10 7.99e-01 -2.540 0.977 197.0 169.00 613
## 11 11 8.14e-01 -2.520 0.977 152.0 126.00 535
## 12 12 8.28e-01 -2.510 0.977 119.0 95.20 471
## 13 14 8.51e-01 -2.460 0.980 75.6 56.50 375
## 14 16 8.78e-01 -2.390 0.987 50.4 34.80 306
## 15 18 8.91e-01 -2.350 0.989 34.9 22.30 255
## 16 20 8.89e-01 -2.330 0.984 24.9 14.60 216
## 17 22 9.04e-01 -2.280 0.991 18.3 9.91 185
## 18 24 9.15e-01 -2.220 0.994 13.7 6.84 160
## 19 26 9.15e-01 -2.190 0.992 10.5 4.82 140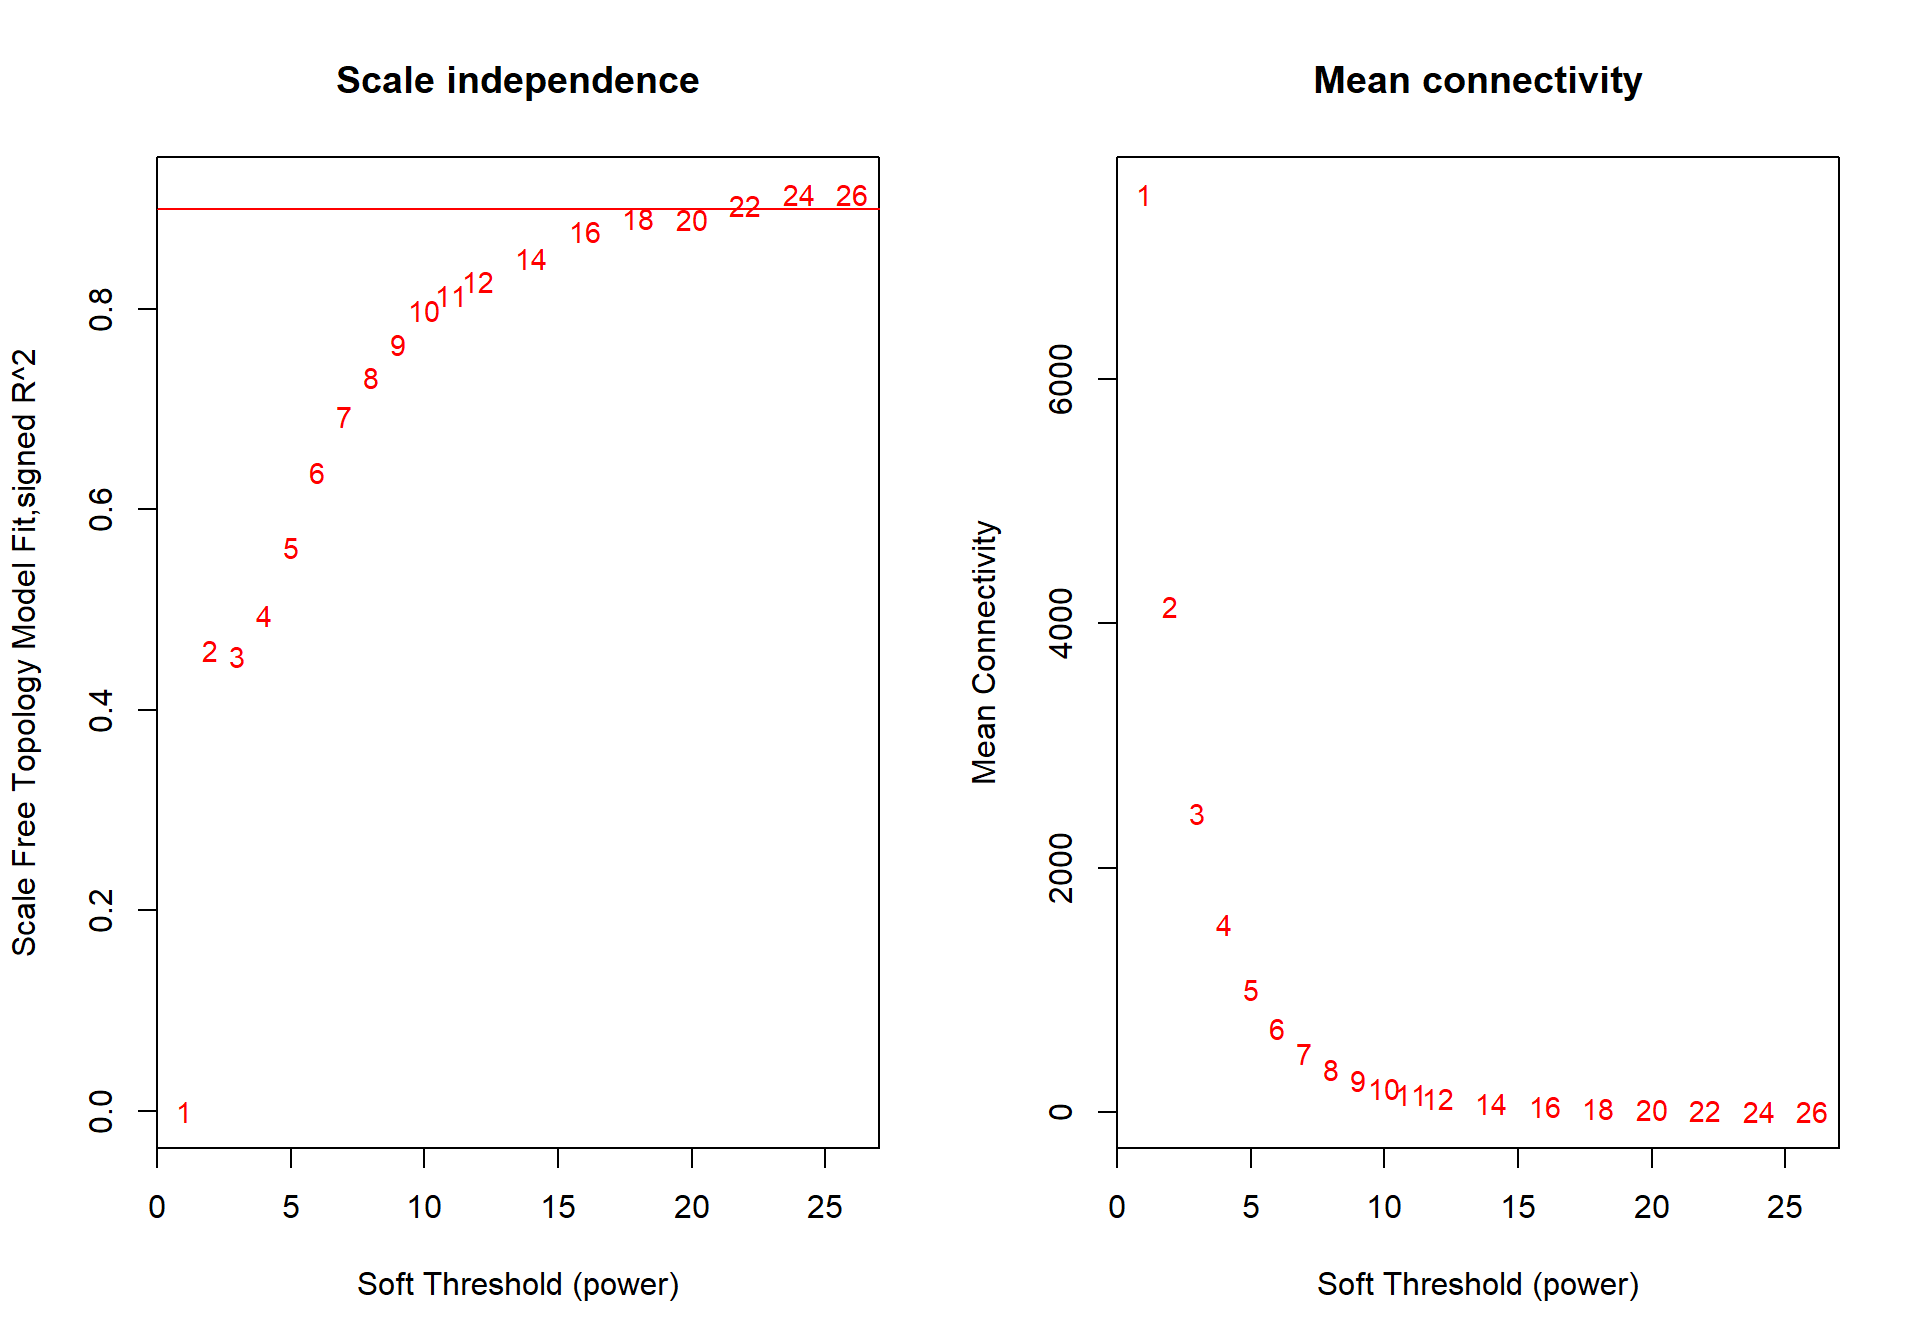
The soft-power selected for BSTm is 22.
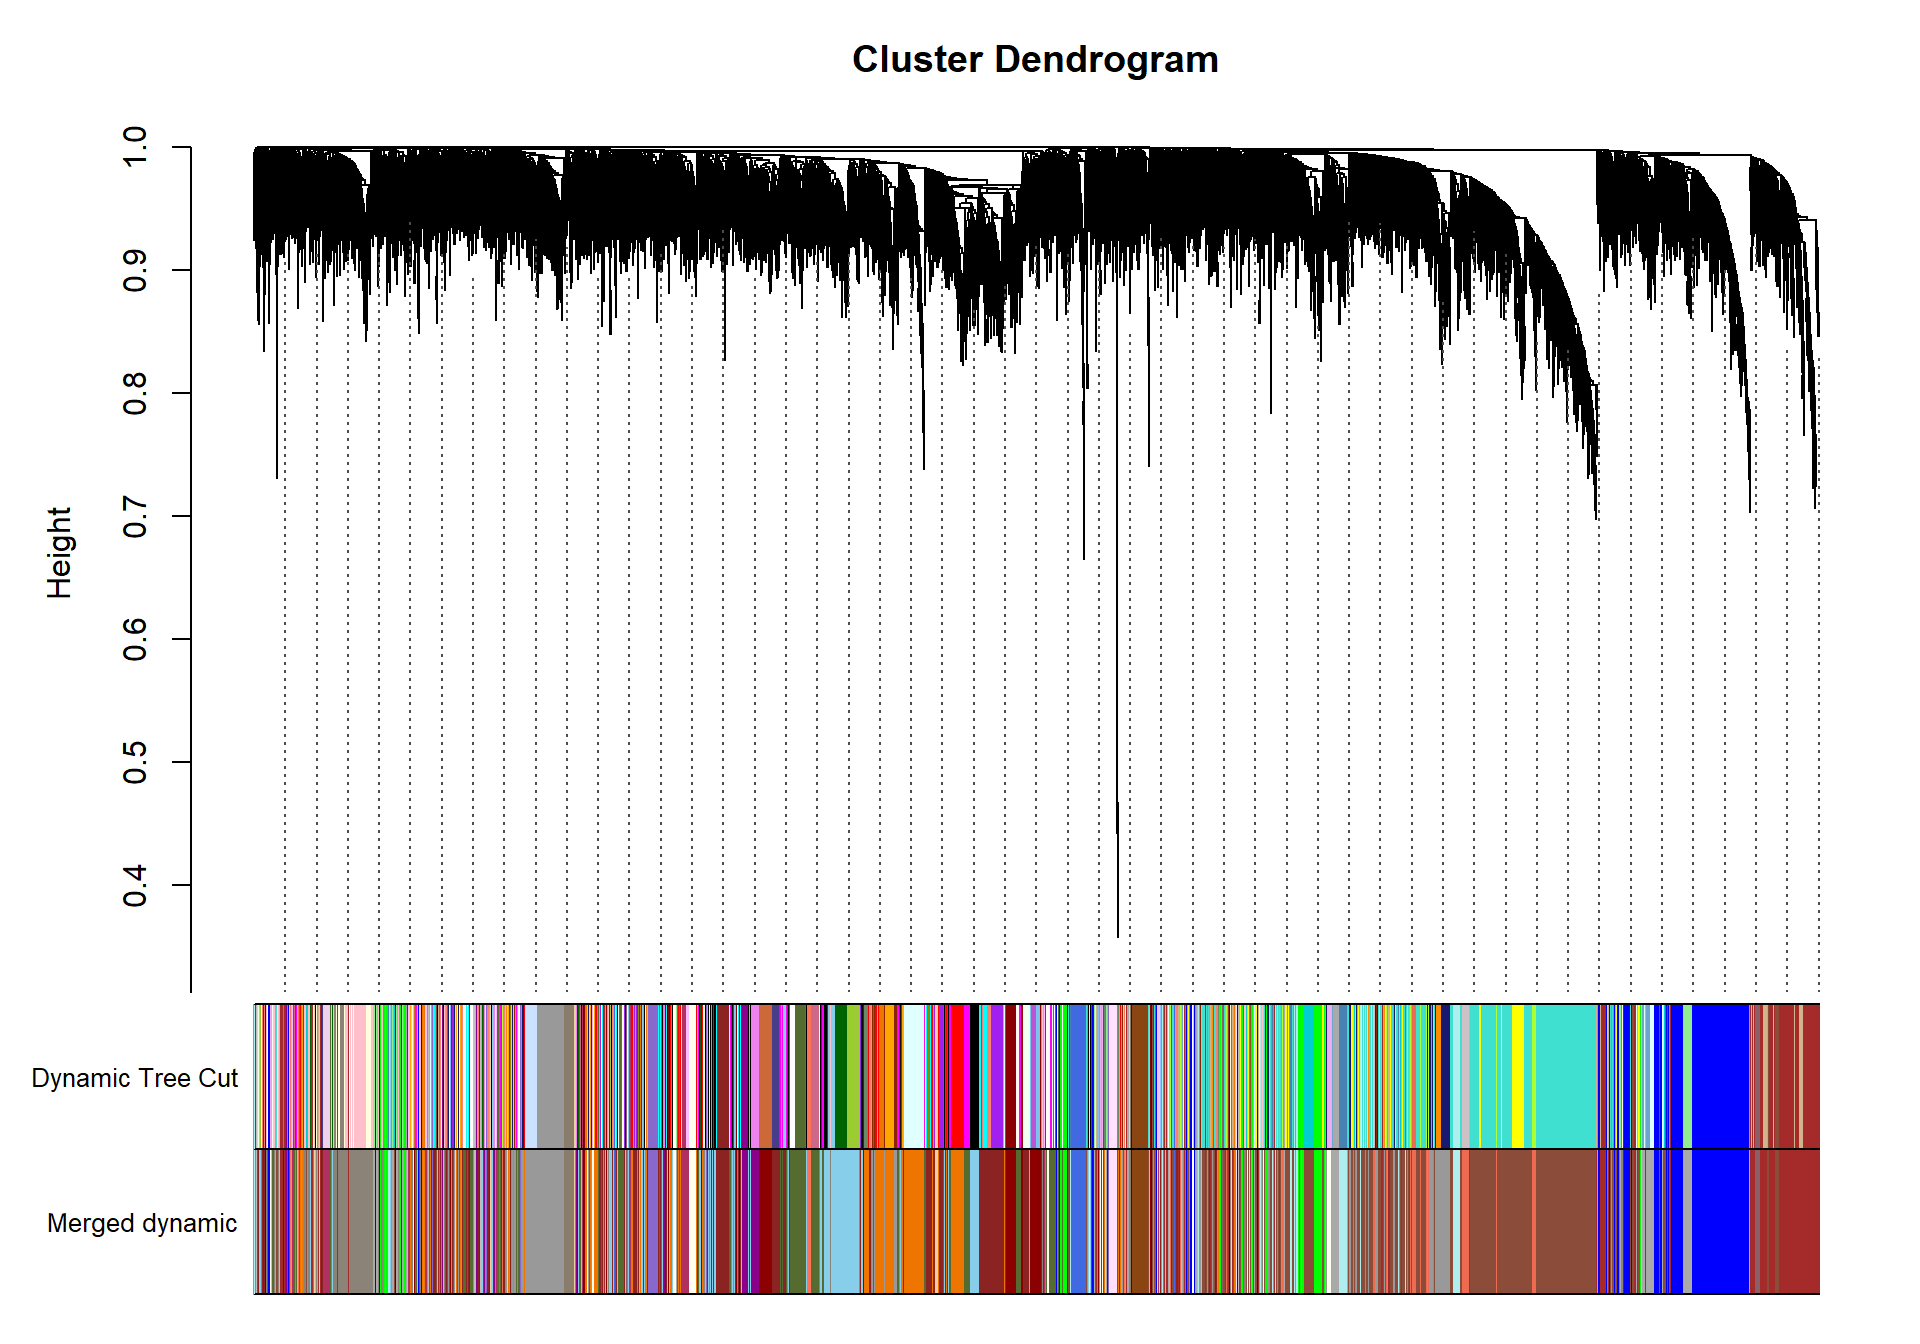
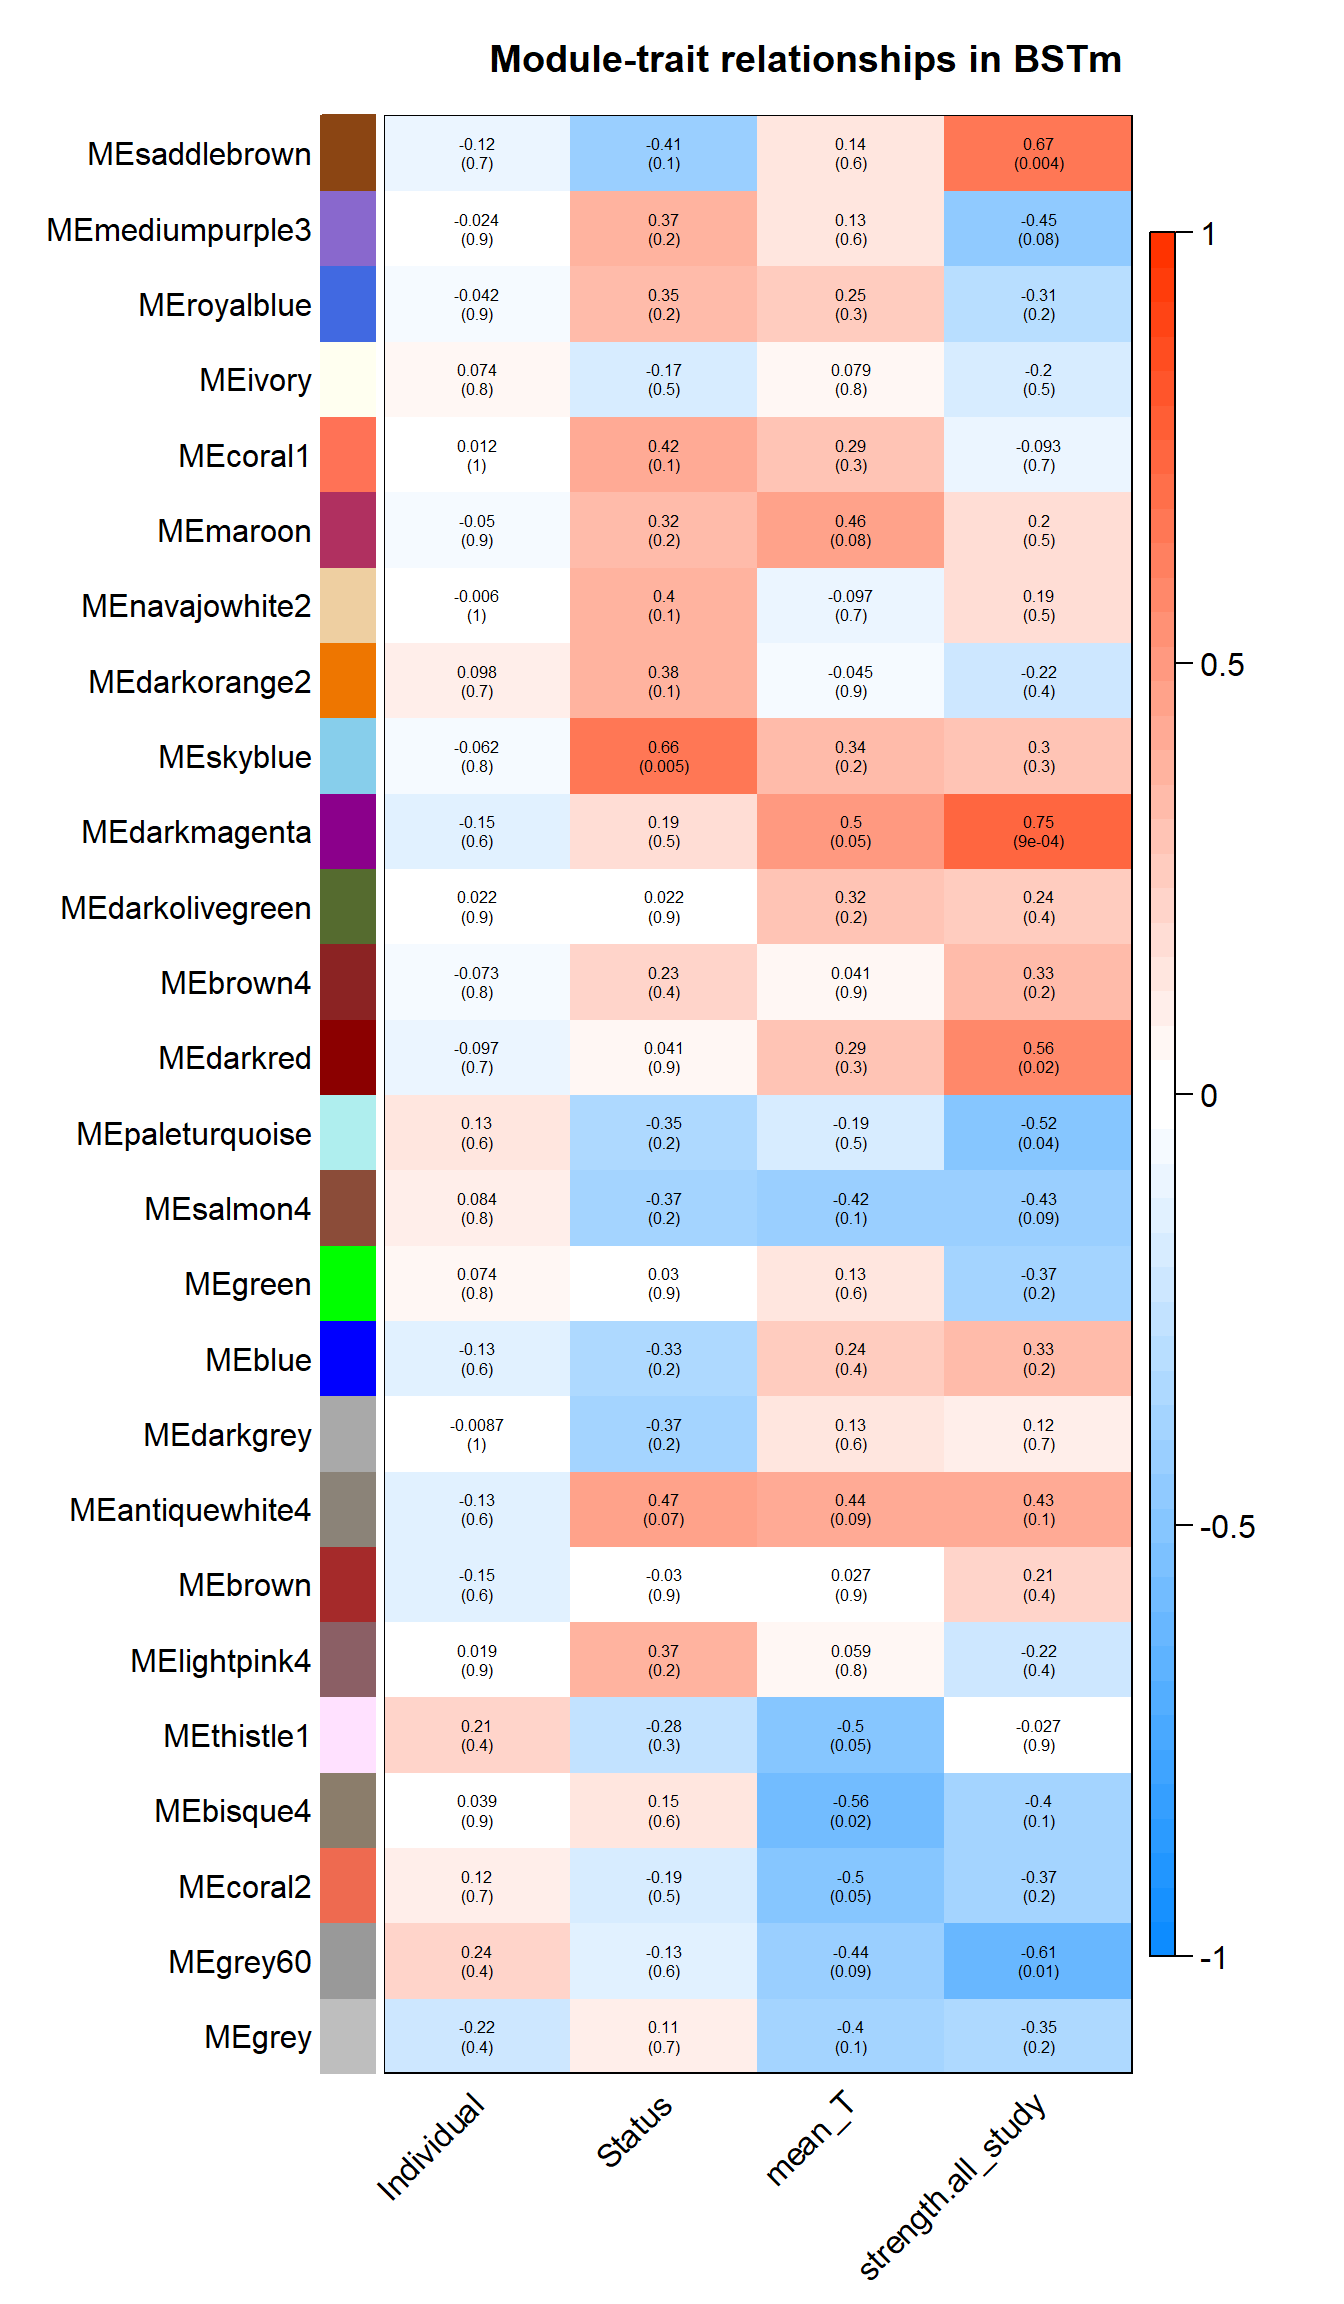
| moduleColors | Freq |
|---|---|
| antiquewhite4 | 712 |
| bisque4 | 111 |
| blue | 1123 |
| brown | 1067 |
| brown4 | 1377 |
| coral1 | 69 |
| coral2 | 490 |
| darkgrey | 720 |
| darkmagenta | 317 |
| darkolivegreen | 929 |
| darkorange2 | 1057 |
| darkred | 492 |
| green | 471 |
| grey | 141 |
| grey60 | 996 |
| ivory | 220 |
| lightpink4 | 82 |
| maroon | 317 |
| mediumpurple3 | 128 |
| navajowhite2 | 87 |
| paleturquoise | 337 |
| royalblue | 222 |
| saddlebrown | 169 |
| salmon4 | 2361 |
| skyblue | 940 |
| thistle1 | 96 |
There appears to be a strong correlation between darkred and salmon4, and inverse between darkmagenta and paleturquoise
12.1 Interesting Modules
12.1.1 darkred - strength
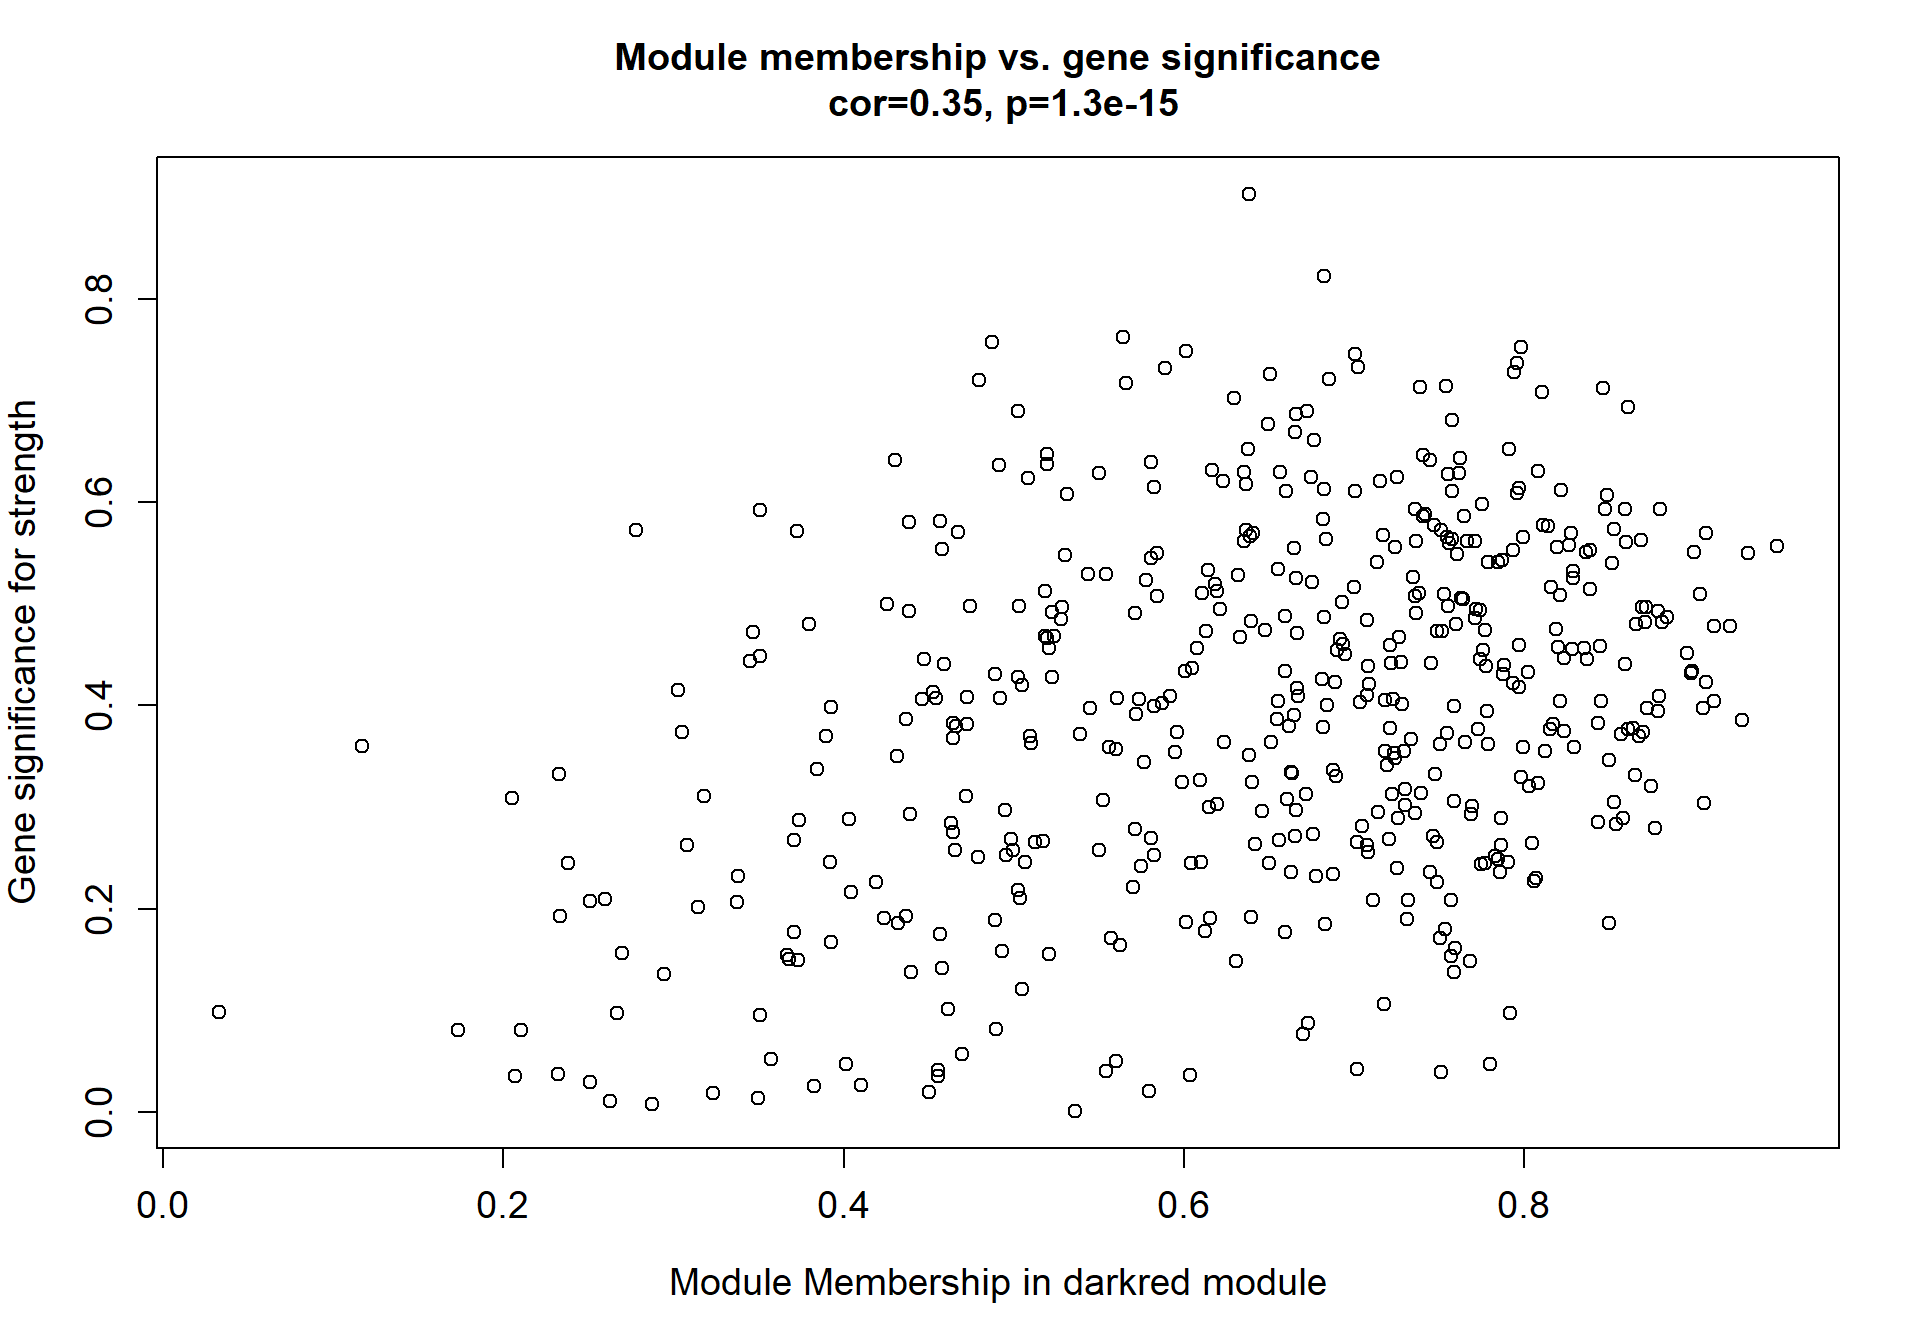
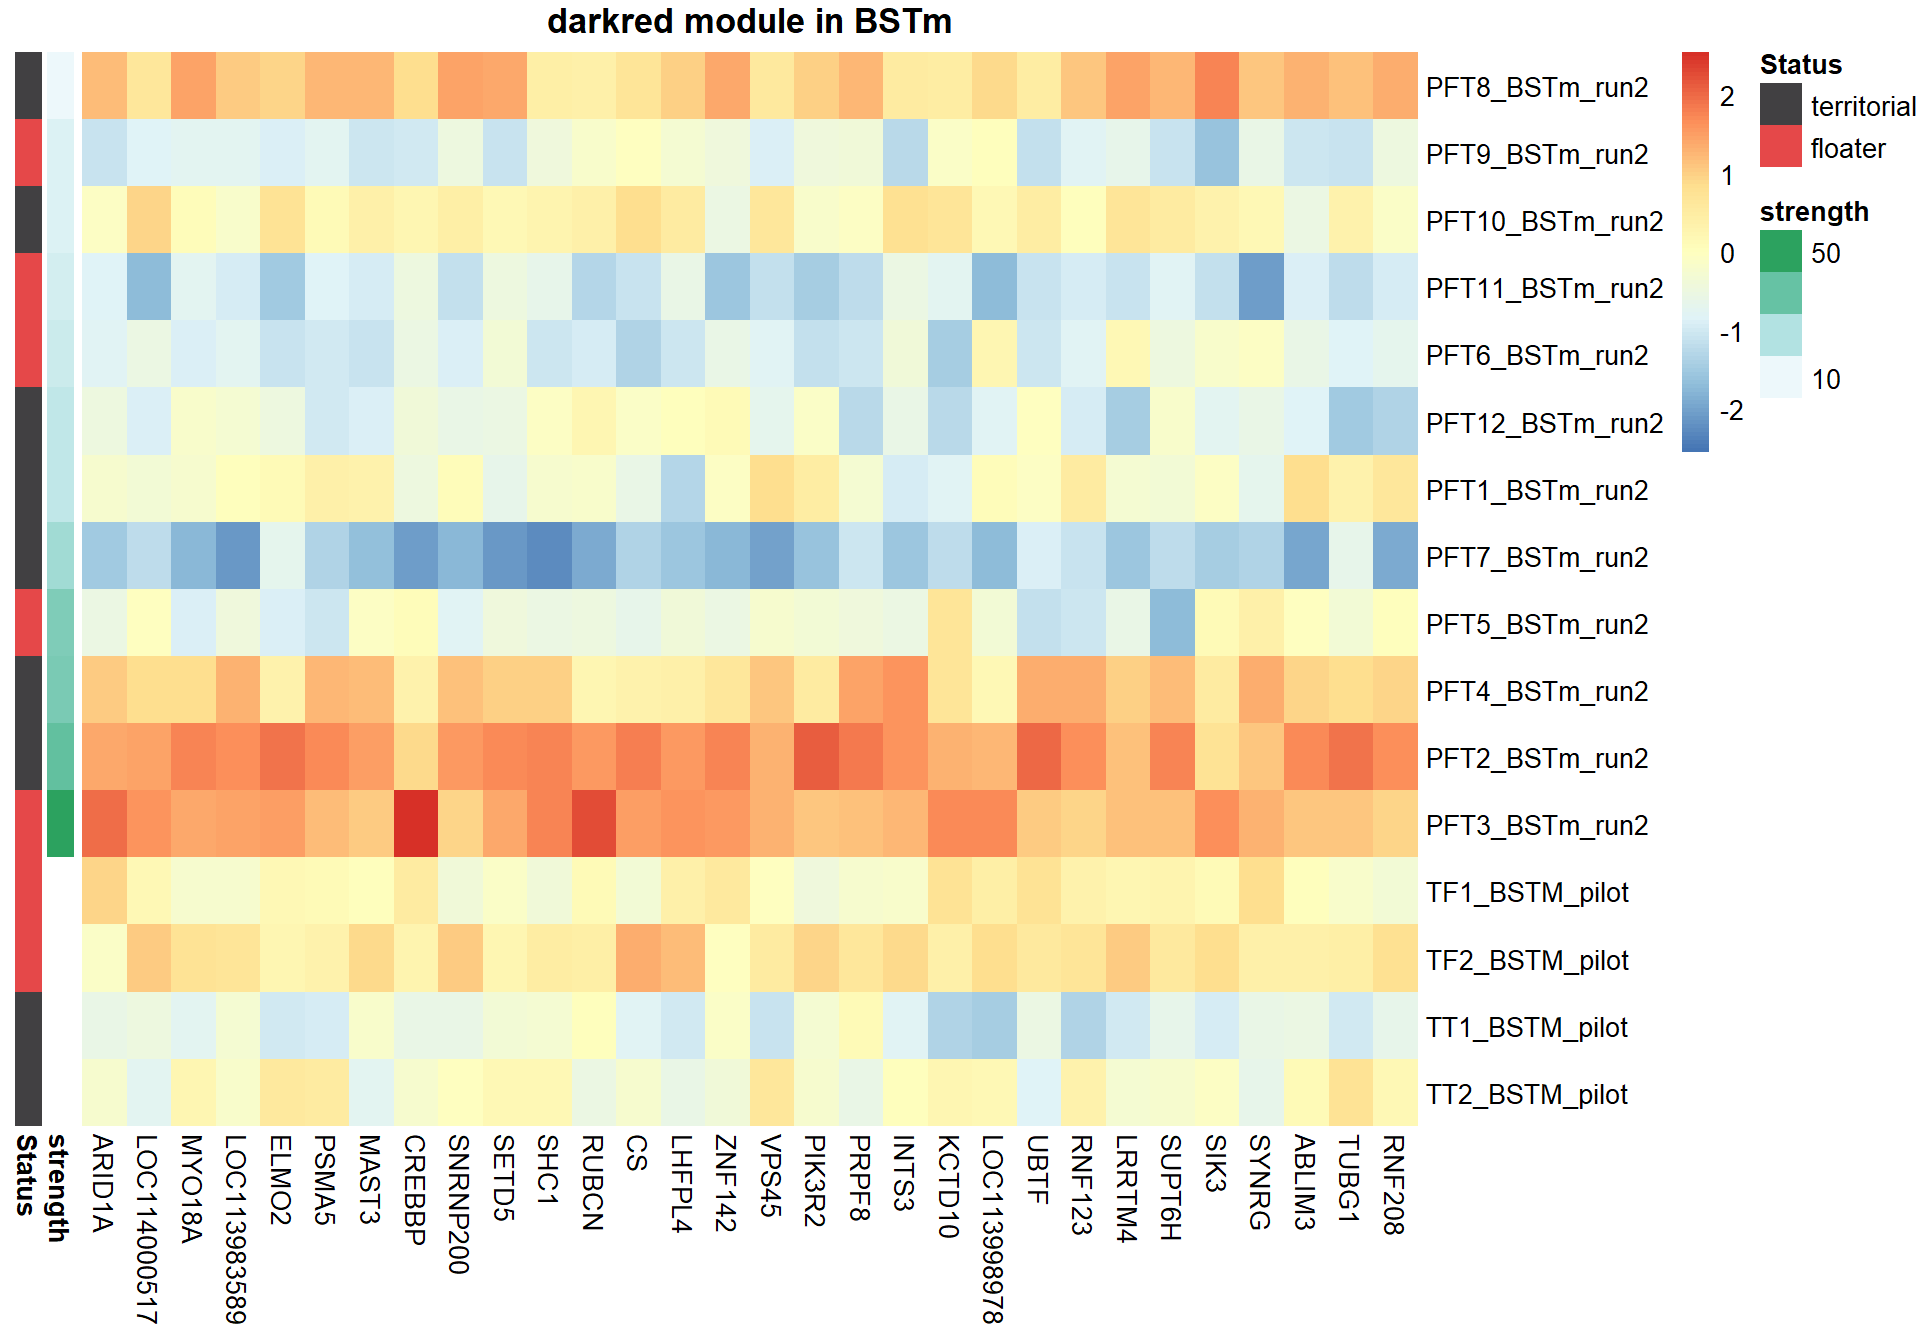
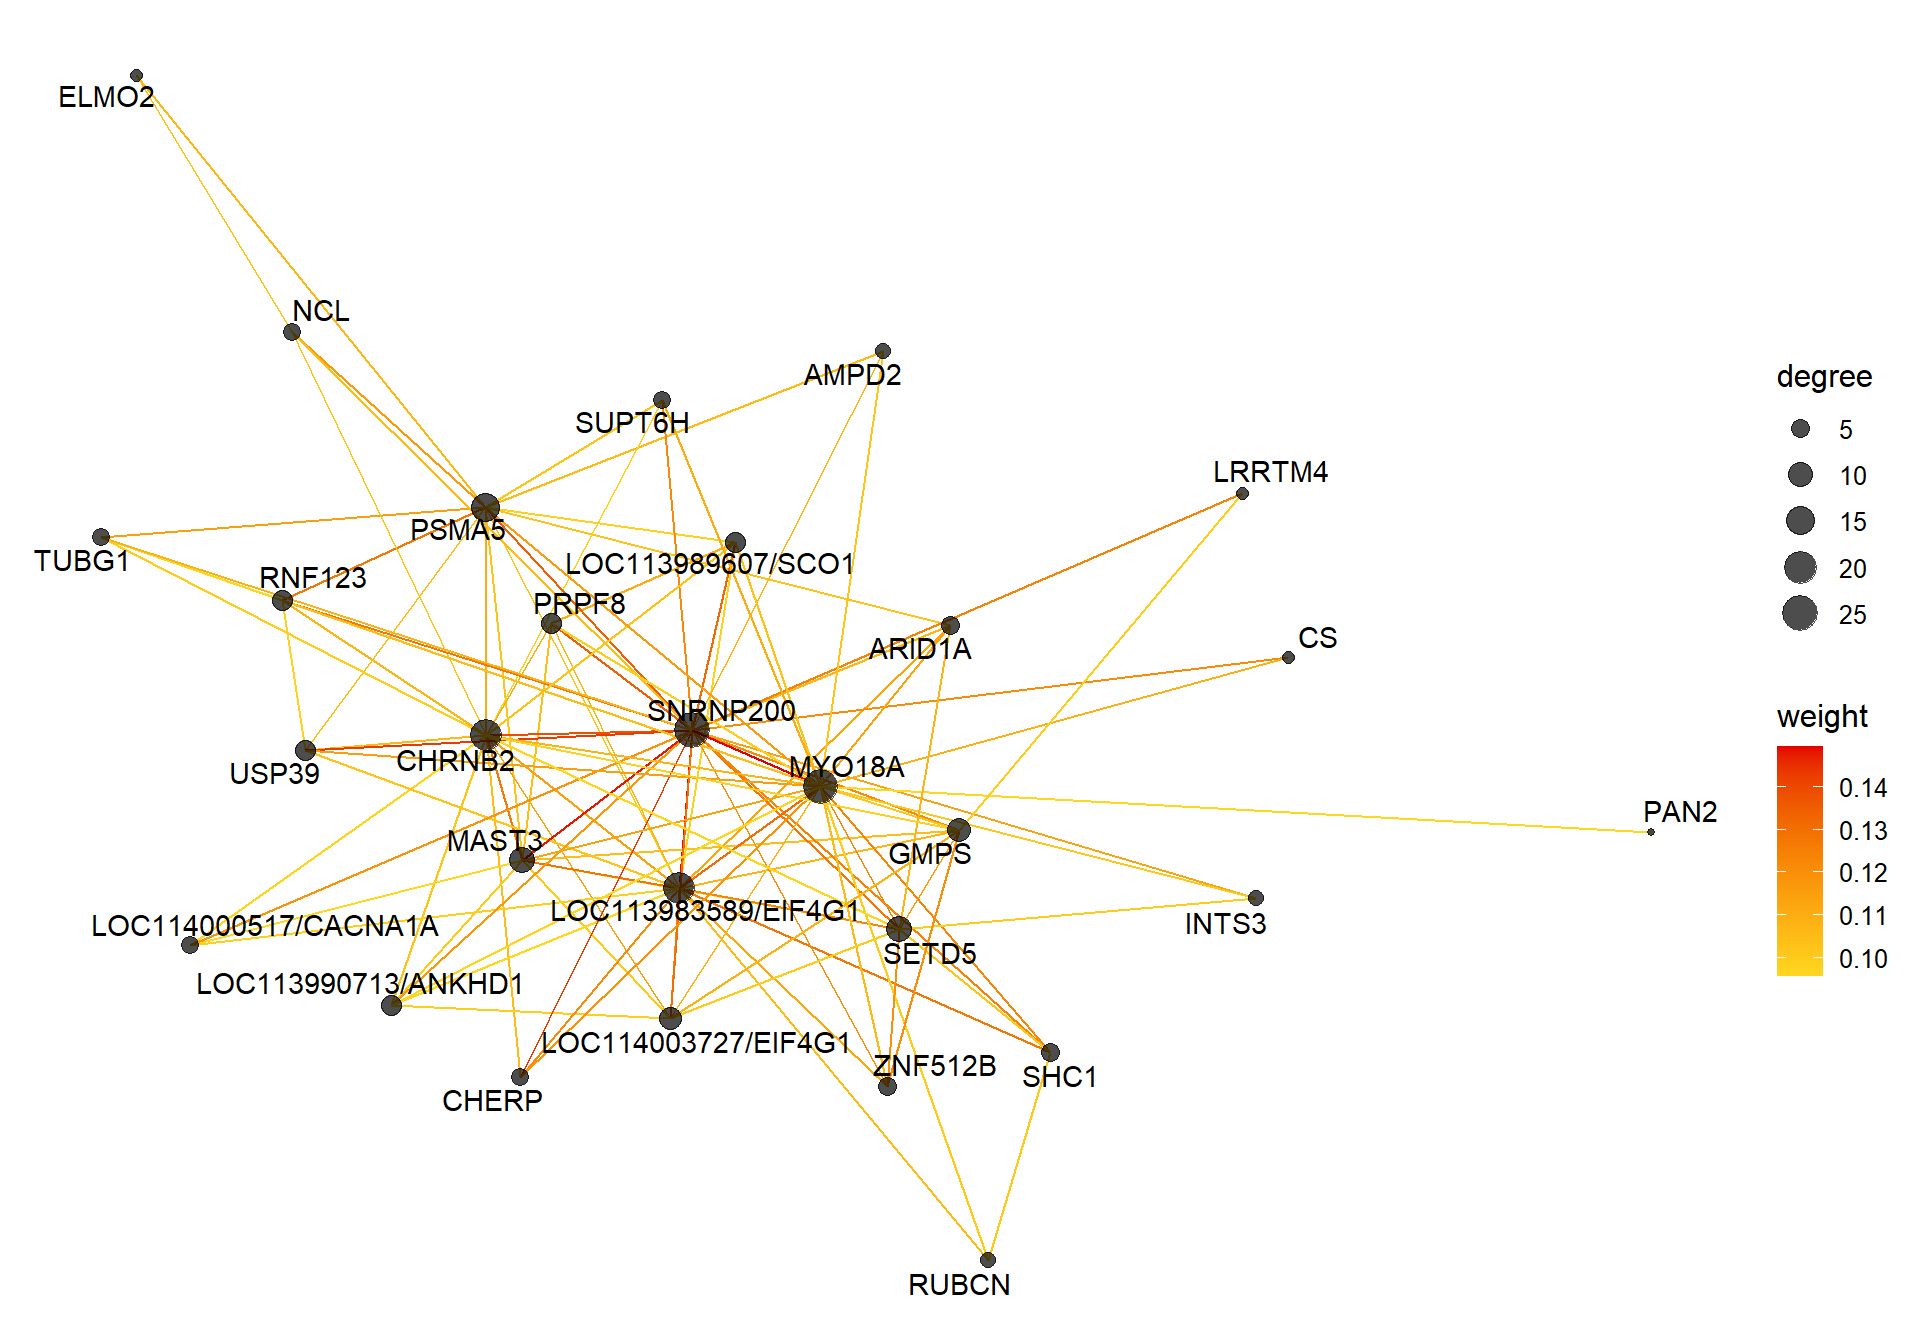
12.1.1.1 Gene Ontology
| ID | Description | GeneRatio | BgRatio | pvalue | p.adjust | qvalue | geneID | Count |
|---|---|---|---|---|---|---|---|---|
| GO:0038007 | netrin-activated signaling pathway | 5/420 | 14/12181 | 0.0000736 | 0.0904506 | 0.0869563 | DSCAM/LOC113983017/LOC113988456/LOC113993074/UNC5A | 5 |
| GO:1900034 | regulation of cellular response to heat | 10/420 | 70/12181 | 0.0001329 | 0.0904506 | 0.0869563 | AAAS/ATR/CAMK2B/CREBBP/HSP90AB1/LOC113998422/MLST8/NUP54/NUP62CL/NUP85 | 10 |
| GO:0090303 | positive regulation of wound healing | 6/420 | 26/12181 | 0.0002075 | 0.0941361 | 0.0904994 | ACTG1/DMTN/LOC113983017/LOC113983228/LOC113993074/OCLN | 6 |
| GO:0043984 | histone H4-K16 acetylation | 5/420 | 21/12181 | 0.0006128 | 0.2085137 | 0.2004582 | KANSL1/KANSL3/KAT7/KMT2A/MSL1 | 5 |
| GO:0006909 | phagocytosis | 7/420 | 46/12181 | 0.0009214 | 0.2508137 | 0.2411241 | LOC113988212/LOC113992314/LOC113993578/LRP1/RUBCN/SYT7/TUSC2 | 7 |
| GO:0051899 | membrane depolarization | 5/420 | 26/12181 | 0.0017189 | 0.3342980 | 0.3213832 | CACNA1E/CACNB3/CHRNB2/LOC113993166/LOC114000517 | 5 |
| GO:0060964 | regulation of gene silencing by miRNA | 7/420 | 51/12181 | 0.0017194 | 0.3342980 | 0.3213832 | AAAS/LOC113983589/LOC113992597/LOC114003727/NUP54/NUP62CL/NUP85 | 7 |
| GO:0032786 | positive regulation of DNA-templated transcription, elongation | 4/420 | 17/12181 | 0.0023199 | 0.3351089 | 0.3221628 | CCNT1/ELL/KAT7/LOC113988658 | 4 |
| GO:0038096 | Fc-gamma receptor signaling pathway involved in phagocytosis | 8/420 | 69/12181 | 0.0024789 | 0.3351089 | 0.3221628 | ACTG1/BAIAP2/ELMO2/HSP90AB1/LOC113983017/LOC113983228/LOC113993074/NCKIPSD | 8 |
| GO:0034622 | cellular protein-containing complex assembly | 4/420 | 18/12181 | 0.0029024 | 0.3351089 | 0.3221628 | DNAJB12/LOC113995101/LOC113998422/TRAF2 | 4 |
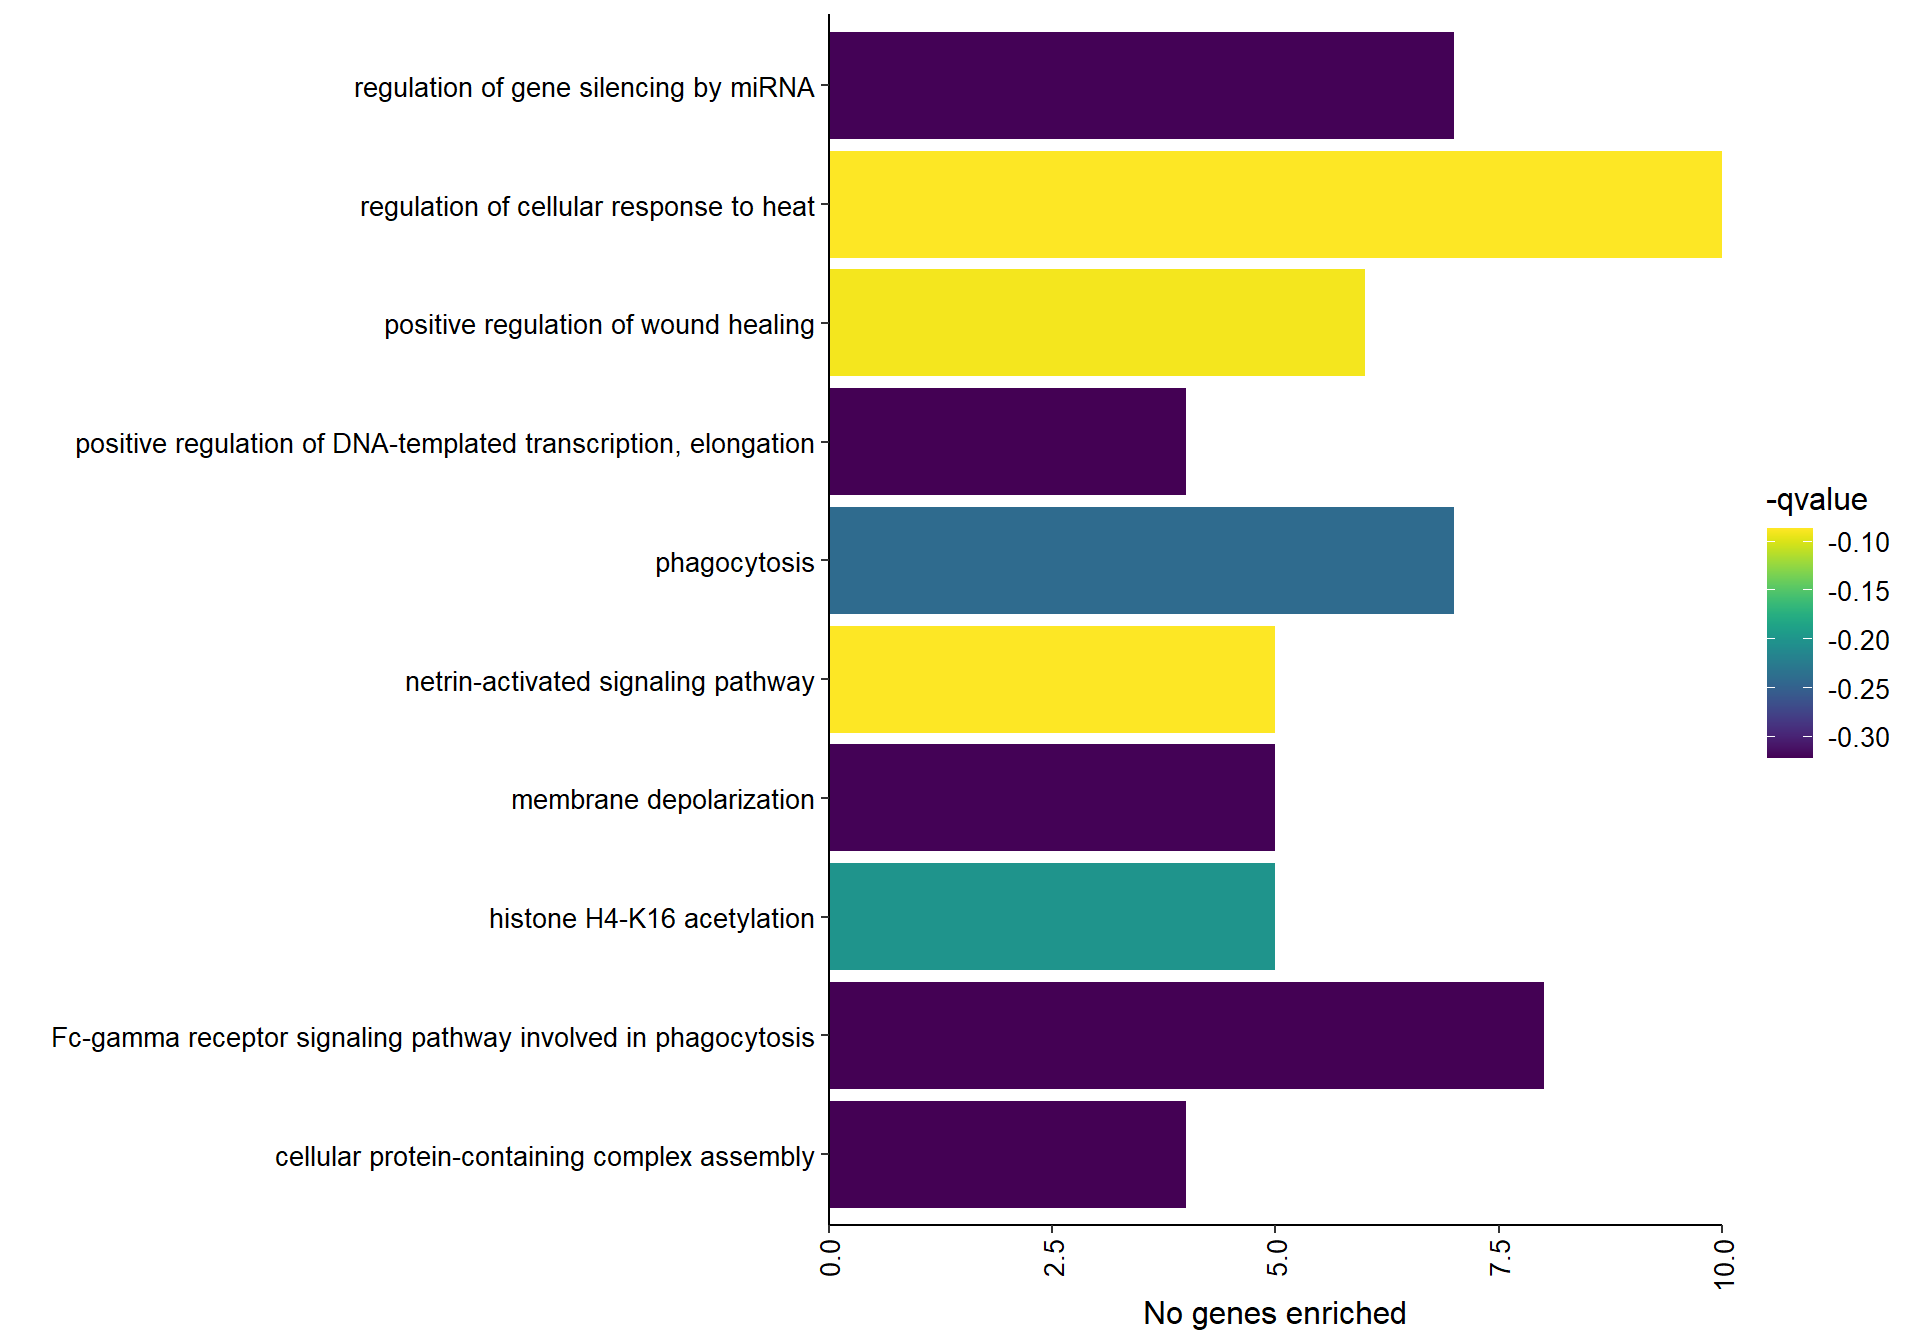
## preparing gene to GO mapping data...## preparing IC data...## Warning in if (class(try(col2rgb(palette), silent = TRUE)) == "try-error")
## stop("color palette is not correct"): the condition has length > 1 and only the
## first element will be used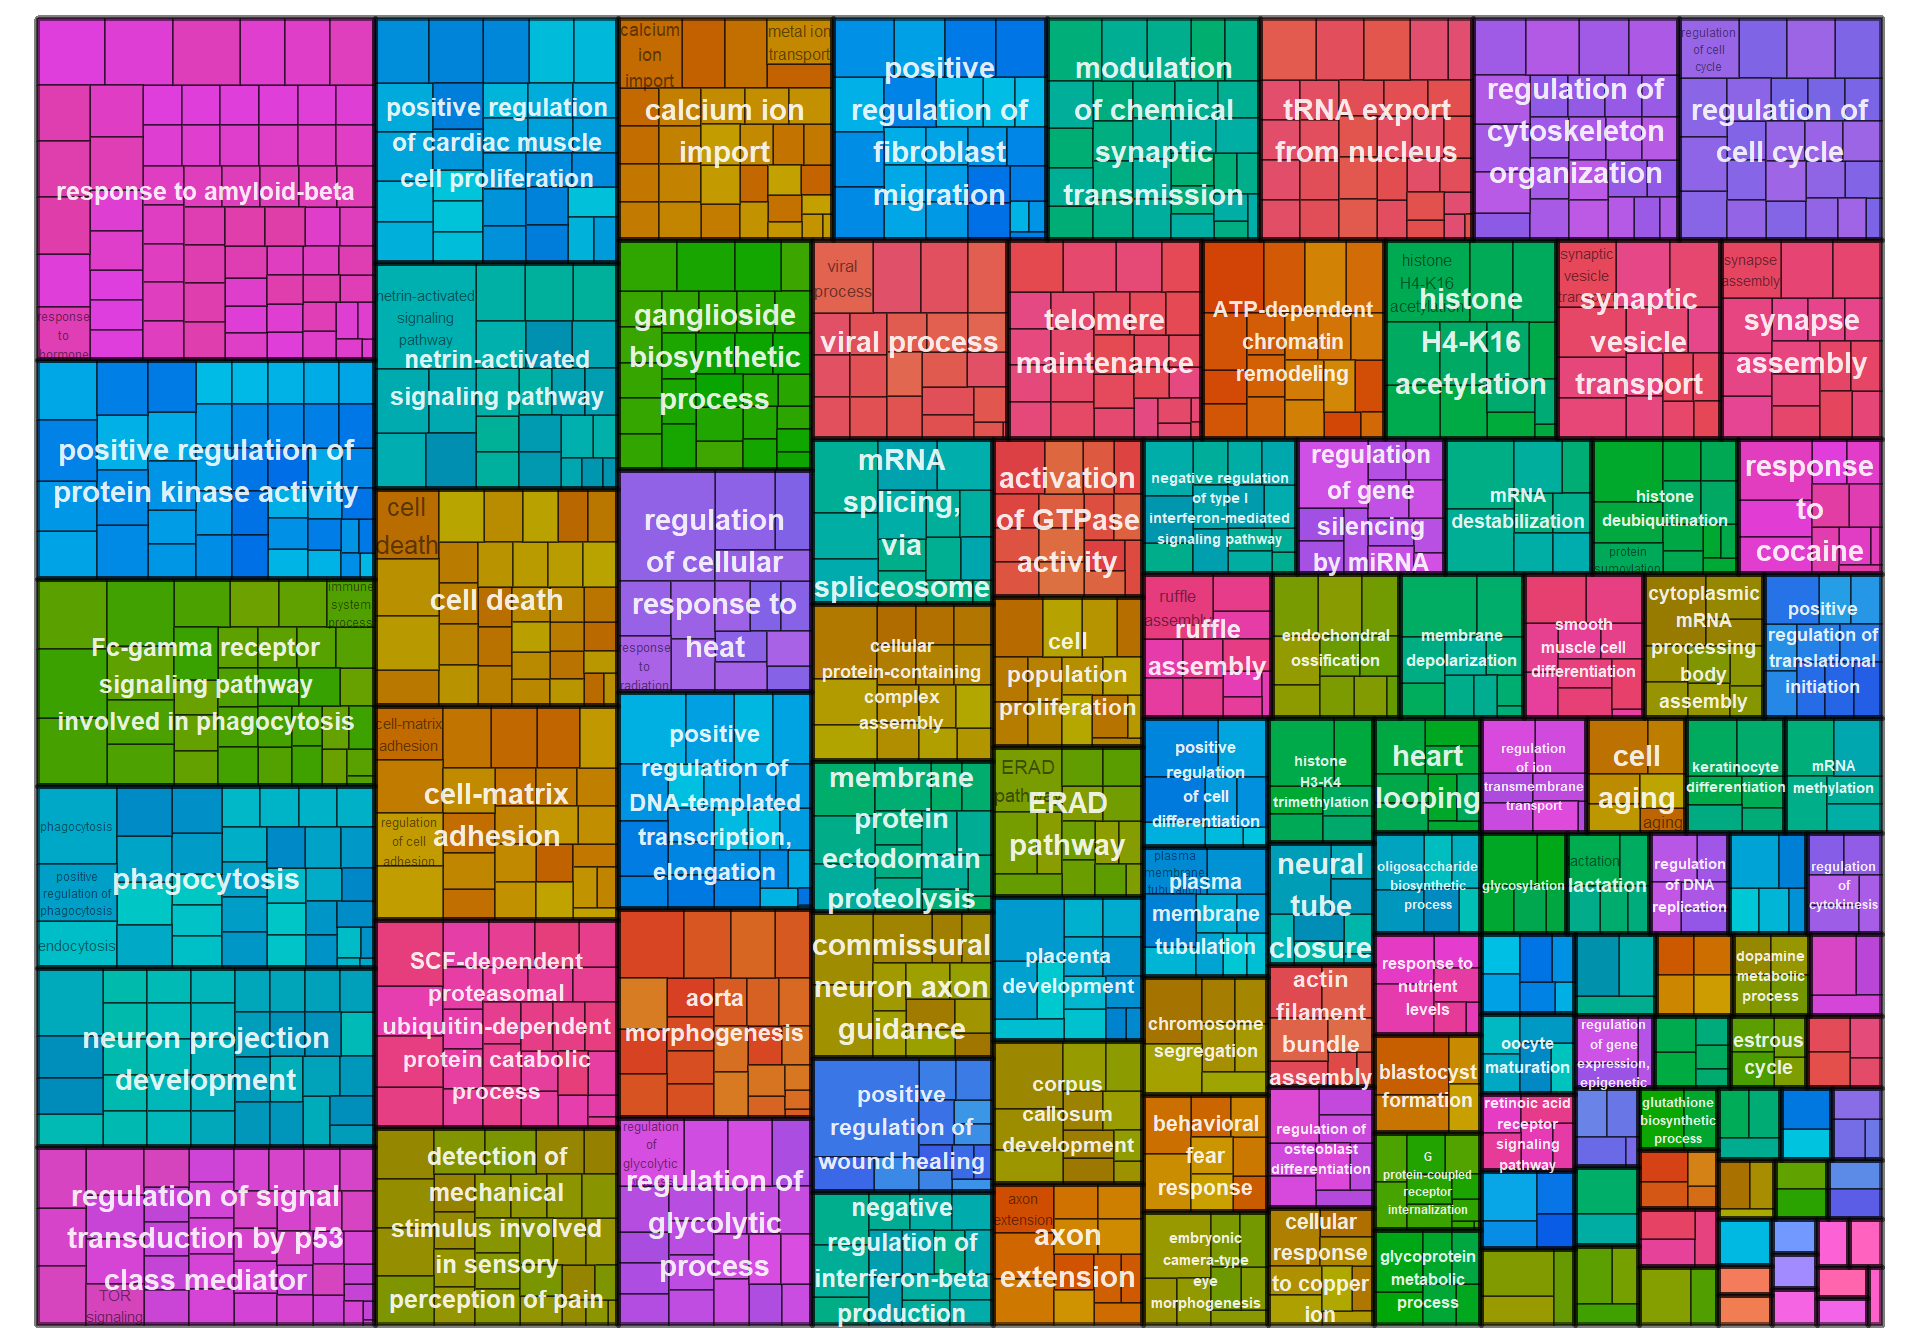
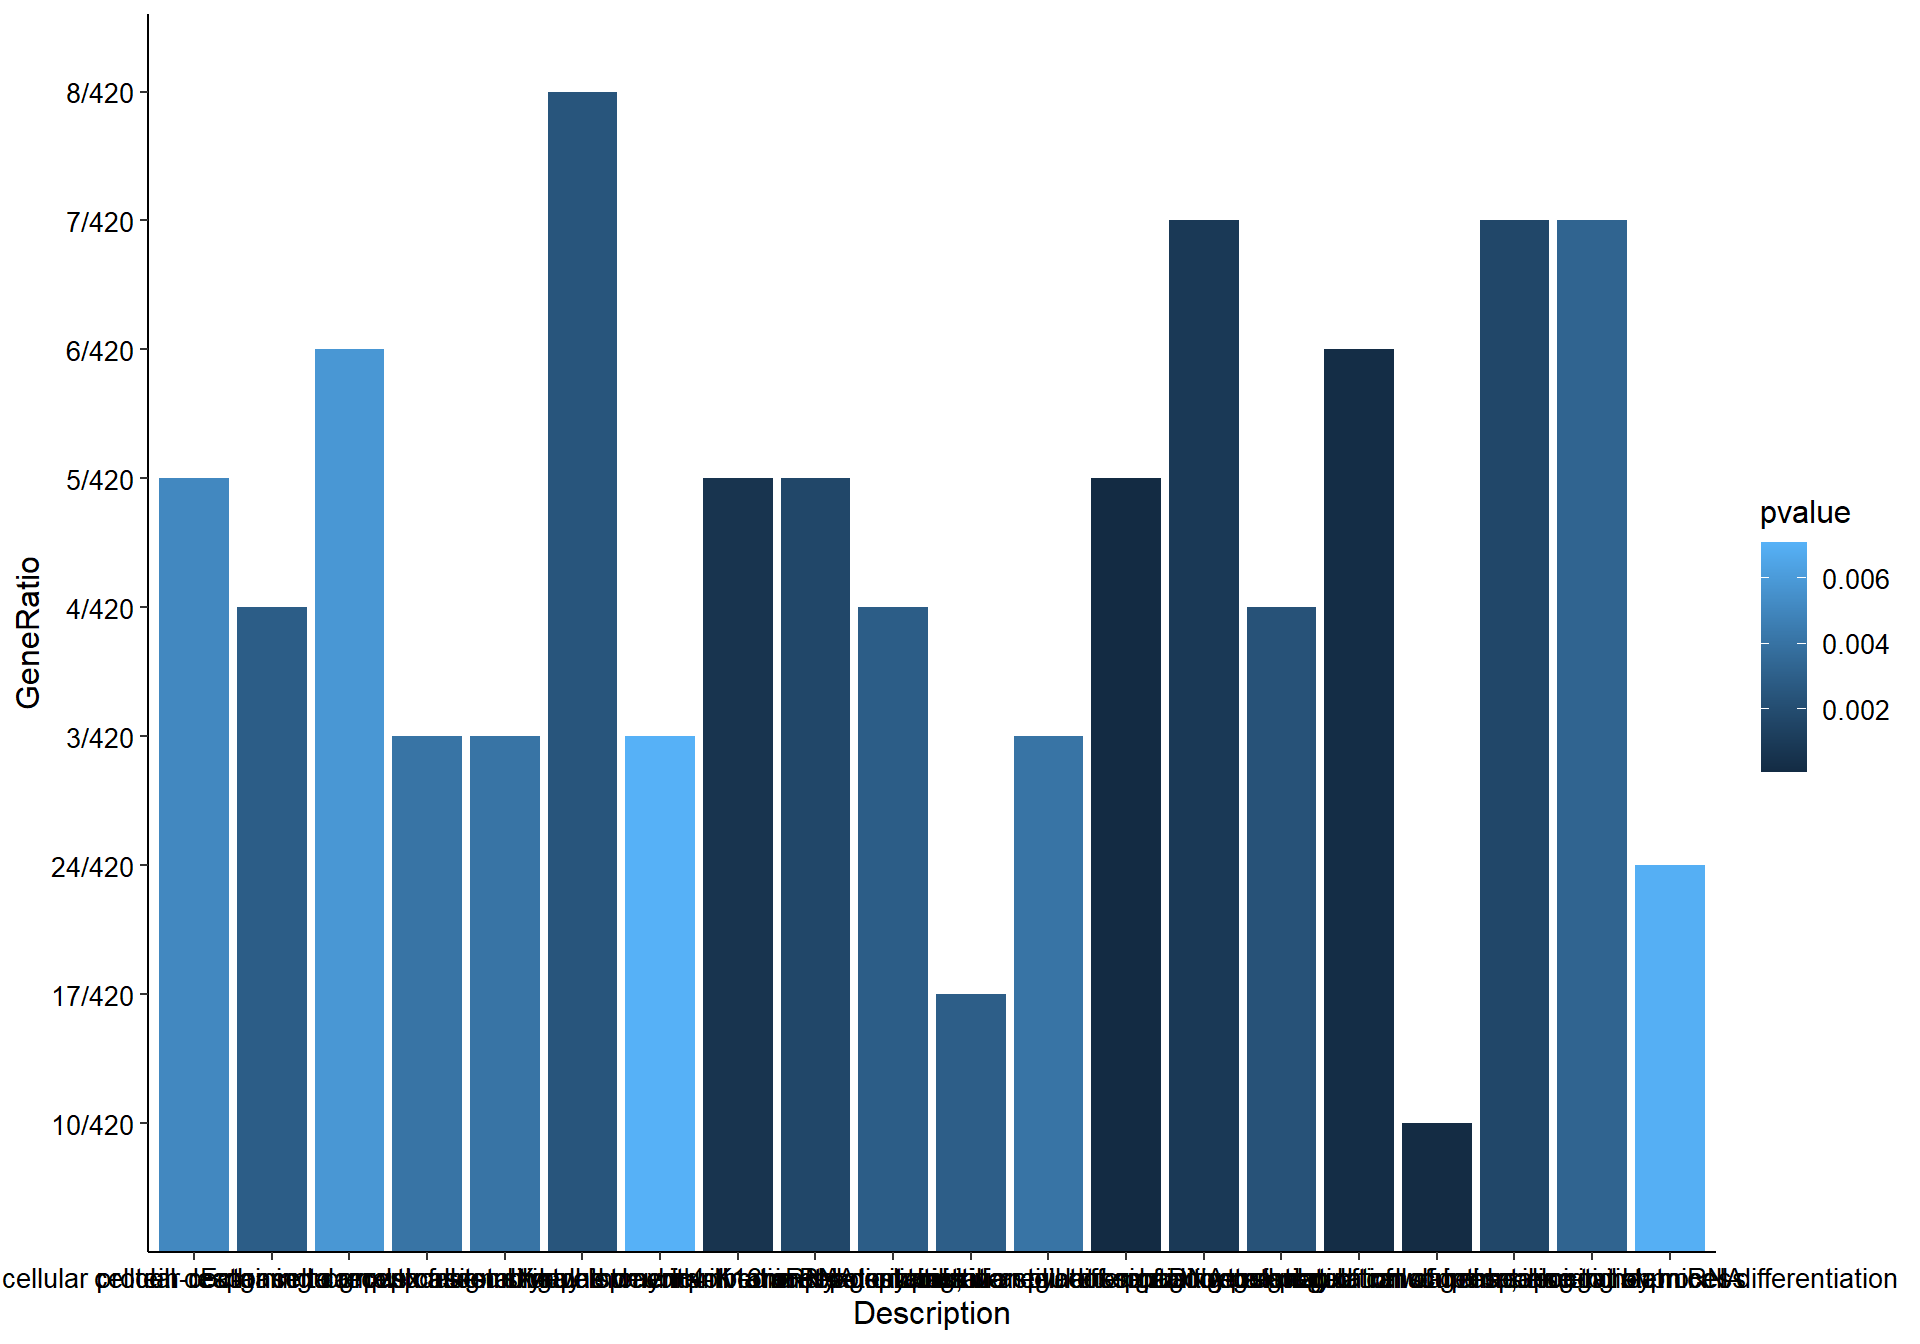
12.1.2 darkmagenta - strength
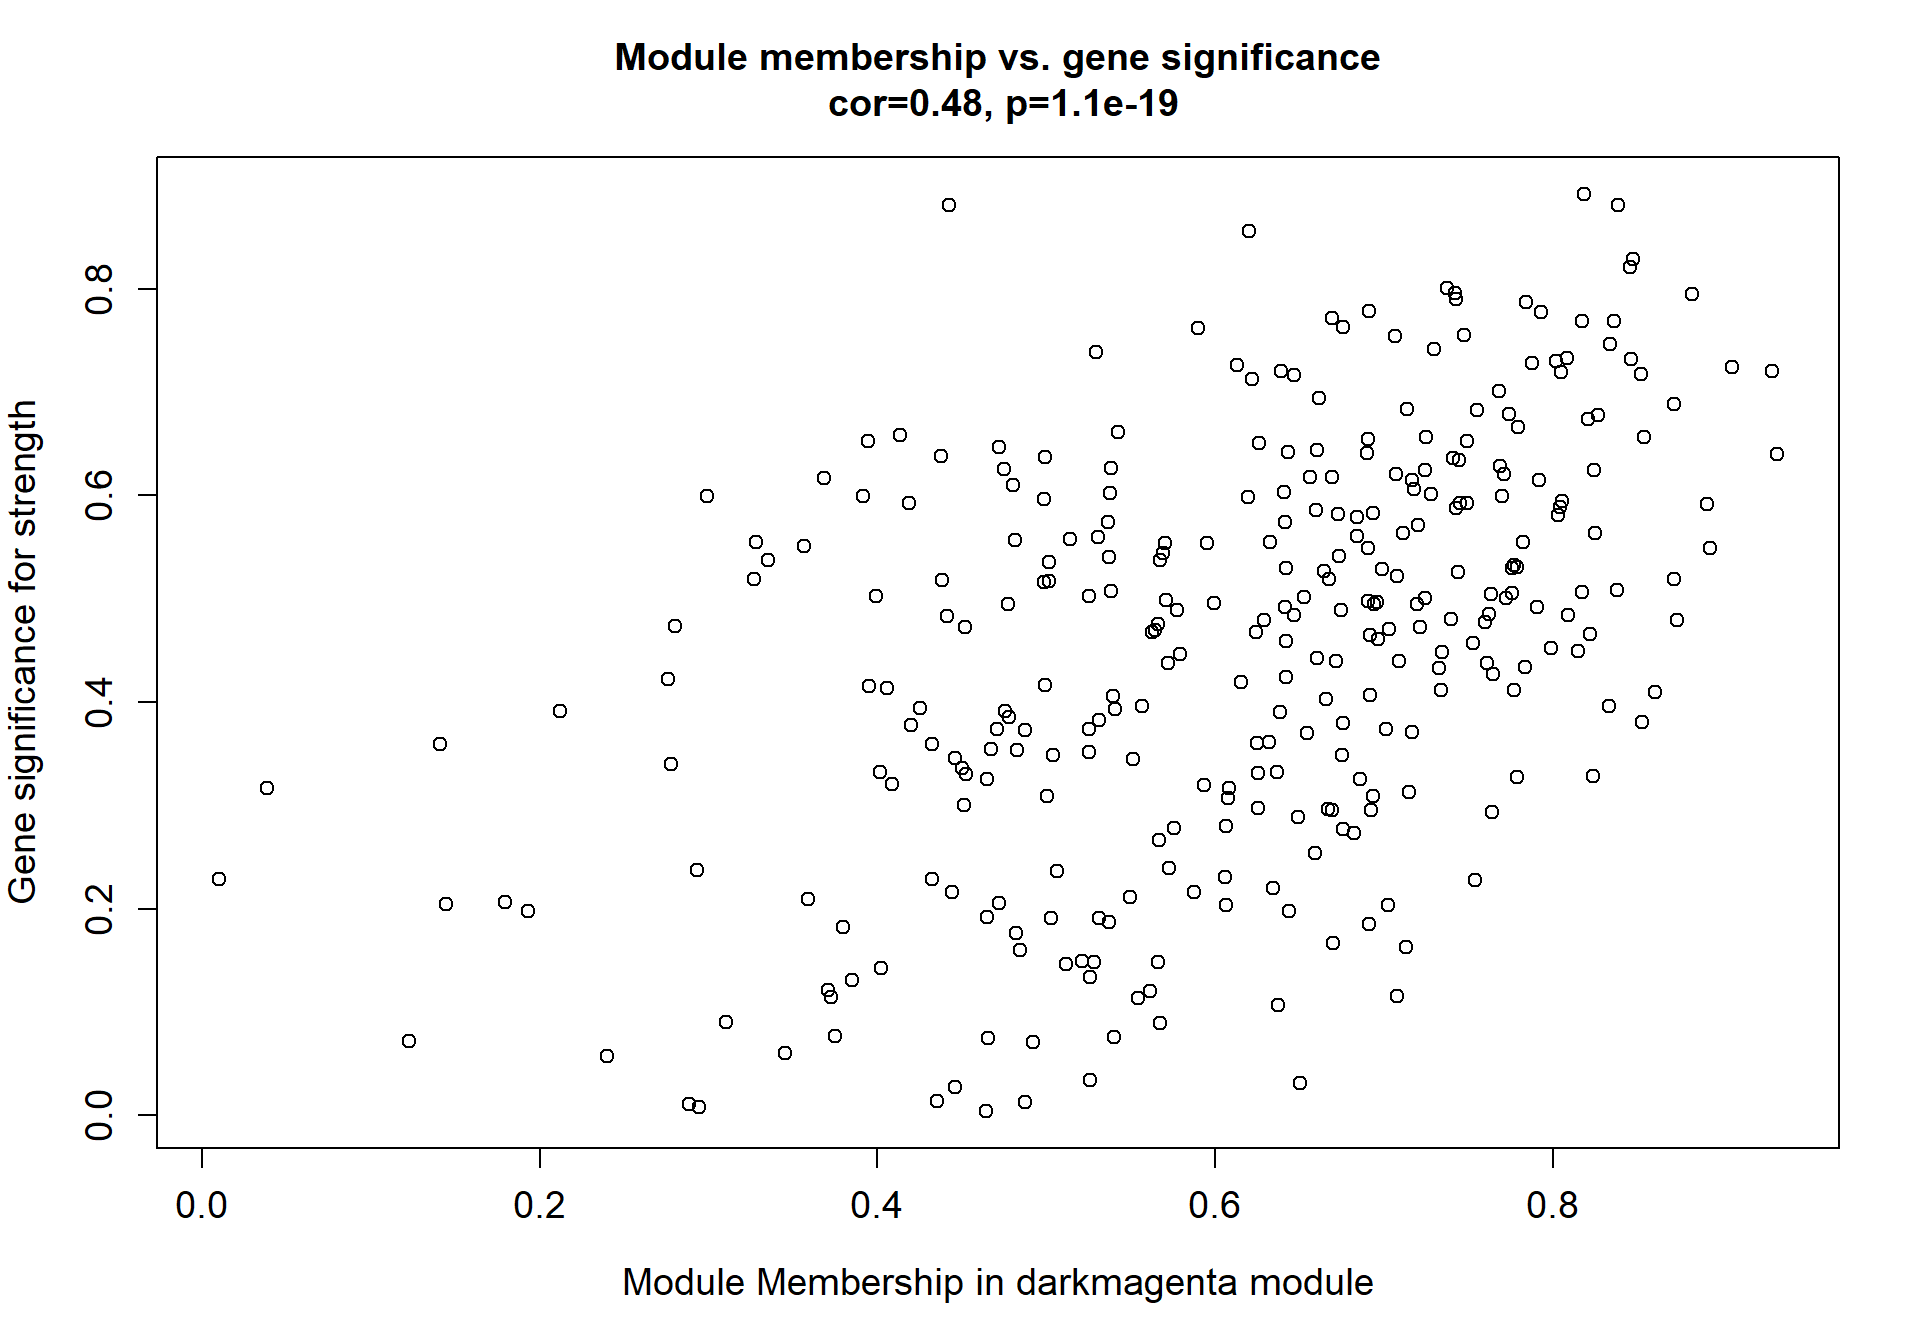
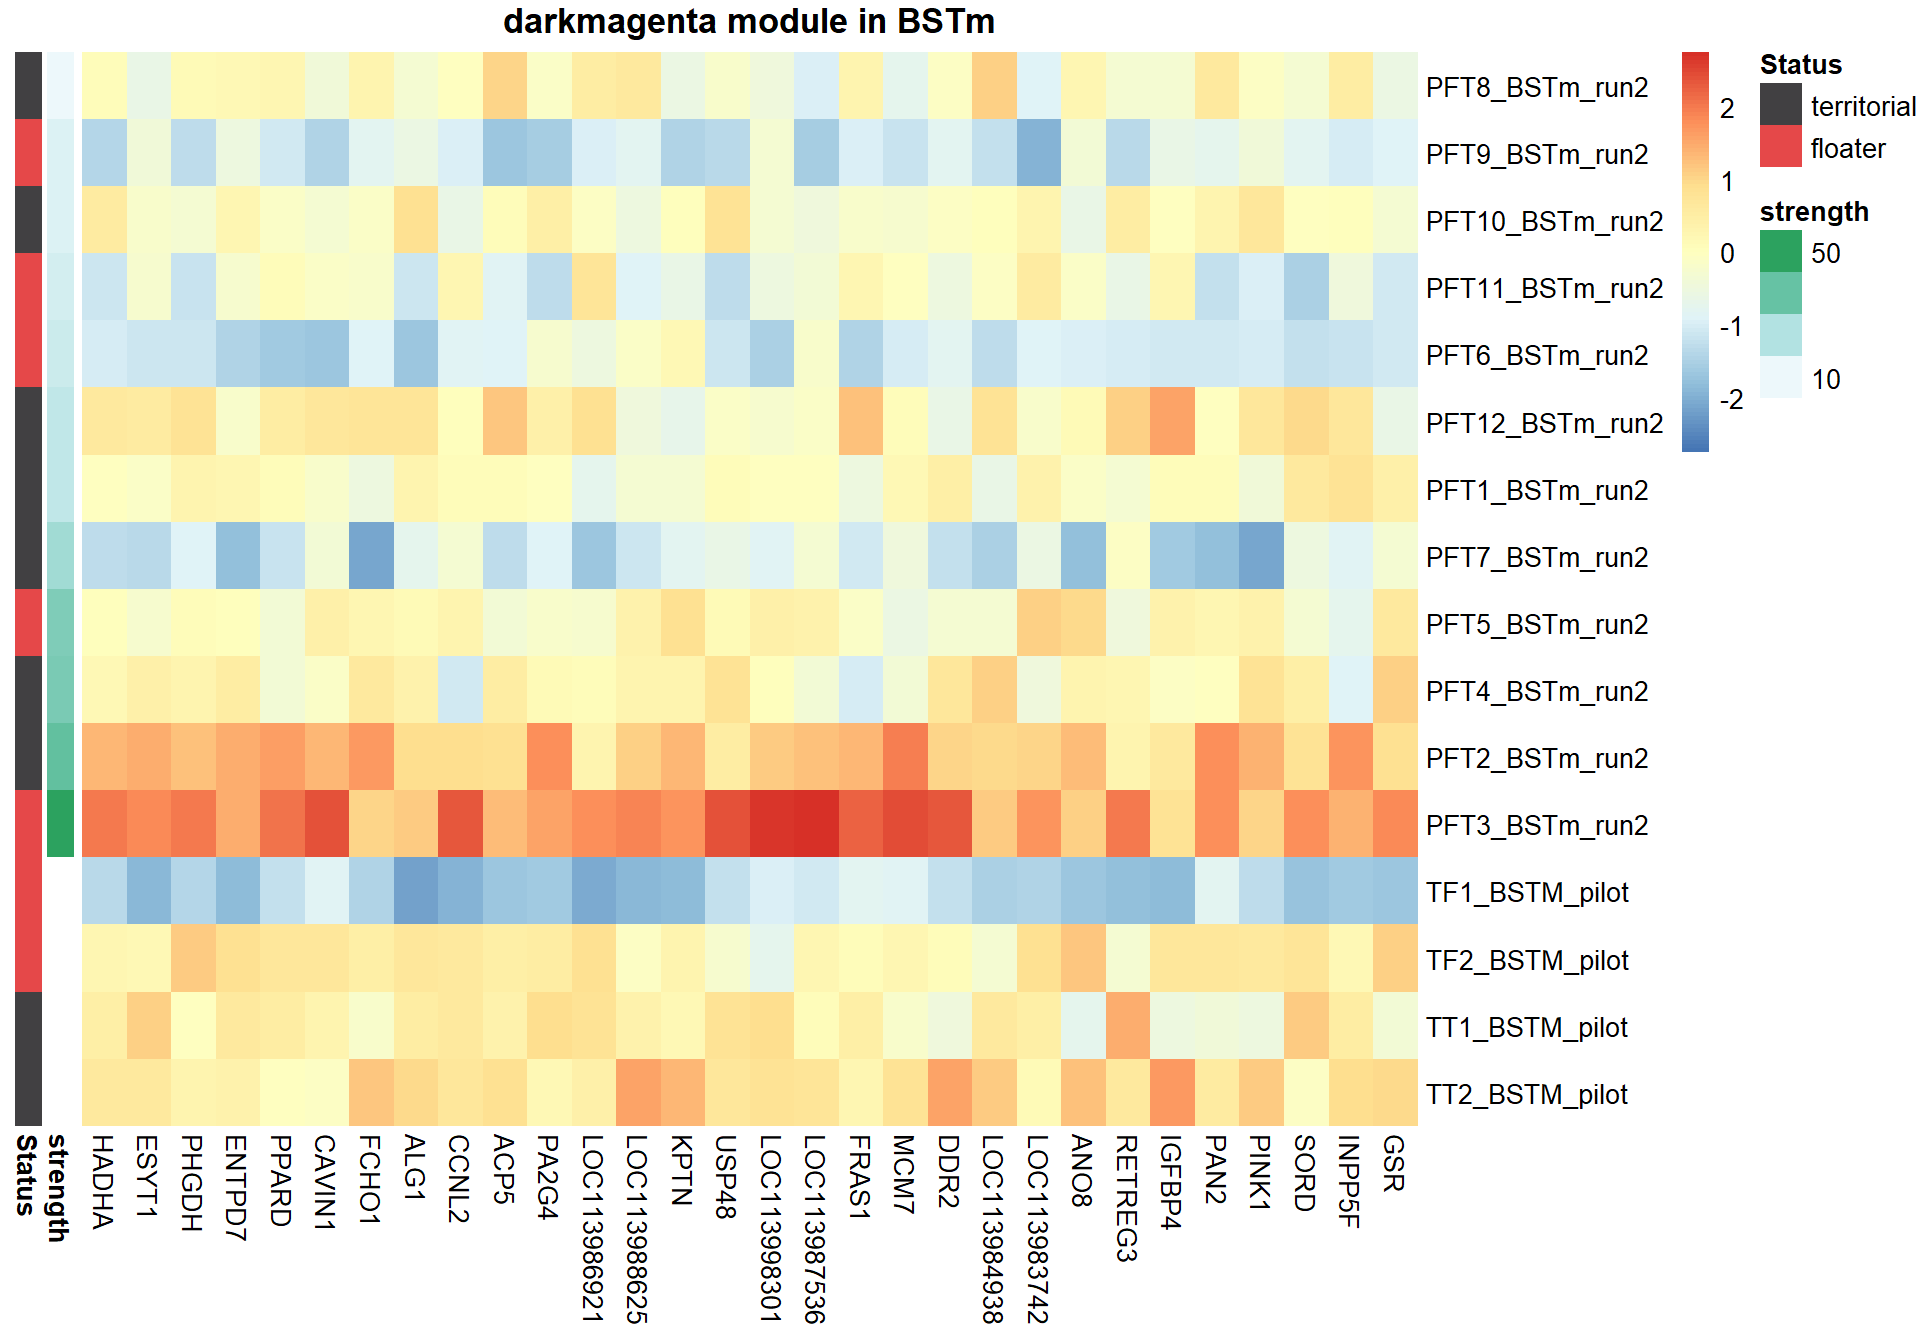
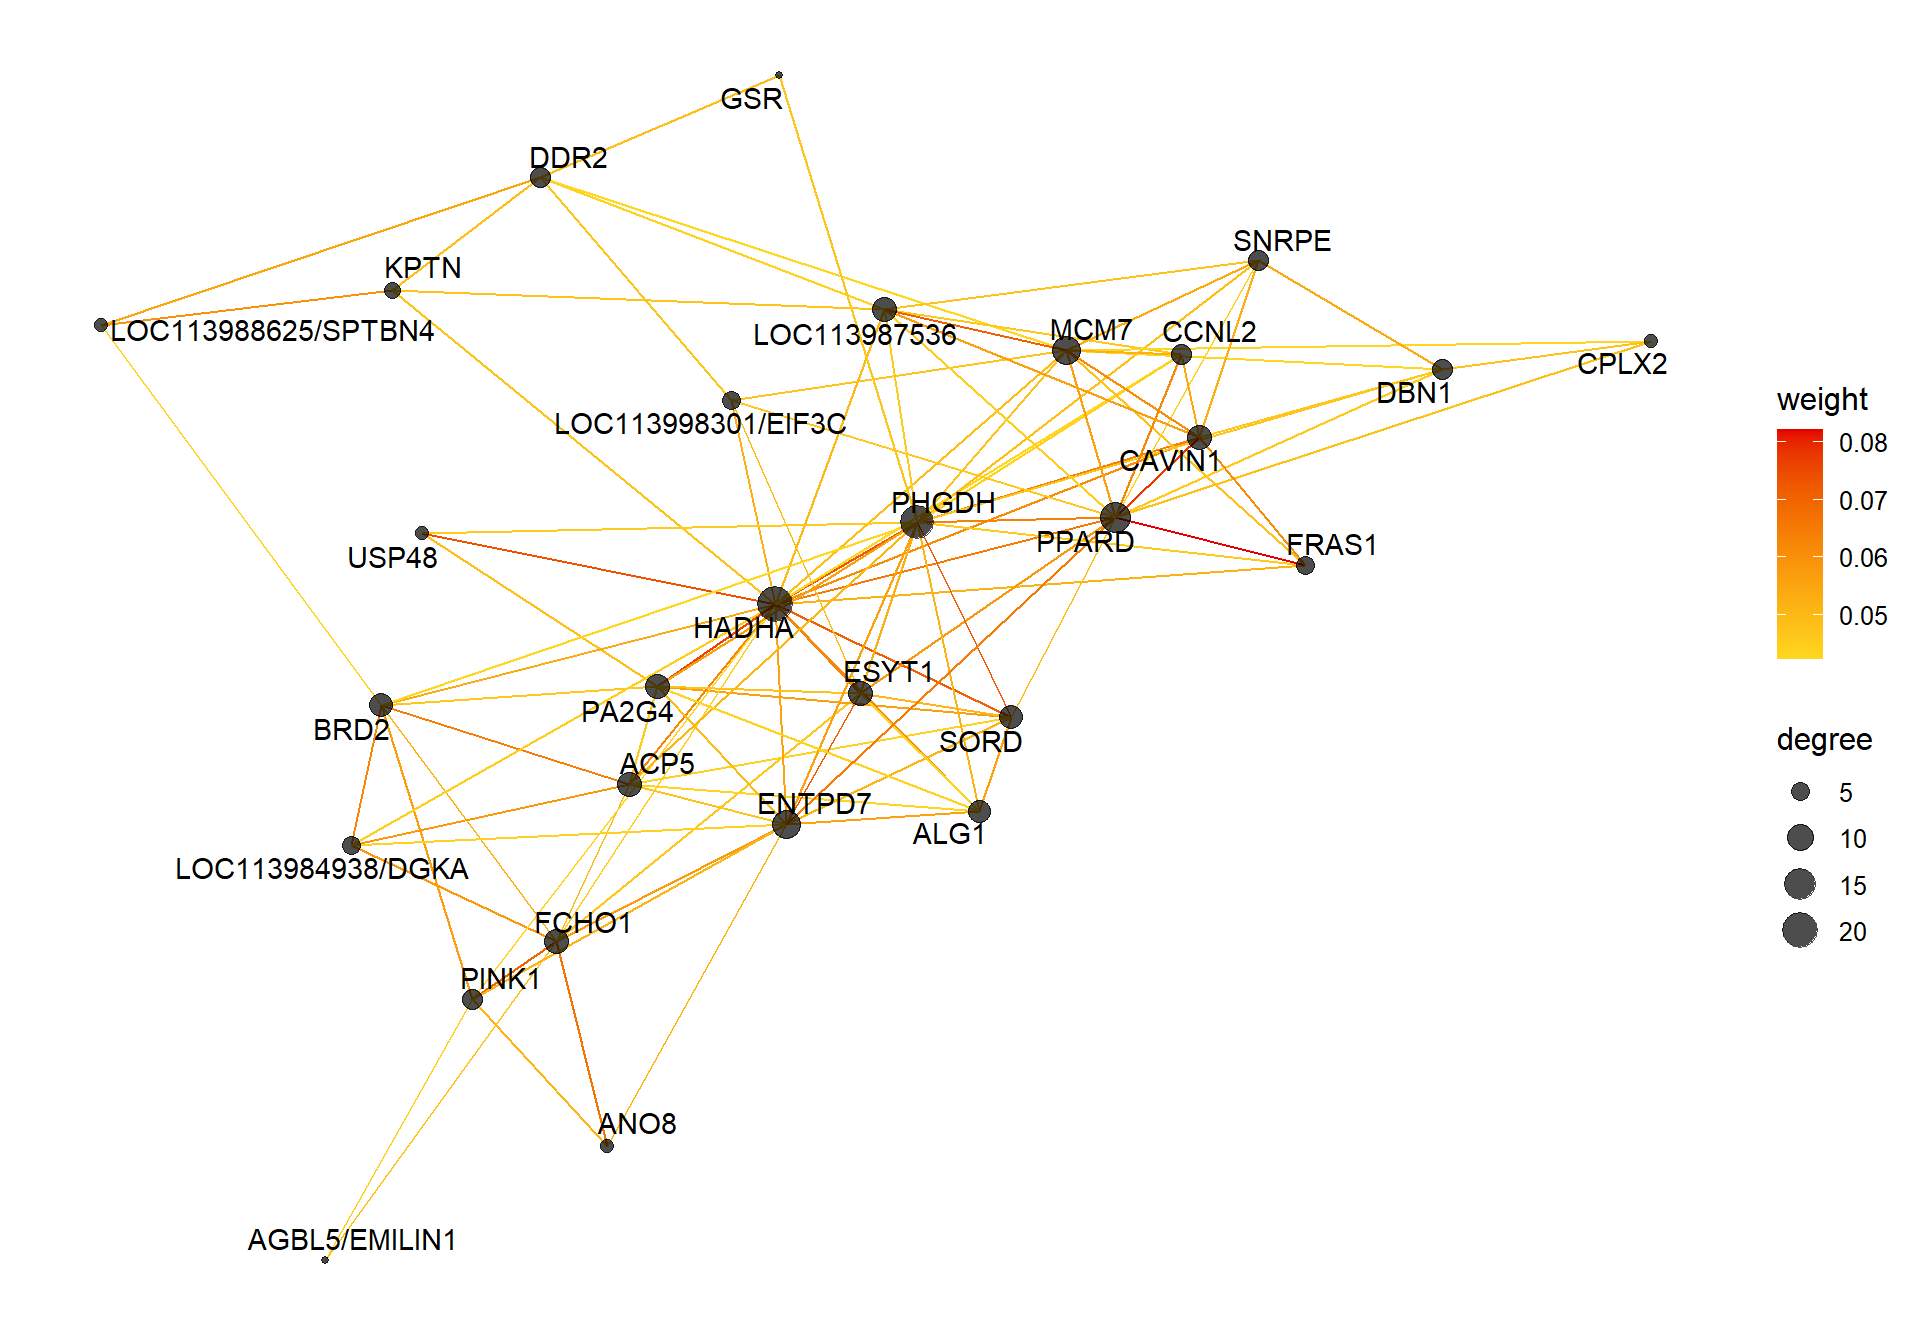
12.1.2.1 Gene Ontology
| ID | Description | GeneRatio | BgRatio | pvalue | p.adjust | qvalue | geneID | Count |
|---|---|---|---|---|---|---|---|---|
| GO:0055119 | relaxation of cardiac muscle | 3/256 | 11/12181 | 0.0013359 | 0.5366384 | 0.5205780 | ATP1A1/GSN/RGS2 | 3 |
| GO:0010887 | negative regulation of cholesterol storage | 3/256 | 12/12181 | 0.0017537 | 0.5366384 | 0.5205780 | ABCA7/LOC113986559/PPARD | 3 |
| GO:0051014 | actin filament severing | 3/256 | 12/12181 | 0.0017537 | 0.5366384 | 0.5205780 | CAPG/FMNL1/GSN | 3 |
| GO:2000377 | regulation of reactive oxygen species metabolic process | 3/256 | 14/12181 | 0.0028127 | 0.5634260 | 0.5465639 | BCO2/MPV17/PINK1 | 3 |
| GO:0002028 | regulation of sodium ion transport | 3/256 | 15/12181 | 0.0034618 | 0.5634260 | 0.5465639 | ADRB2/ATP1A1/LOC113988625 | 3 |
| GO:0006904 | vesicle docking involved in exocytosis | 4/256 | 34/12181 | 0.0053839 | 0.5634260 | 0.5465639 | CPLX2/RAB15/RABEPK/VPS33B | 4 |
| GO:0043407 | negative regulation of MAP kinase activity | 4/256 | 34/12181 | 0.0053839 | 0.5634260 | 0.5465639 | CDK5RAP3/LOC113991889/PIK3CB/RGS2 | 4 |
| GO:0008203 | cholesterol metabolic process | 5/256 | 58/12181 | 0.0072969 | 0.5634260 | 0.5465639 | ABCA7/LOC113986559/LOC113991750/LRP5/PPARD | 5 |
| GO:0030168 | platelet activation | 6/256 | 83/12181 | 0.0079613 | 0.5634260 | 0.5465639 | ADAMTS13/DGKZ/LOC113984938/LOC113991889/LOC113997278/PIK3CB | 6 |
| GO:0051056 | regulation of small GTPase mediated signal transduction | 8/256 | 141/12181 | 0.0098161 | 0.5634260 | 0.5465639 | ARHGAP17/ARHGAP19/ARHGEF16/INPP5B/LOC113997278/OPHN1/RHOU/SYDE2 | 8 |
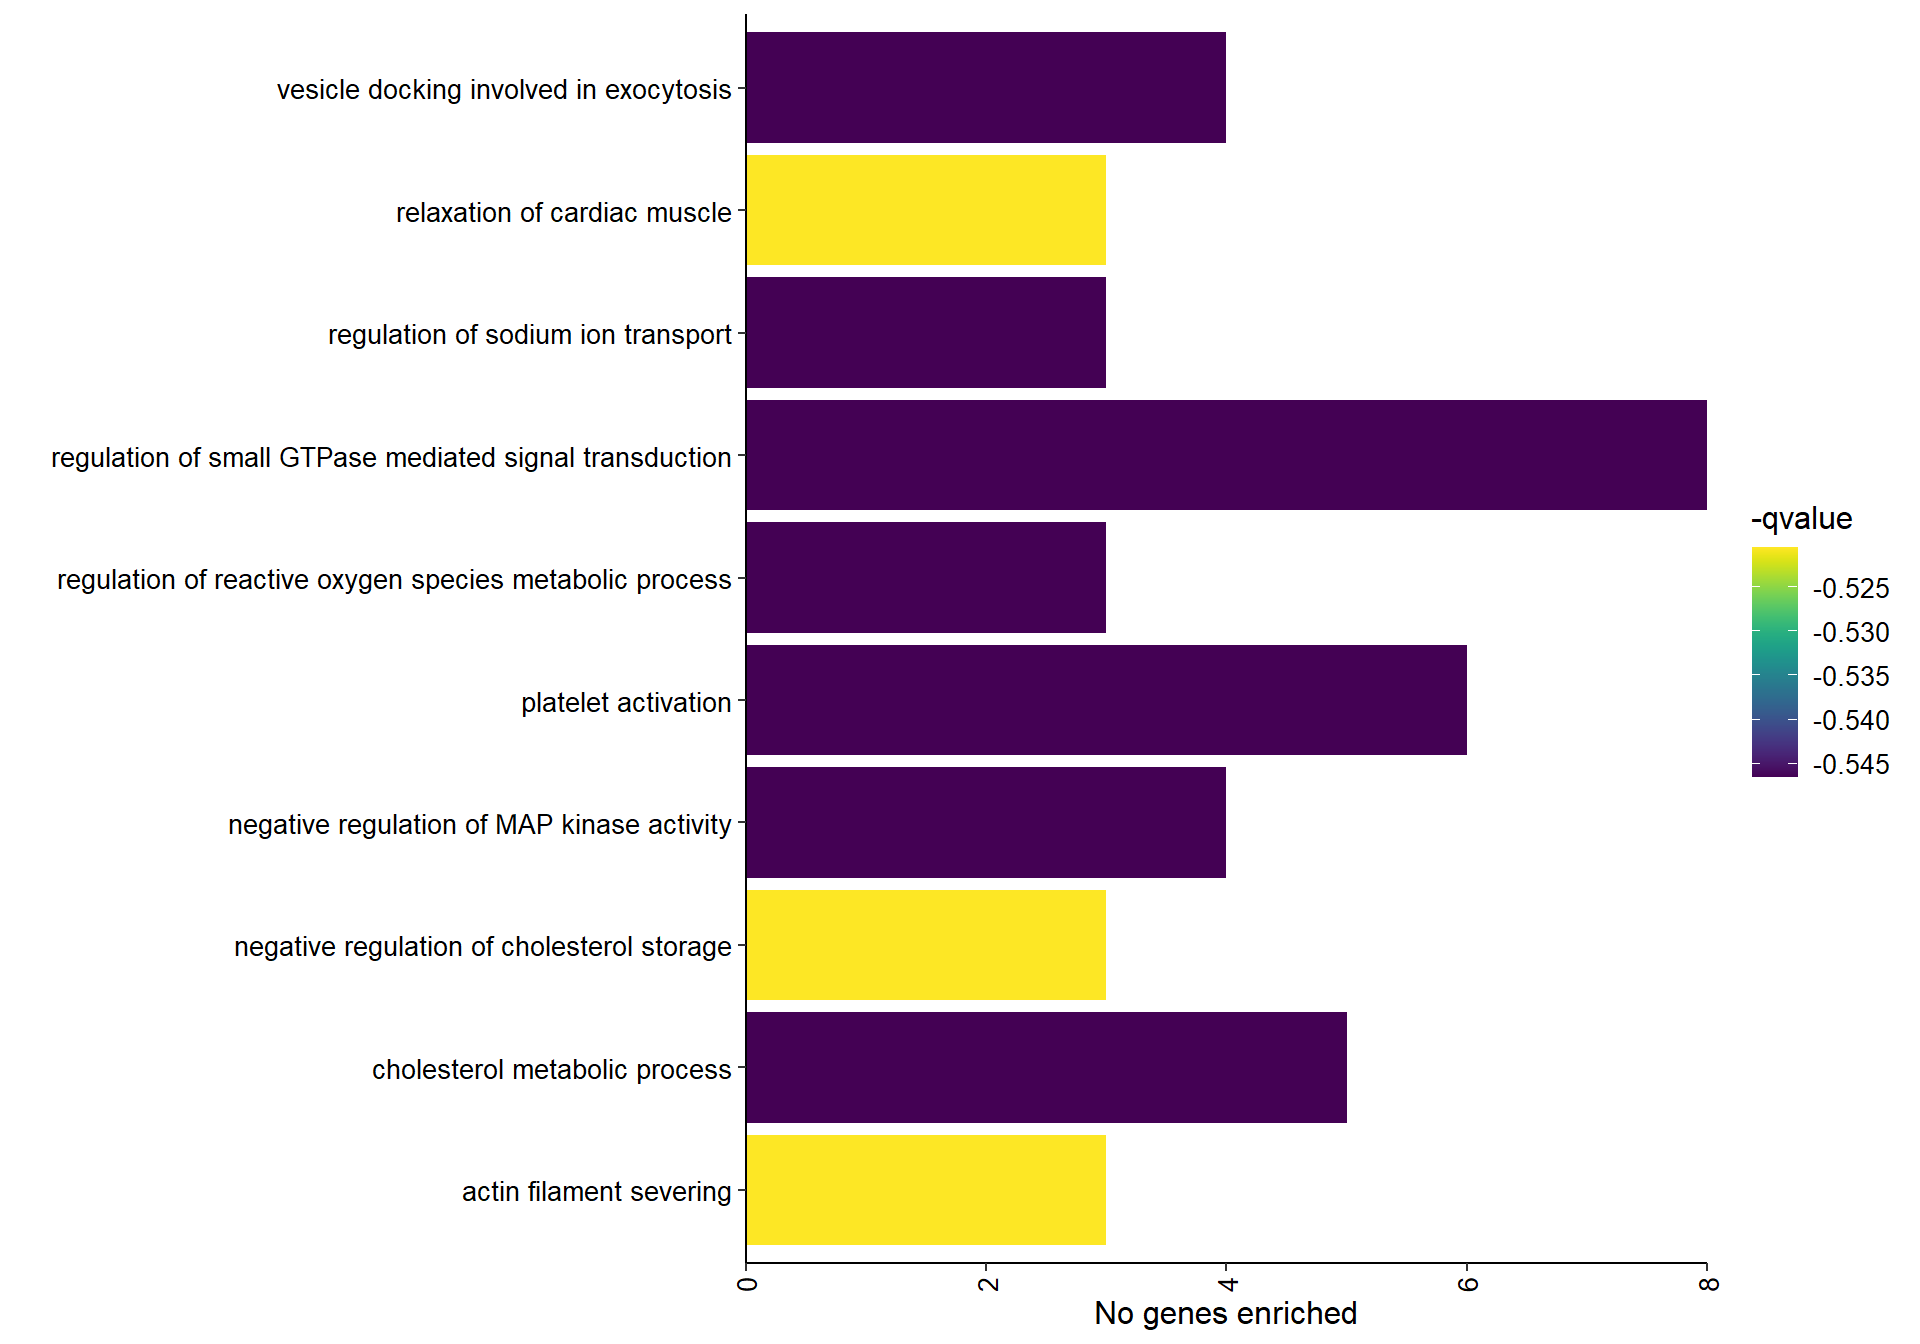
## preparing gene to GO mapping data...## preparing IC data...## Warning in if (class(try(col2rgb(palette), silent = TRUE)) == "try-error")
## stop("color palette is not correct"): the condition has length > 1 and only the
## first element will be used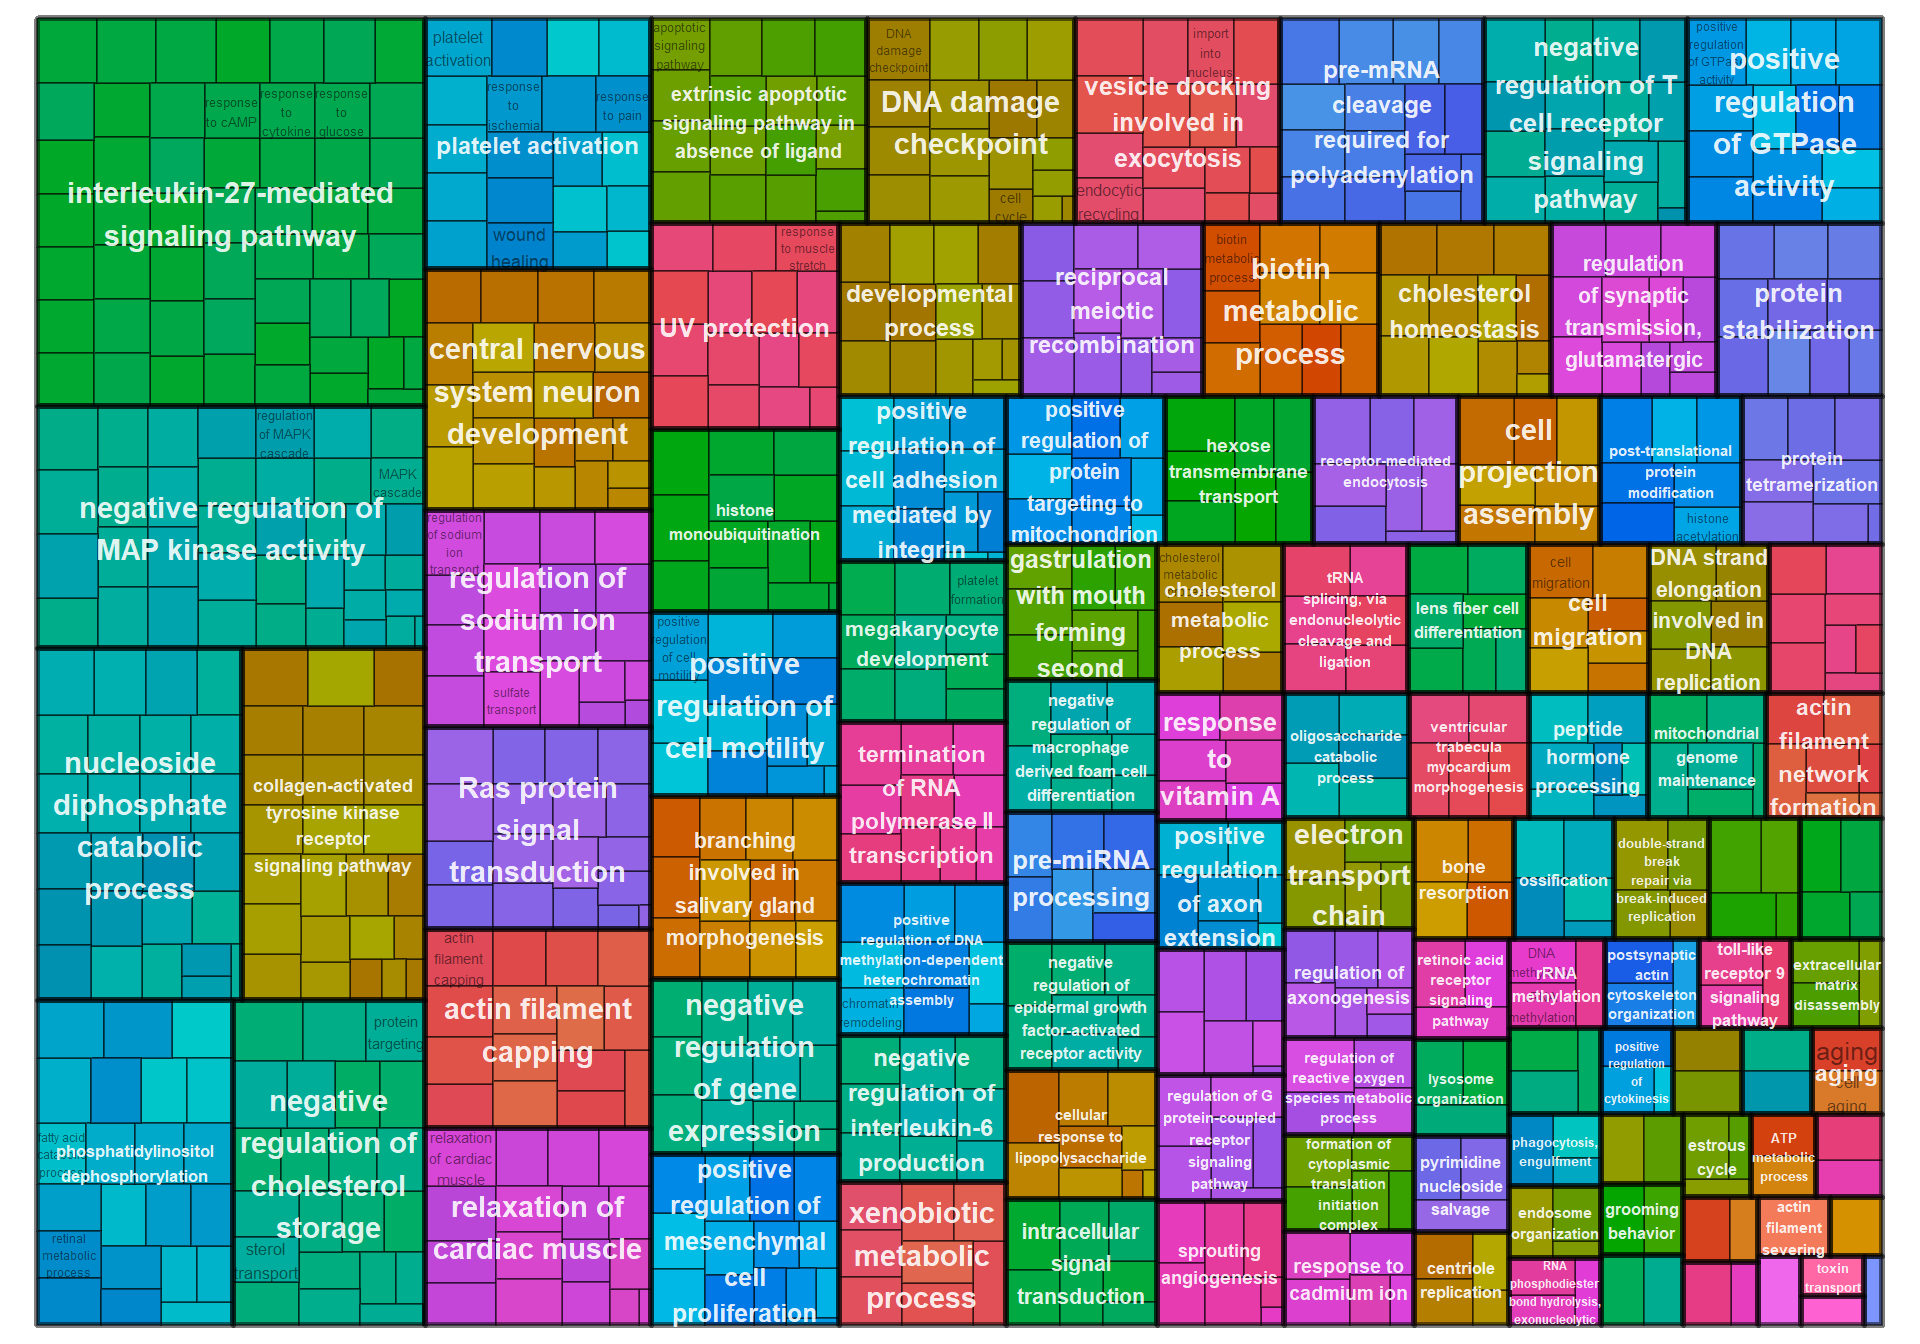
12.1.3 saddlebrown - strength
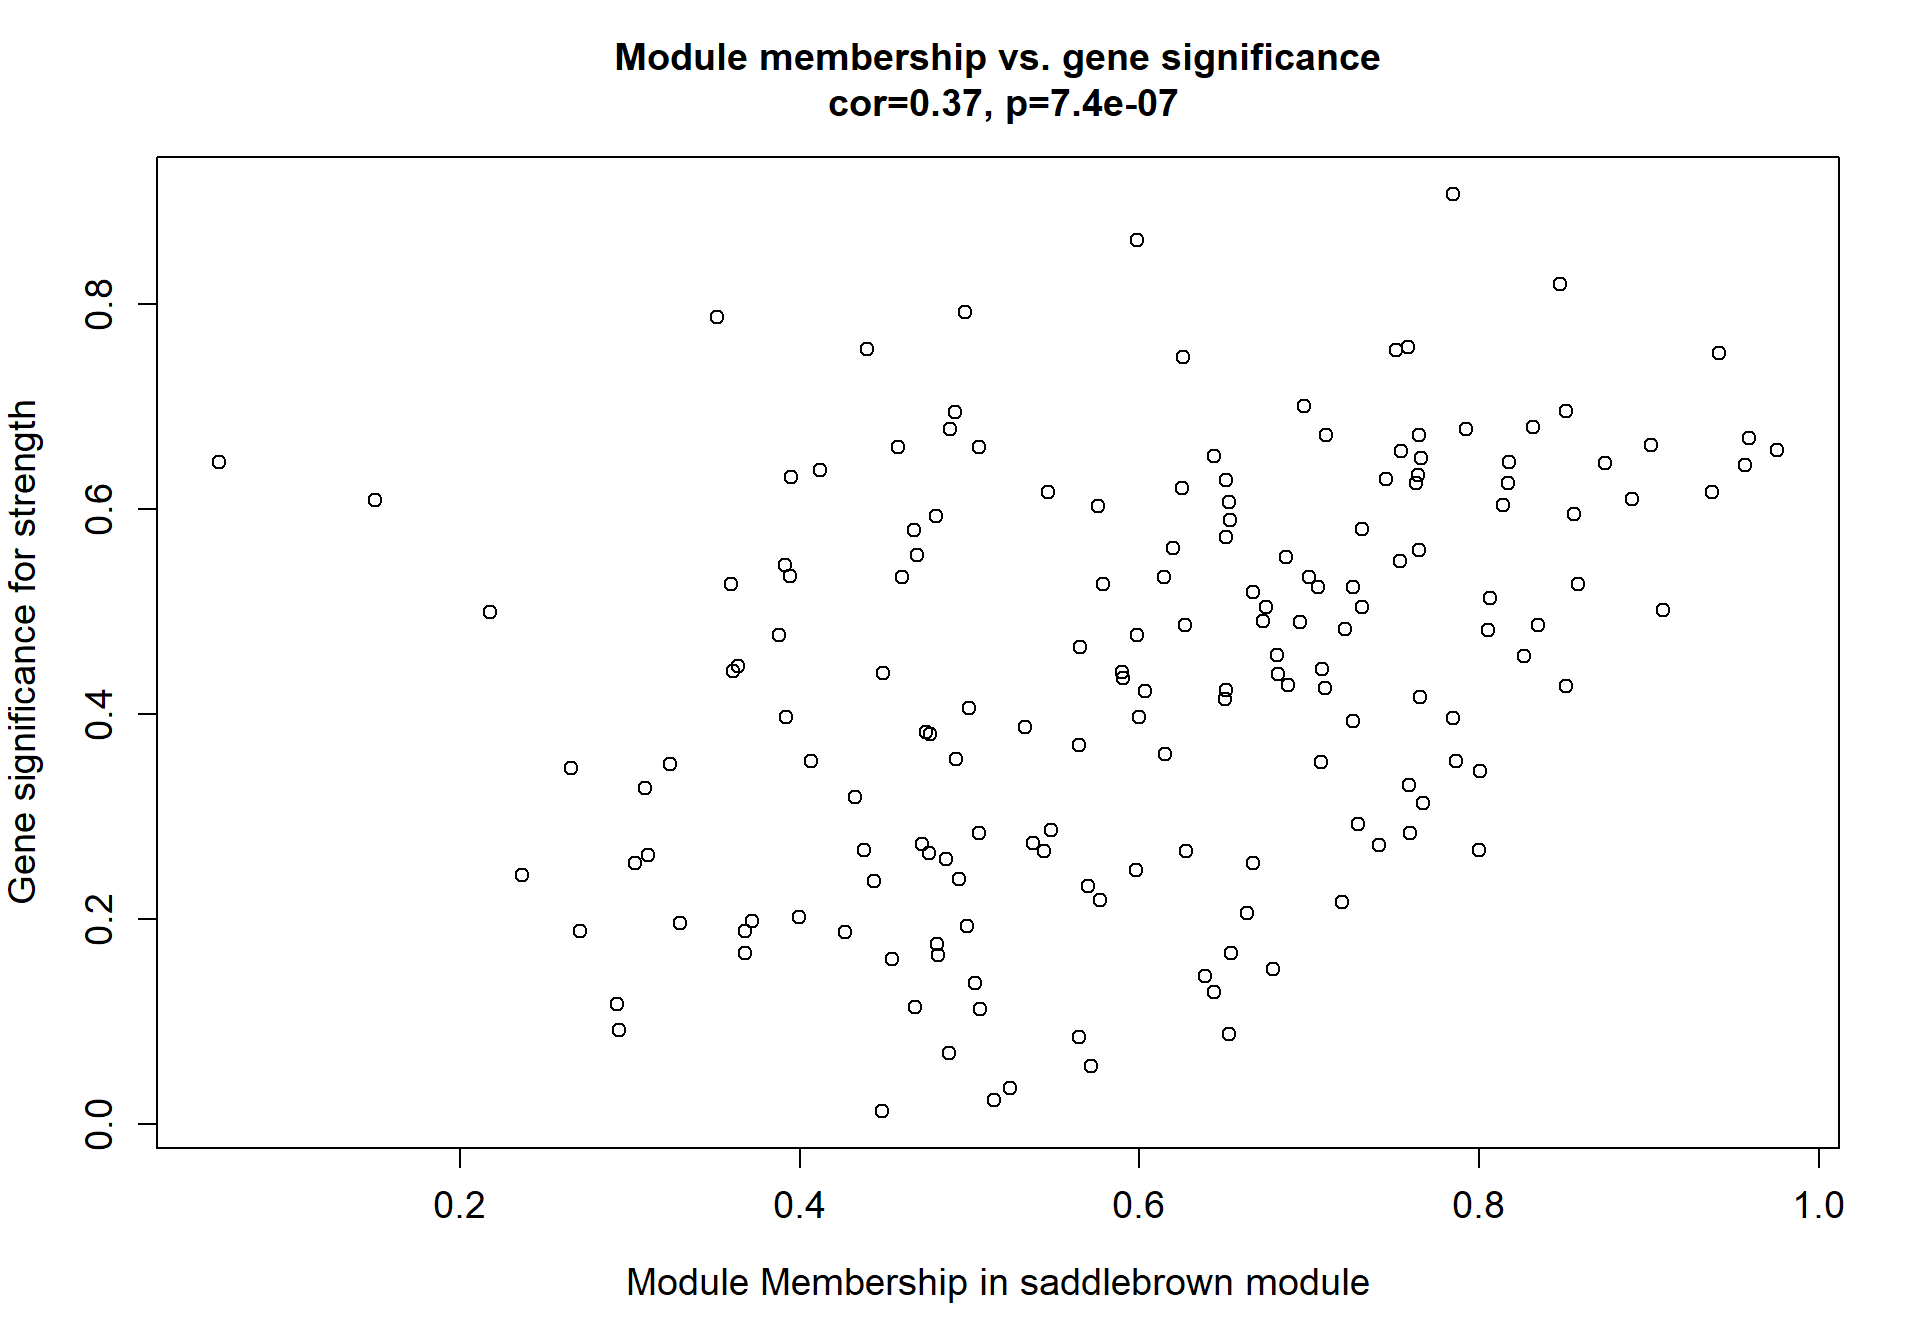
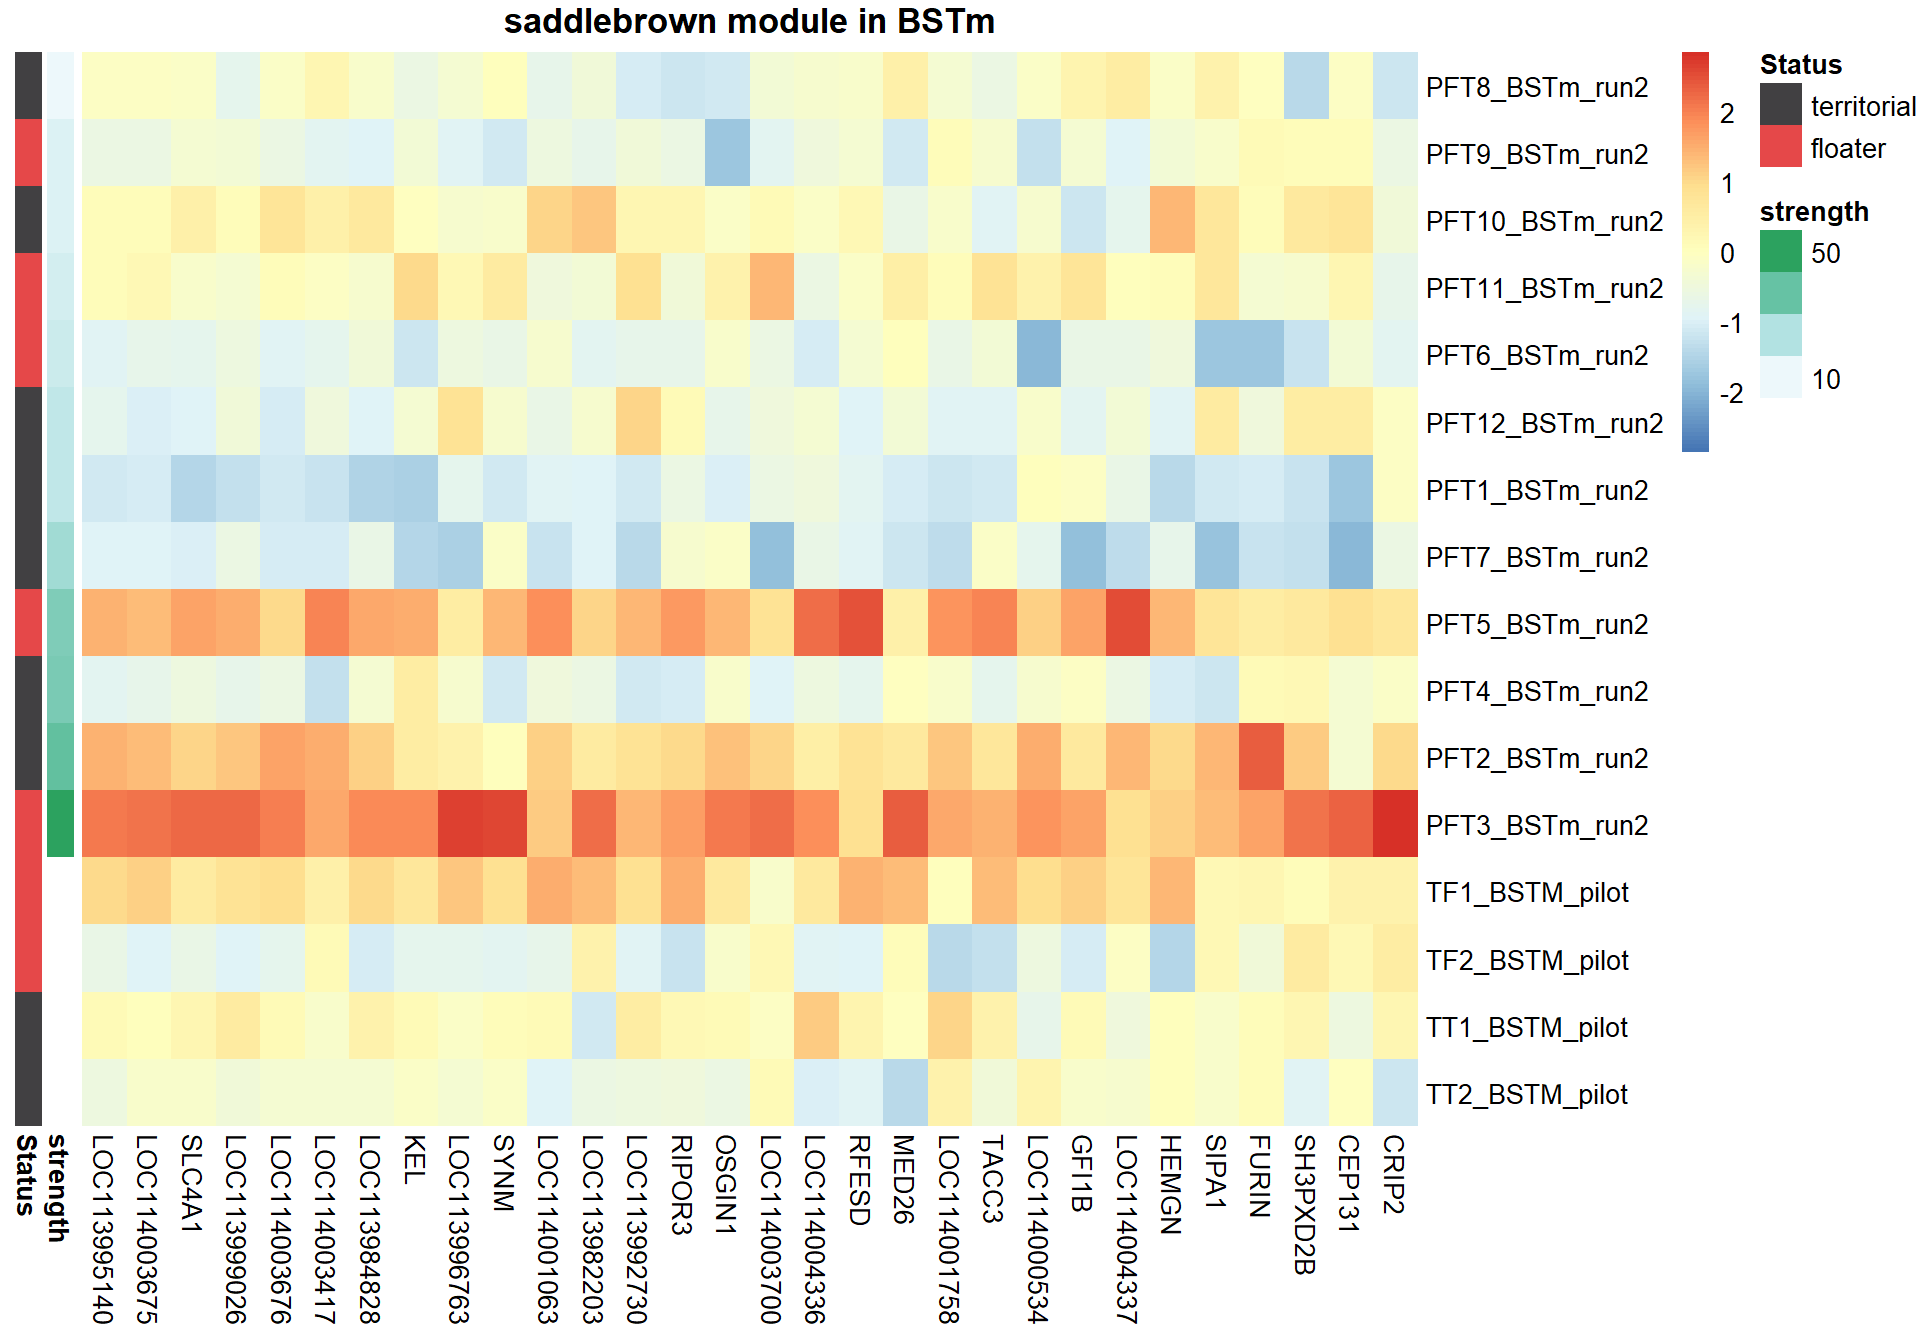

12.1.3.1 Gene Ontology
| ID | Description | GeneRatio | BgRatio | pvalue | p.adjust | qvalue | geneID | Count |
|---|---|---|---|---|---|---|---|---|
| GO:0015701 | bicarbonate transport | 5/128 | 33/12181 | 0.0000222 | 0.0113948 | 0.0110398 | LOC113995938/LOC114003675/RHAG/SLC4A1/SLC4A4 | 5 |
| GO:0042307 | positive regulation of protein import into nucleus | 5/128 | 37/12181 | 0.0000394 | 0.0113948 | 0.0110398 | DMAP1/LOC113989827/LOC114001403/SMO/ZC3H12A | 5 |
| GO:2000379 | positive regulation of reactive oxygen species metabolic process | 4/128 | 20/12181 | 0.0000495 | 0.0113948 | 0.0110398 | LOC114001403/NFE2L2/PDGFRB/ZC3H12A | 4 |
| GO:2000036 | regulation of stem cell population maintenance | 3/128 | 13/12181 | 0.0003001 | 0.0518481 | 0.0502329 | SAV1/SMO/TAL1 | 3 |
| GO:0050801 | ion homeostasis | 3/128 | 18/12181 | 0.0008240 | 0.1100942 | 0.1066645 | SLC4A1/SLC4A4/WNK4 | 3 |
| GO:0006635 | fatty acid beta-oxidation | 4/128 | 42/12181 | 0.0009560 | 0.1100942 | 0.1066645 | DECR1/ECH1/LOC114001403/SESN2 | 4 |
| GO:0001525 | angiogenesis | 8/128 | 203/12181 | 0.0013439 | 0.1326657 | 0.1285329 | IL18/JUN/LOC113989827/LOC114001403/PLXND1/TAL1/WASF2/ZC3H12A | 8 |
| GO:0098869 | cellular oxidant detoxification | 4/128 | 55/12181 | 0.0026226 | 0.2265230 | 0.2194663 | LOC113986834/LOC114003675/SELENOW/SESN2 | 4 |
| GO:0043123 | positive regulation of I-kappaB kinase/NF-kappaB signaling | 6/128 | 146/12181 | 0.0043831 | 0.3224010 | 0.3123574 | CARD11/LOC113989827/NEK6/TMEM101/TRIM32/WLS | 6 |
| GO:0043249 | erythrocyte maturation | 2/128 | 10/12181 | 0.0046657 | 0.3224010 | 0.3123574 | LOC114001063/TAL1 | 2 |
13 WGCNA summary
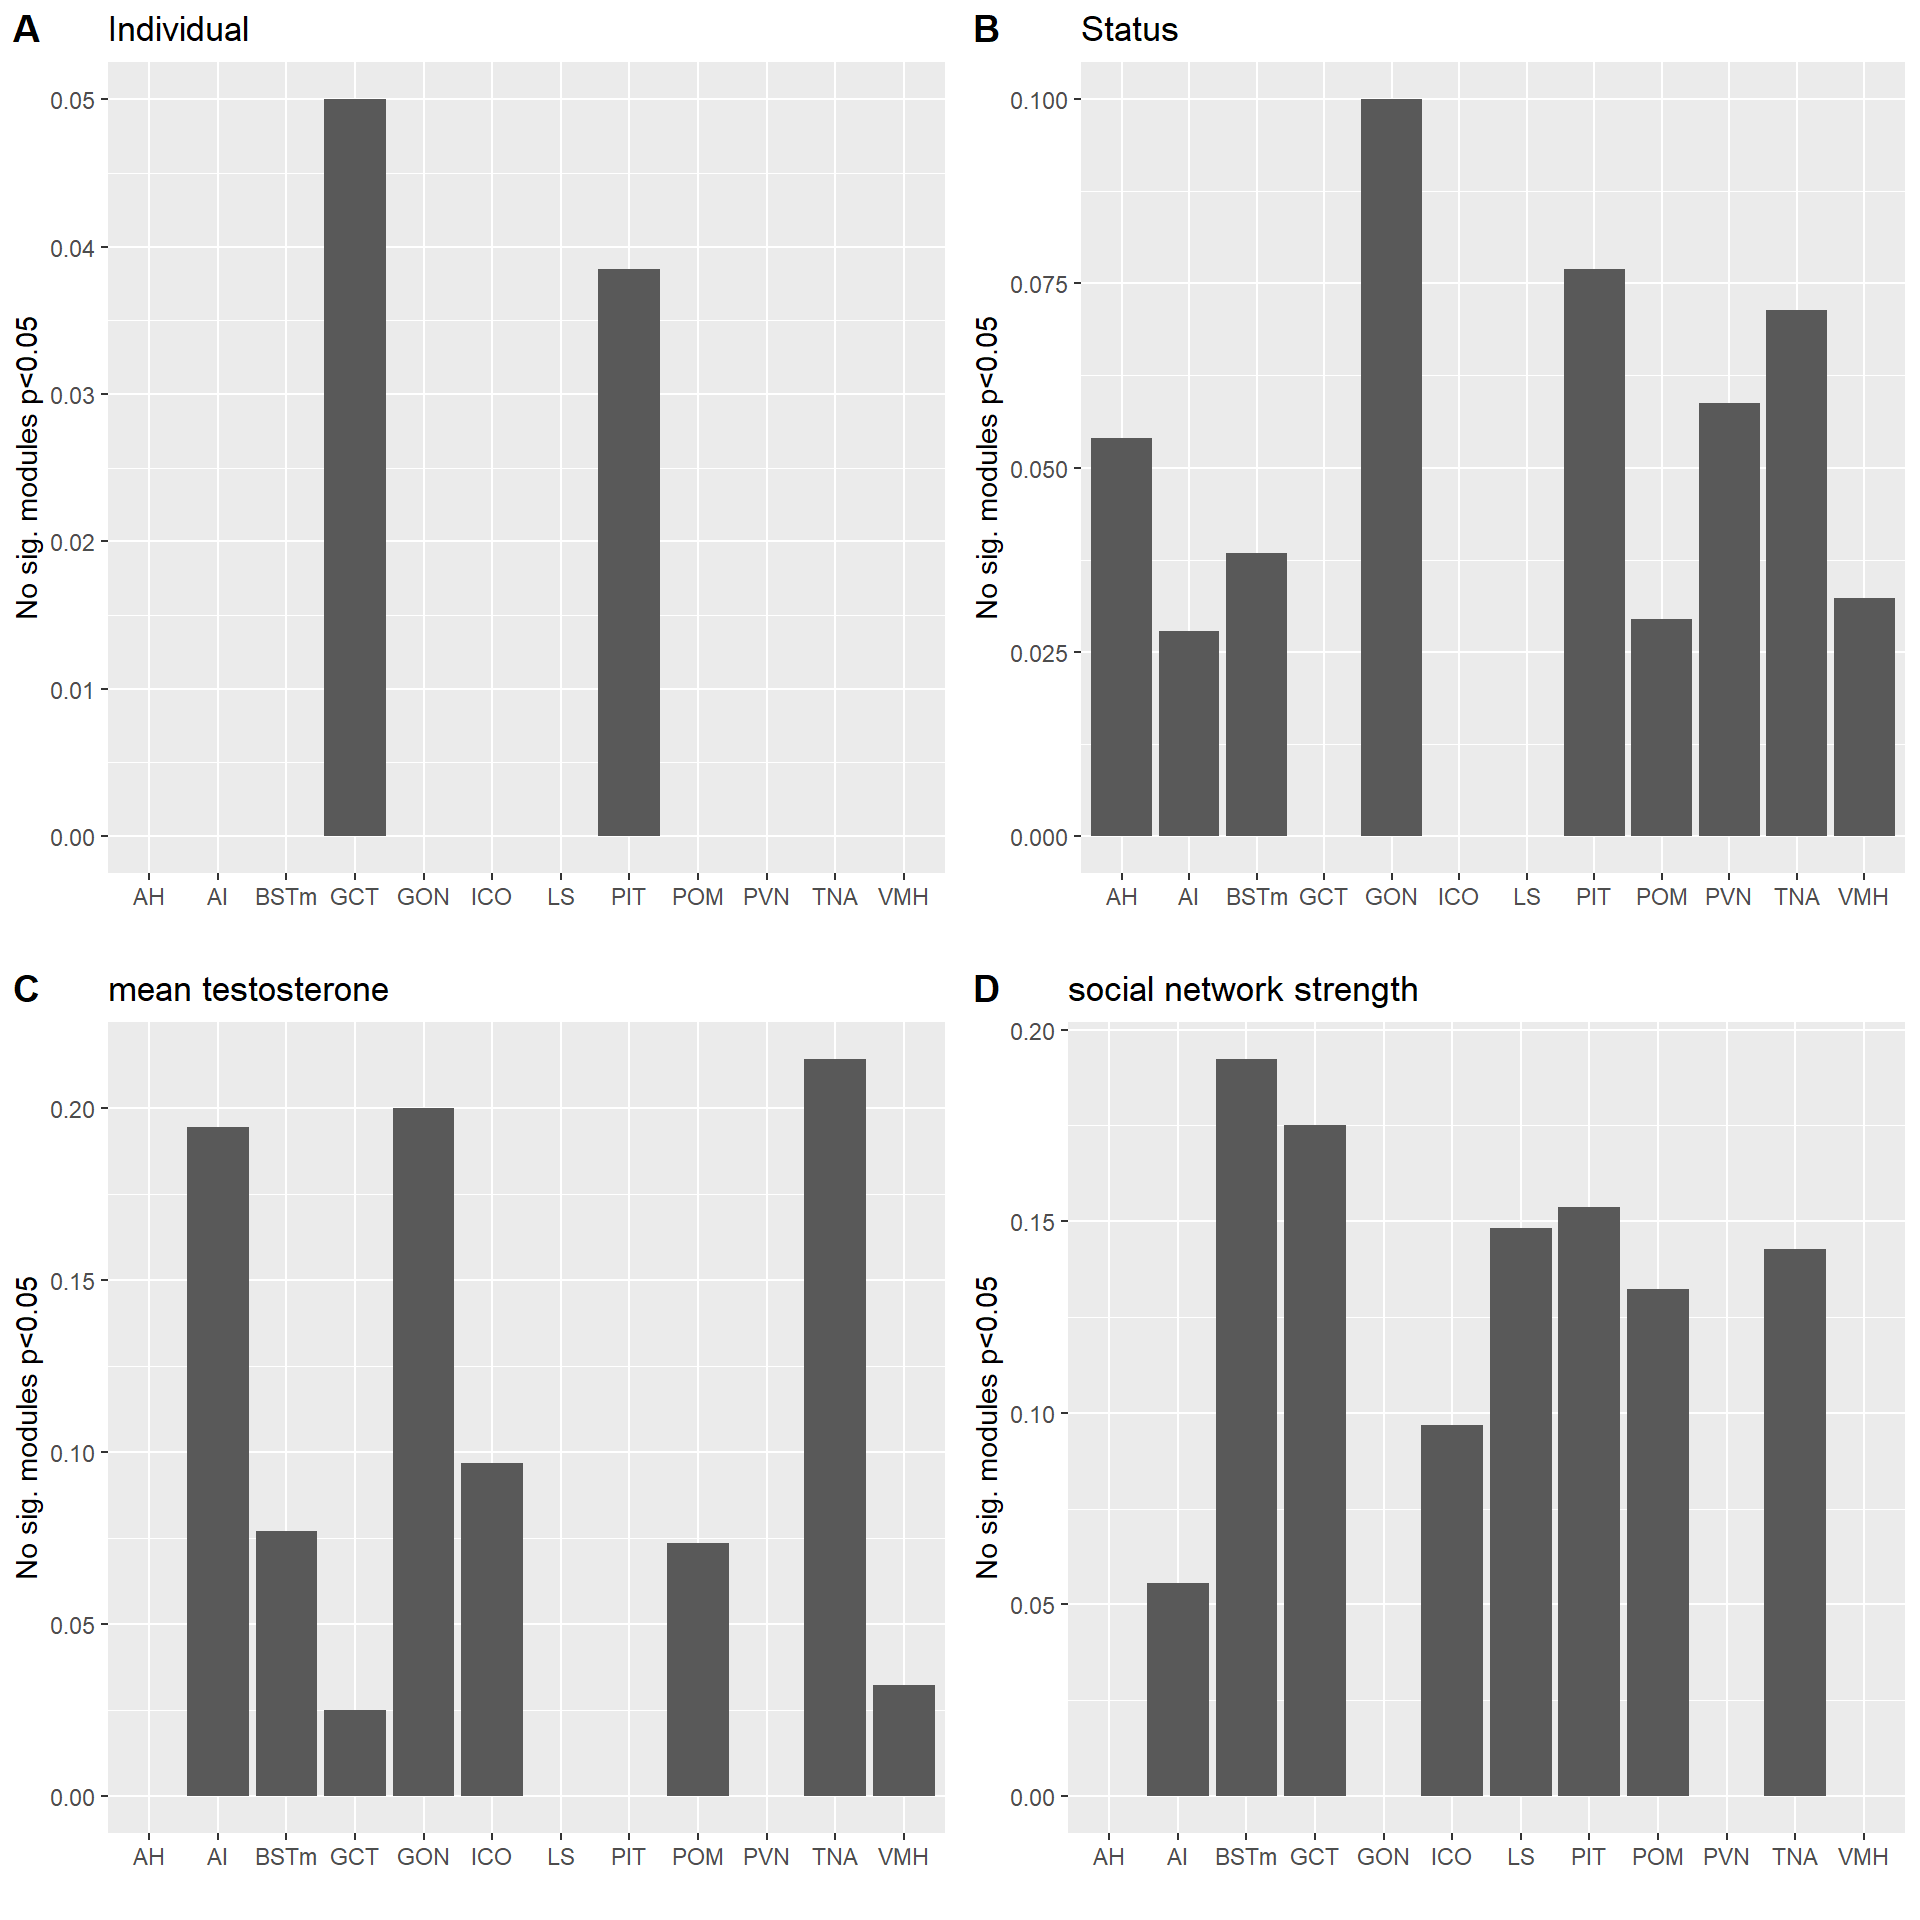

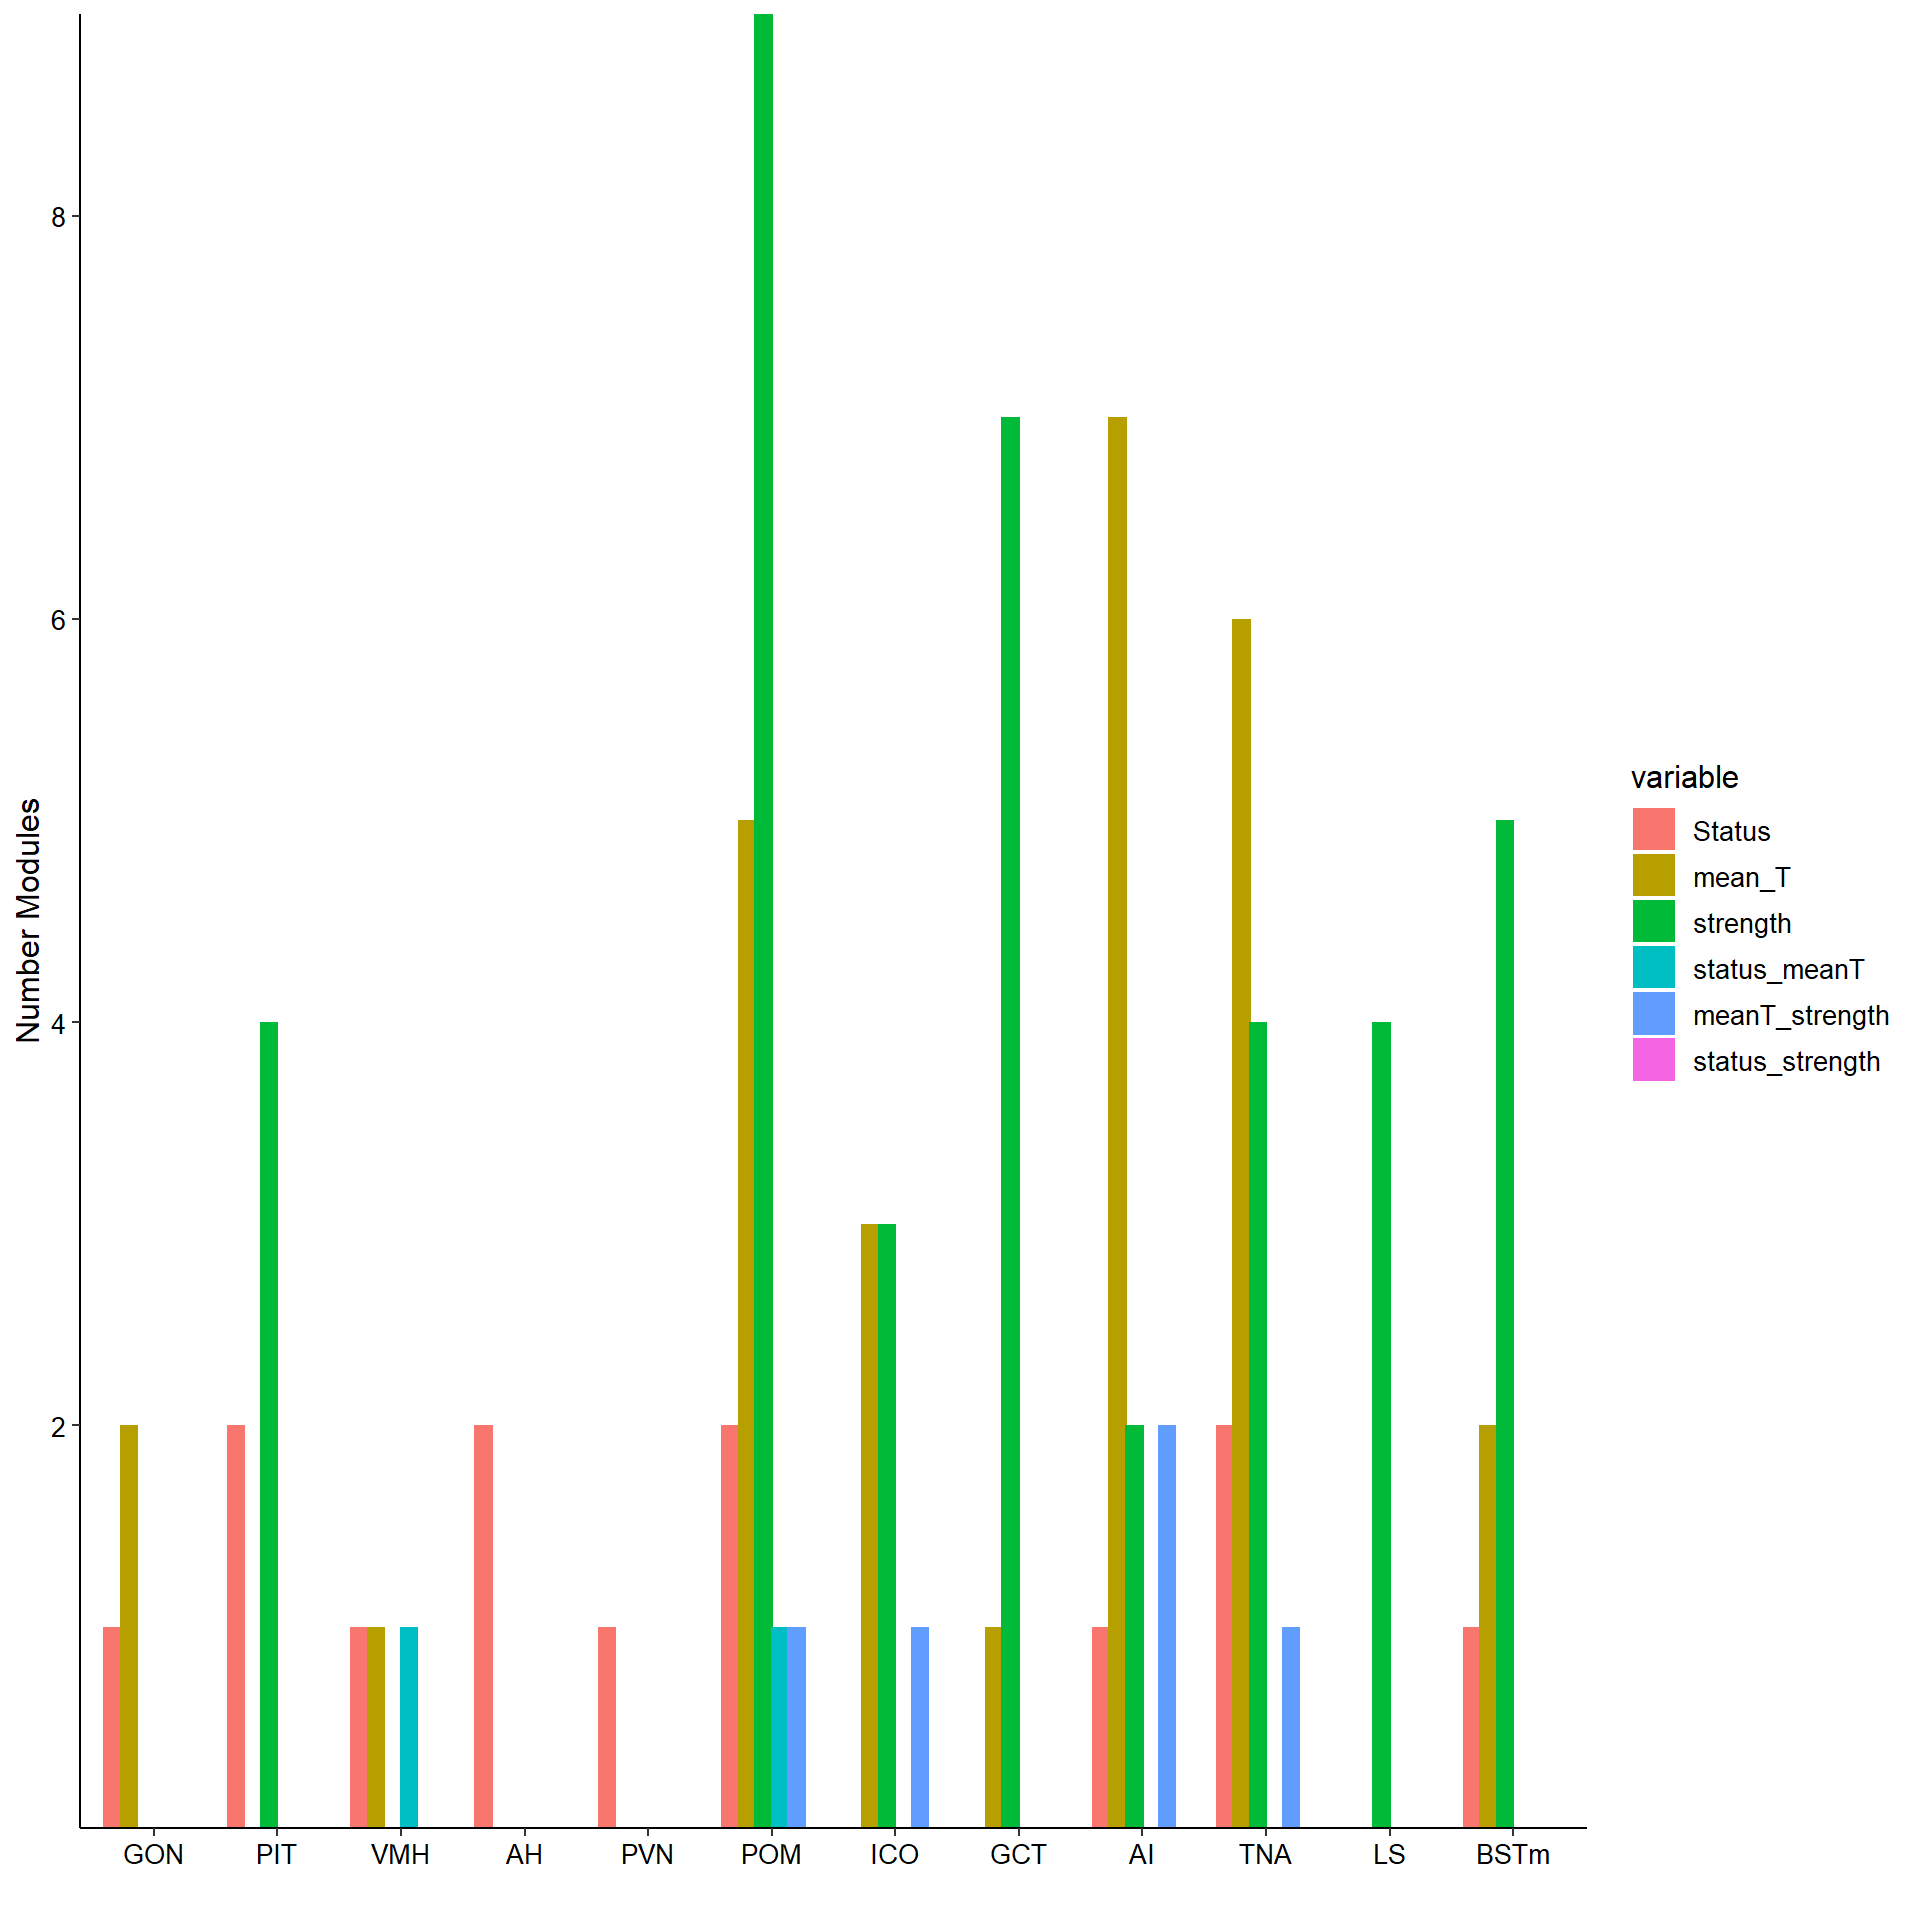
14 Session Info
## R version 4.0.2 (2020-06-22)
## Platform: x86_64-w64-mingw32/x64 (64-bit)
## Running under: Windows 10 x64 (build 19045)
##
## Matrix products: default
##
## locale:
## [1] LC_COLLATE=English_Australia.1252  LC_CTYPE=English_Australia.1252
## [3] LC_MONETARY=English_Australia.1252 LC_NUMERIC=C
## [5] LC_TIME=English_Australia.1252
##
## attached base packages:
##  [1] grid      parallel  stats4    stats     graphics  grDevices utils
##  [8] datasets  methods   base
##
## other attached packages:
##  [1] enrichplot_1.8.1            AnnotationHub_2.20.2
##  [3] BiocFileCache_1.12.0        dbplyr_2.1.1
##  [5] network_1.16.1              RColorBrewer_1.1-2
##  [7] MASS_7.3-51.6               dplyr_1.0.7
##  [9] ggnetwork_0.5.8             igraph_1.2.6
## [11] ggfortify_0.4.11            GGally_2.1.0
## [13] effectsize_0.8.6            car_3.0-8
## [15] carData_3.0-4               viridis_0.6.1
## [17] viridisLite_0.4.0           rrvgo_1.0.2
## [19] UpSetR_1.4.0                limma_3.44.3
## [21] flashClust_1.01-2           org.Hs.eg.db_3.11.4
## [23] AnnotationDbi_1.50.0        clusterProfiler_3.16.1
## [25] fdrtool_1.2.15              ggpubr_0.4.0
## [27] gridExtra_2.3               wesanderson_0.3.6
## [29] VennDiagram_1.6.20          futile.logger_1.4.3
## [31] kableExtra_1.3.1            WGCNA_1.69
## [33] fastcluster_1.1.25          dynamicTreeCut_1.63-1
## [35] pheatmap_1.0.12             lubridate_1.8.0
## [37] DESeq2_1.28.1               SummarizedExperiment_1.18.1
## [39] DelayedArray_0.14.0         matrixStats_0.56.0
## [41] Biobase_2.48.0              GenomicRanges_1.40.0
## [43] GenomeInfoDb_1.24.0         IRanges_2.22.2
## [45] S4Vectors_0.26.1            BiocGenerics_0.34.0
## [47] stringr_1.4.0               PCAtools_2.0.0
## [49] cowplot_1.0.0               lattice_0.20-41
## [51] ggrepel_0.8.2               ggplot2_3.4.4
## [53] reshape2_1.4.4              plyr_1.8.6
##
## loaded via a namespace (and not attached):
##   [1] rappdirs_0.3.1                ragg_1.2.1
##   [3] tidyr_1.1.4                   acepack_1.4.1
##   [5] bit64_0.9-7                   knitr_1.29
##   [7] irlba_2.3.3                   data.table_1.13.0
##   [9] rpart_4.1-15                  RCurl_1.98-1.2
##  [11] doParallel_1.0.15             generics_0.0.2
##  [13] snow_0.4-3                    preprocessCore_1.50.0
##  [15] lambda.r_1.2.4                RSQLite_2.2.0
##  [17] europepmc_0.4                 bit_4.0.4
##  [19] webshot_0.5.2                 xml2_1.3.2
##  [21] httpuv_1.5.4                  assertthat_0.2.1
##  [23] xfun_0.29                     hms_1.1.1
##  [25] jquerylib_0.1.4               evaluate_0.14
##  [27] promises_1.1.1                fansi_0.4.1
##  [29] progress_1.2.2                readxl_1.3.1
##  [31] DBI_1.1.0                     geneplotter_1.66.0
##  [33] htmlwidgets_1.5.3             reshape_0.8.8
##  [35] purrr_0.3.4                   ellipsis_0.3.2
##  [37] backports_1.1.7               insight_0.19.6
##  [39] annotate_1.66.0               gridBase_0.4-7
##  [41] vctrs_0.6.5                   abind_1.4-5
##  [43] withr_2.5.2                   ggforce_0.3.2
##  [45] triebeard_0.3.0               treemap_2.4-2
##  [47] checkmate_2.0.0               prettyunits_1.1.1
##  [49] cluster_2.1.0                 DOSE_3.14.0
##  [51] crayon_1.4.2                  genefilter_1.70.0
##  [53] pkgconfig_2.0.3               slam_0.1-47
##  [55] labeling_0.3                  tweenr_1.0.1
##  [57] nlme_3.1-148                  wordcloud_2.6
##  [59] nnet_7.3-14                   rlang_1.1.2
##  [61] lifecycle_1.0.4               downloader_0.4
##  [63] rsvd_1.0.3                    cellranger_1.1.0
##  [65] polyclip_1.10-0               datawizard_0.9.0
##  [67] Matrix_1.6-4                  urltools_1.7.3
##  [69] base64enc_0.1-3               ggridges_0.5.3
##  [71] png_0.1-7                     parameters_0.21.3
##  [73] bitops_1.0-6                  blob_1.2.1
##  [75] DelayedMatrixStats_1.10.0     qvalue_2.20.0
##  [77] jpeg_0.1-8.1                  rstatix_0.7.0
##  [79] gridGraphics_0.5-1            ggsignif_0.6.0
##  [81] scales_1.3.0                  memoise_1.1.0
##  [83] magrittr_2.0.1                zlibbioc_1.34.0
##  [85] compiler_4.0.2                scatterpie_0.1.5
##  [87] dqrng_0.2.1                   cli_3.6.1
##  [89] XVector_0.28.0                htmlTable_2.0.1
##  [91] formatR_1.8                   Formula_1.2-3
##  [93] mgcv_1.8-31                   tidyselect_1.1.0
##  [95] stringi_1.4.6                 forcats_0.5.1
##  [97] textshaping_0.3.6             highr_0.8
##  [99] yaml_2.2.1                    GOSemSim_2.14.2
## [101] BiocSingular_1.4.0            locfit_1.5-9.4
## [103] latticeExtra_0.6-29           fastmatch_1.1-0
## [105] tools_4.0.2                   rio_0.5.16
## [107] rstudioapi_0.13               foreach_1.5.0
## [109] foreign_0.8-80                farver_2.0.3
## [111] ggraph_2.0.5                  digest_0.6.25
## [113] rvcheck_0.1.8                 BiocManager_1.30.10
## [115] shiny_1.5.0                   Rcpp_1.0.7
## [117] broom_0.7.10                  BiocVersion_3.11.1
## [119] later_1.1.0.1                 httr_1.4.2
## [121] colorspace_1.4-1              rvest_1.0.2
## [123] XML_3.99-0.5                  splines_4.0.2
## [125] graphlayouts_0.7.1            ggplotify_0.0.5
## [127] systemfonts_1.0.3             xtable_1.8-4
## [129] jsonlite_1.7.2                futile.options_1.0.1
## [131] tidygraph_1.2.0               NLP_0.2-1
## [133] R6_2.4.1                      tm_0.7-8
## [135] Hmisc_4.4-0                   pillar_1.6.4
## [137] htmltools_0.5.2               mime_0.9
## [139] glue_1.5.1                    fastmap_1.1.0
## [141] BiocParallel_1.22.0           interactiveDisplayBase_1.26.3
## [143] codetools_0.2-16              fgsea_1.14.0
## [145] utf8_1.1.4                    tibble_3.1.6
## [147] curl_4.3                      zip_2.0.4
## [149] GO.db_3.11.4                  openxlsx_4.1.5
## [151] survival_3.2-3                rmarkdown_2.11
## [153] munsell_0.5.0                 DO.db_2.9
## [155] GenomeInfoDbData_1.2.3        iterators_1.0.12
## [157] impute_1.62.0                 haven_2.3.1
## [159] gtable_0.3.0                  bayestestR_0.13.1